FreshRSS

🔒
❌ About FreshRSS
There are new articles available, click to refresh the page.
☐ ☆ ✇ Invest in Quality

Nvidia Earnings Breakdown 💽

By: Invest In Assets 📈

Hi investor 👋

Today we’re breaking down Nvidia’s latest earnings report.

Let’s get into it 👇

1. The Numbers: A Beat on Every Line

Nvidia didn’t just beat estimates. It blew them out of the water.

Here’s the scorecard:

  • Revenue: $96.2 billion (consensus: $92.3B)

    • +106% year-over-year, up 18% sequentially

  • Non-GAAP EPS: $2.22 (consensus: $2.09)

    • +120% YoY

  • Data Cent…

Read more

☐ ☆ ✇ Invest in Quality

Factsheet August 2026 📈

By: Invest In Assets 📈

Hello, partner 👋

July was a month where our core holdings did everything right. August was the opposite kind of month: the AI-spending debate that has hung over markets all year came back, bond yields spiked to multi-year highs, and a handful of our biggest positions took a real step back even as a couple of names had standout months.

And yet the Quality…

Read more

☐ ☆ ✇ Invest in Quality

Top 5 Buys: August 2026 💎

By: Invest In Assets 📈

Hi partner! 👋🏻

Welcome to the August edition of Top 5 Buys.

You can access our Top 25 Buys for 2026 list as a premium member here.

In this article, we will discuss our top stock picks for August 2026.

Let’s get into it 👇

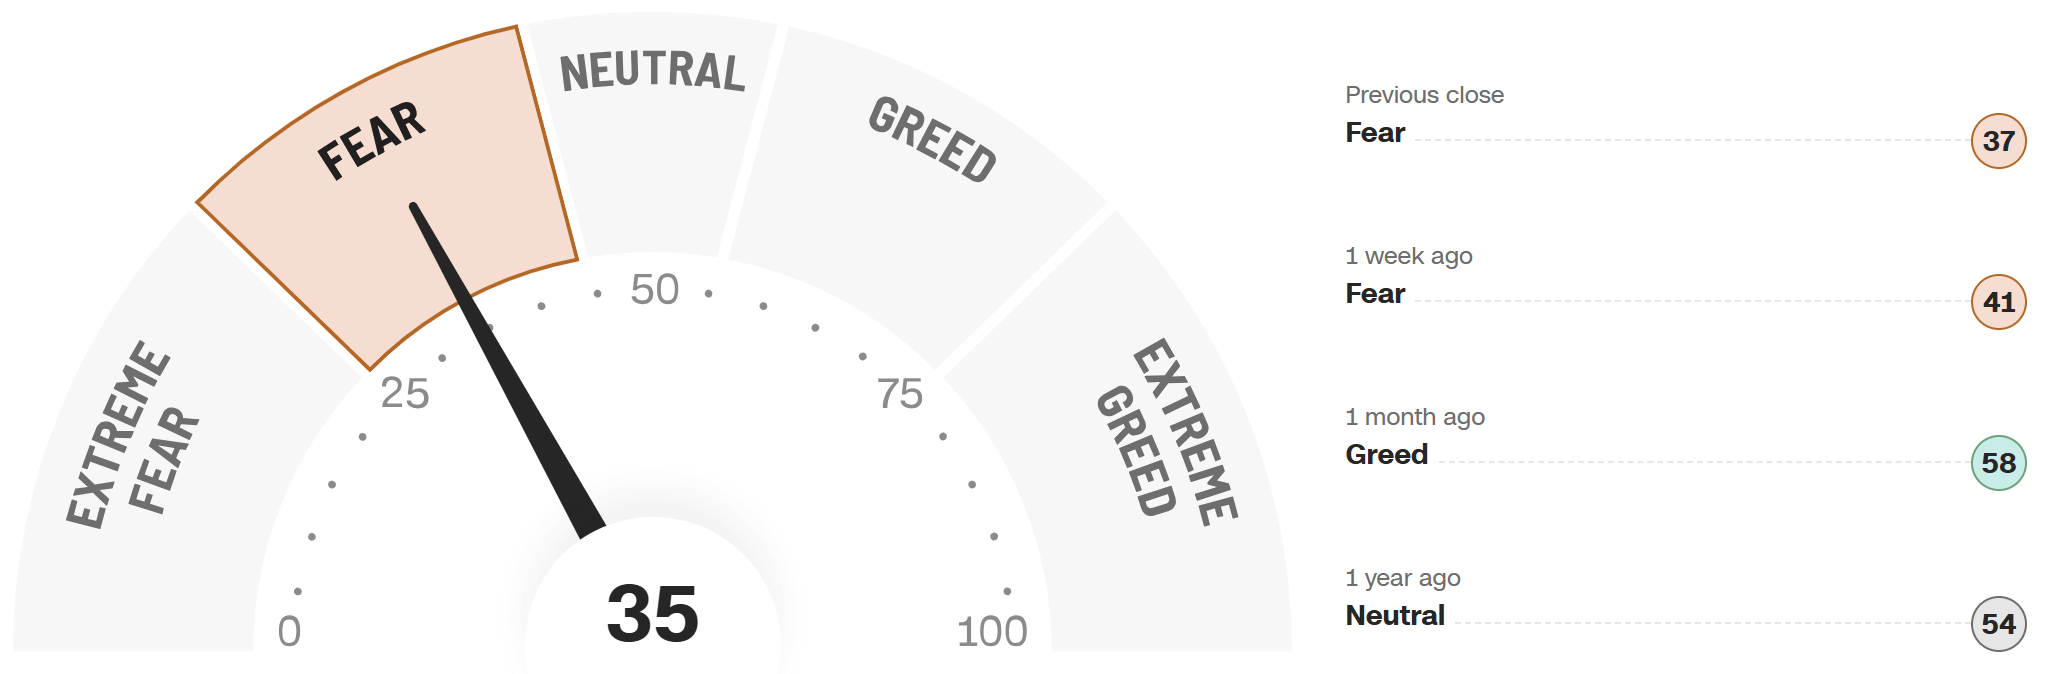
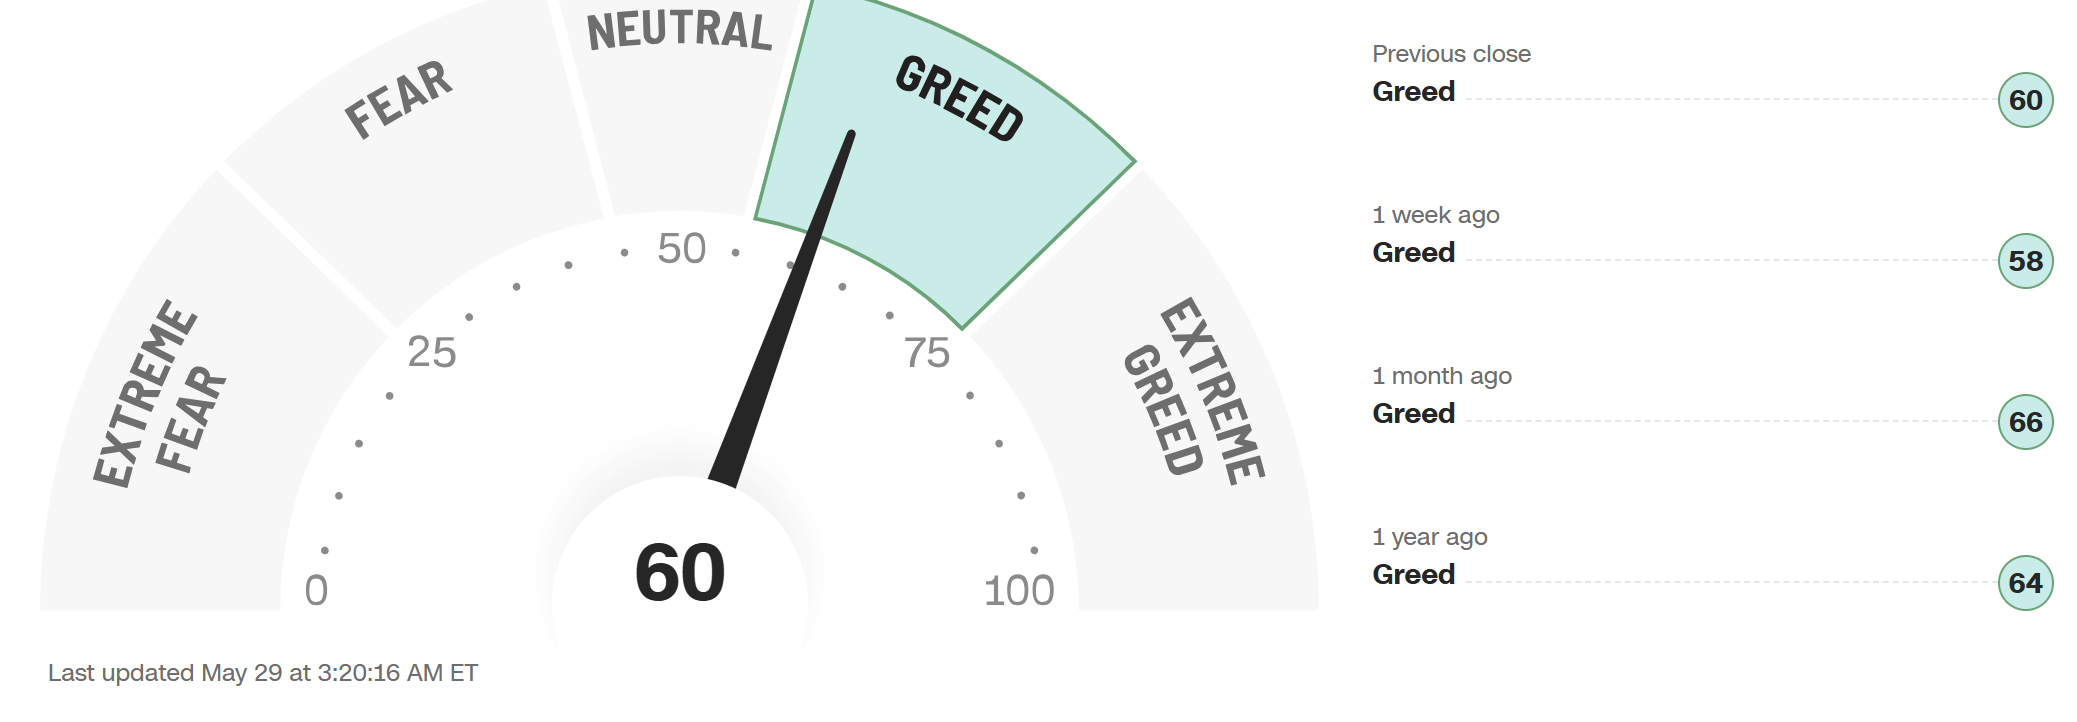
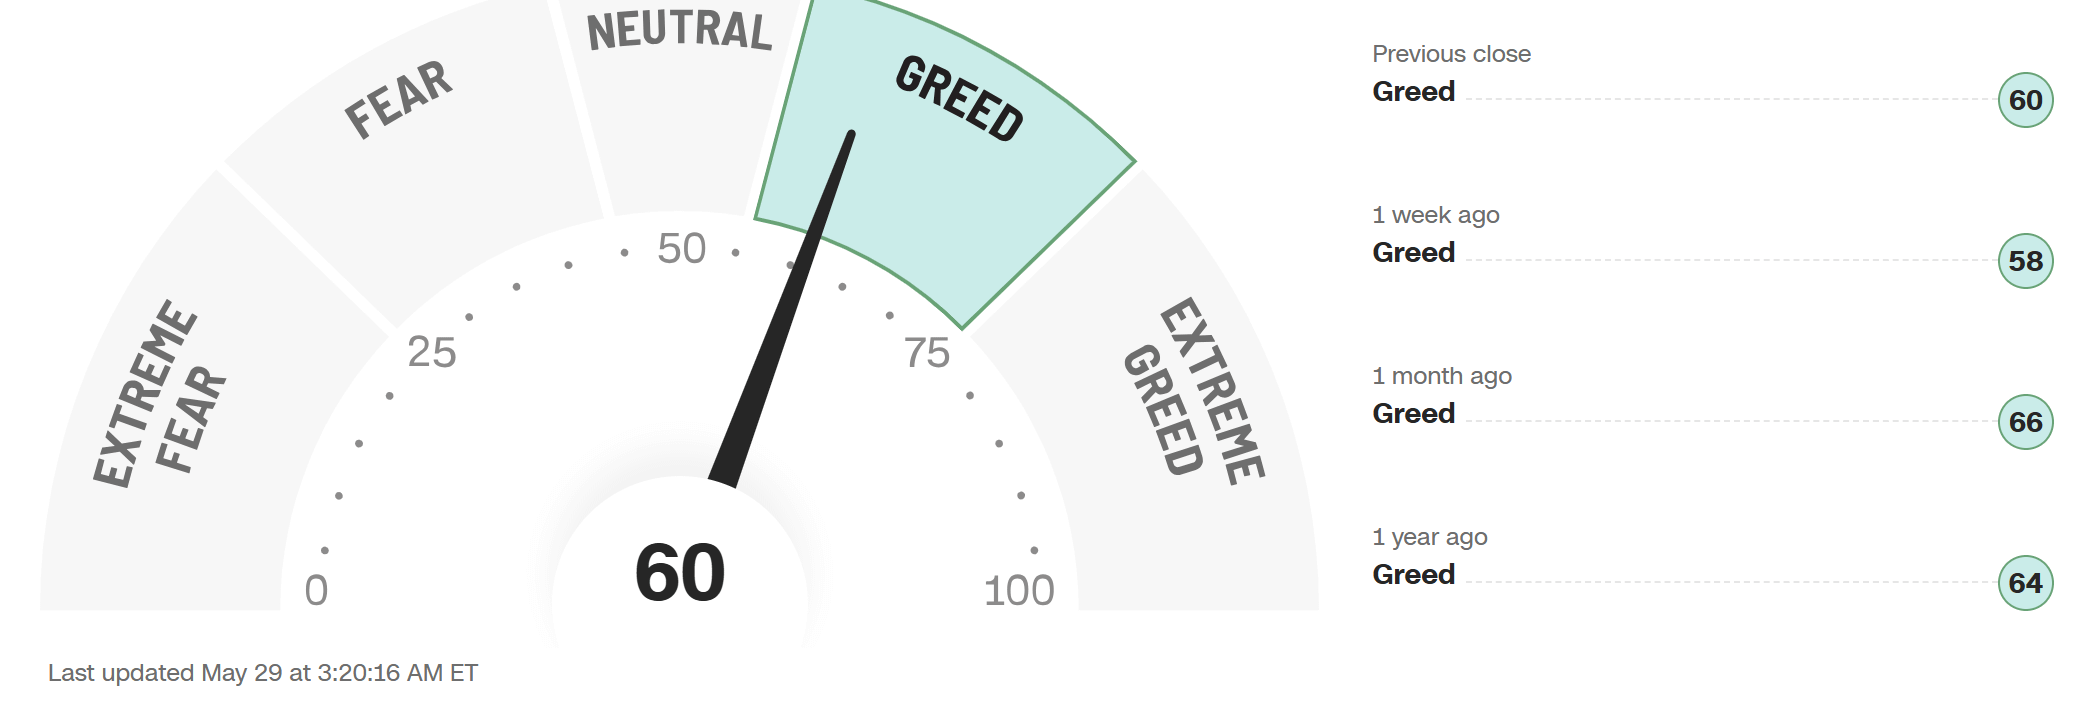
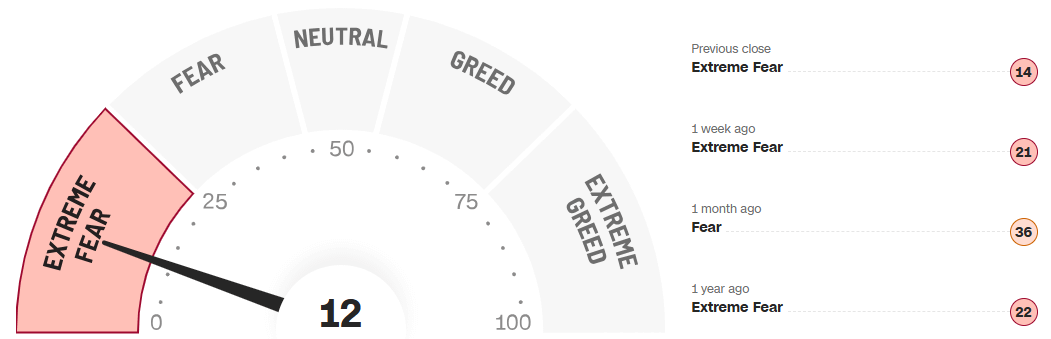
The Market Sentiment: Greed

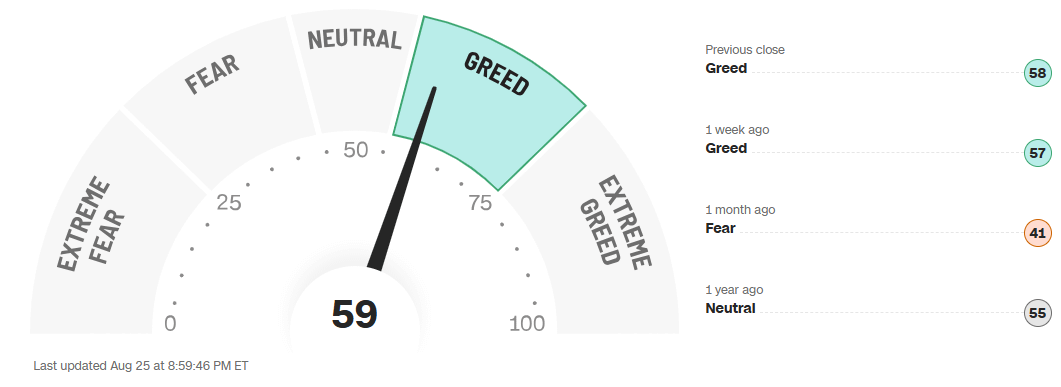
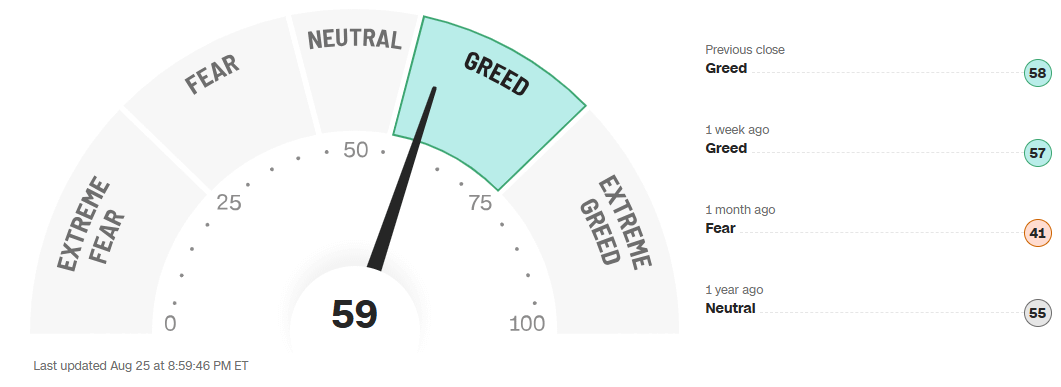
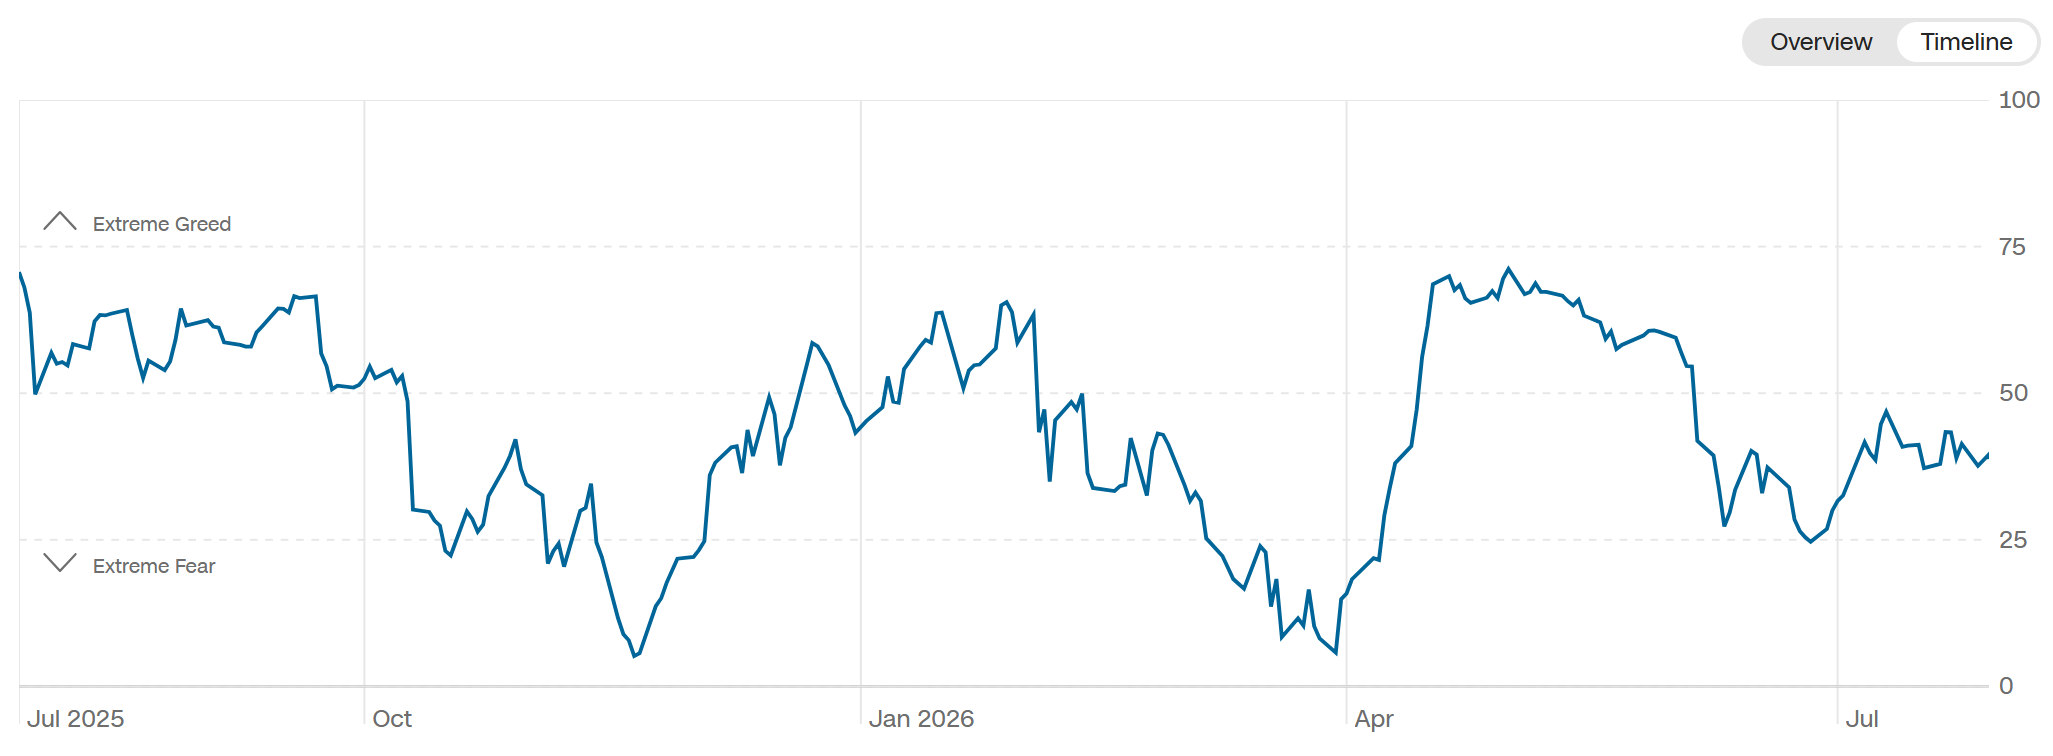
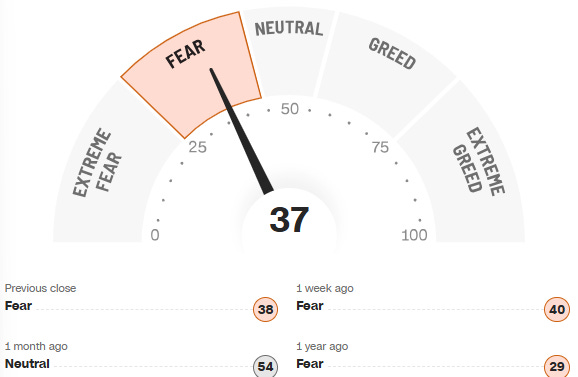
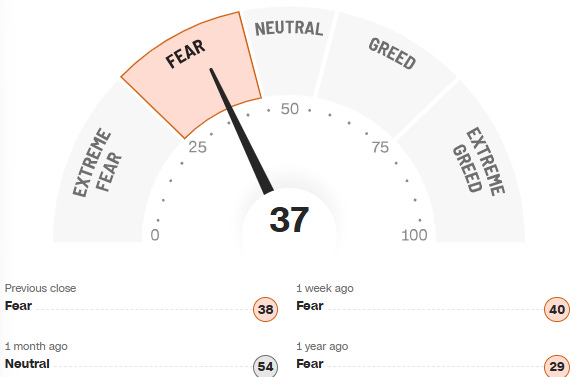
The Fear & Greed Index is currently at 59: Greed.

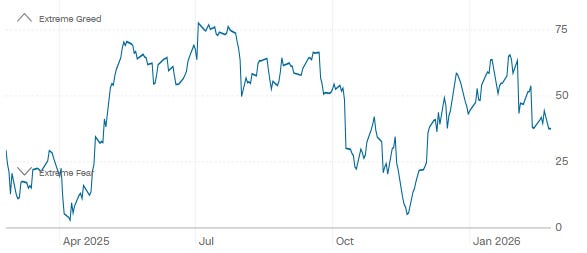
Last month we were sitting at 41, deep in Fear territory, with semiconductors getting smoked. In a matter of weeks, the market has flipped moods entirely.

That flip matters for how you should read this list. When the whole market was scared last month, cheap quality businesses were everywhere. Now that greed is back, the easy pickings are gone, most of what’s “on sale” has been repriced back up with everything else.

But not everything got the memo.

The five businesses below are still trading at a real discount to where the market had them a year ago, or they’re sitting in the middle of a genuine debate Wall Street hasn’t resolved yet.

Here are this month’s Top 5 Buys 👇

This is not investment advice. Always conduct your own due diligence and make your own investment decisions.

Invest in Quality is a reader-supported publication. To receive new posts and support my work, consider becoming a free or paid subscriber.

Top 5 Quality Buys August 2026 🚀

Uber 🚗

Uber currently trades at $78, down ~20% from its all time highs.

Nothing about the core business explains the drawdown.

So why is the stock stuck below its highs?

Robotaxis. Specifically, a growing worry that Uber is building its future revenue streams on infrastructure it doesn’t own.

The Business Model

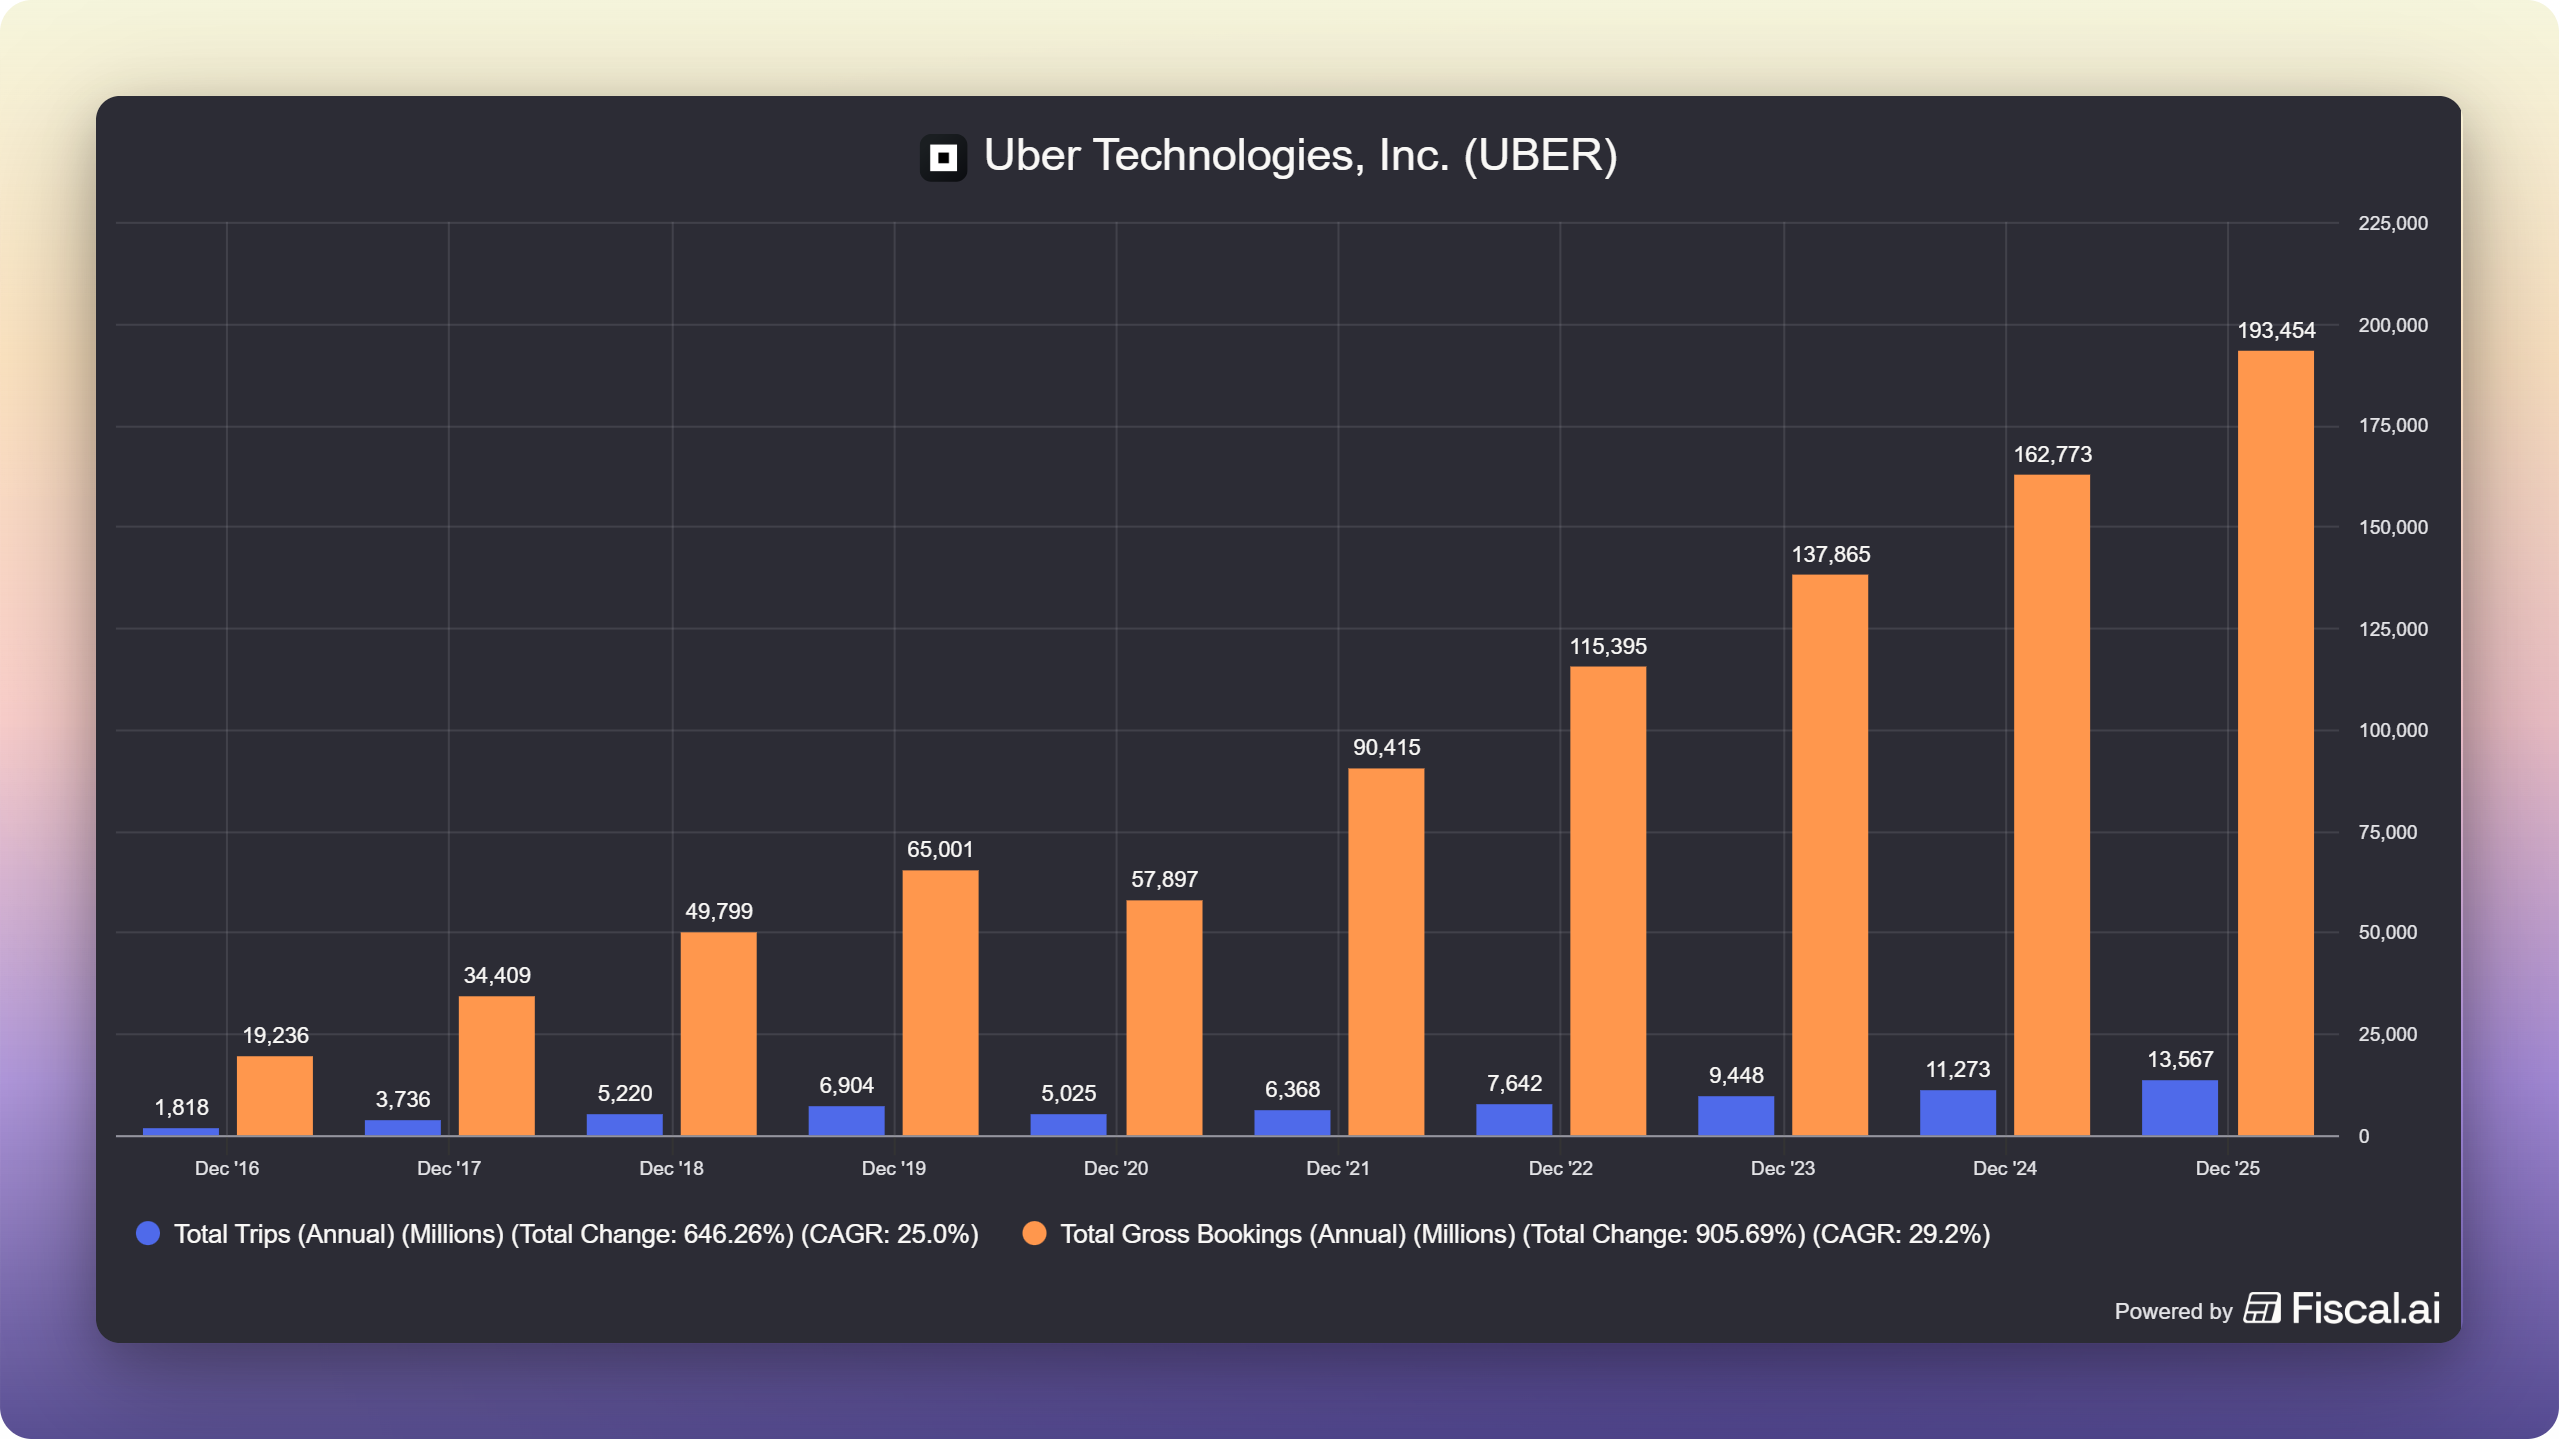
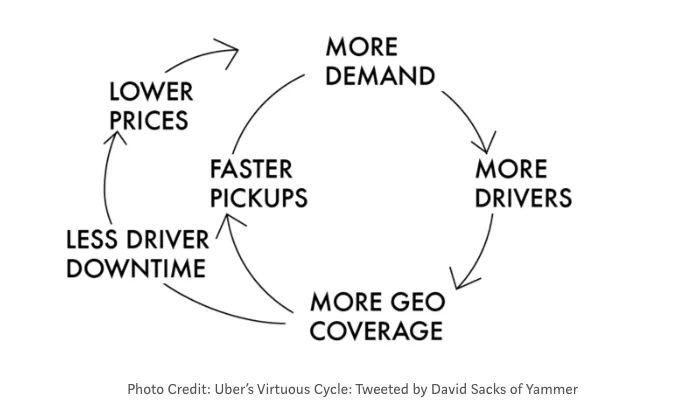
Uber’s moat has never been the cars. It’s the demand and the consumer habit. More than 40 million trips a day flow through the app, and that density is what makes Uber valuable to anyone trying to sell transportation services.

The same pitch can be used for the autonomous era.

Uber has signed up roughly 30 partners across robotaxis, delivery bots, and self-driving trucks: Waymo, Pony.ai, Nvidia, Rivian, Motional, Verne, and wants to be the marketplace where all of that capacity meets Uber’s demand.

CEO Dara Khosrowshahi put it simply: We get to work with everybody in the ecosystem.

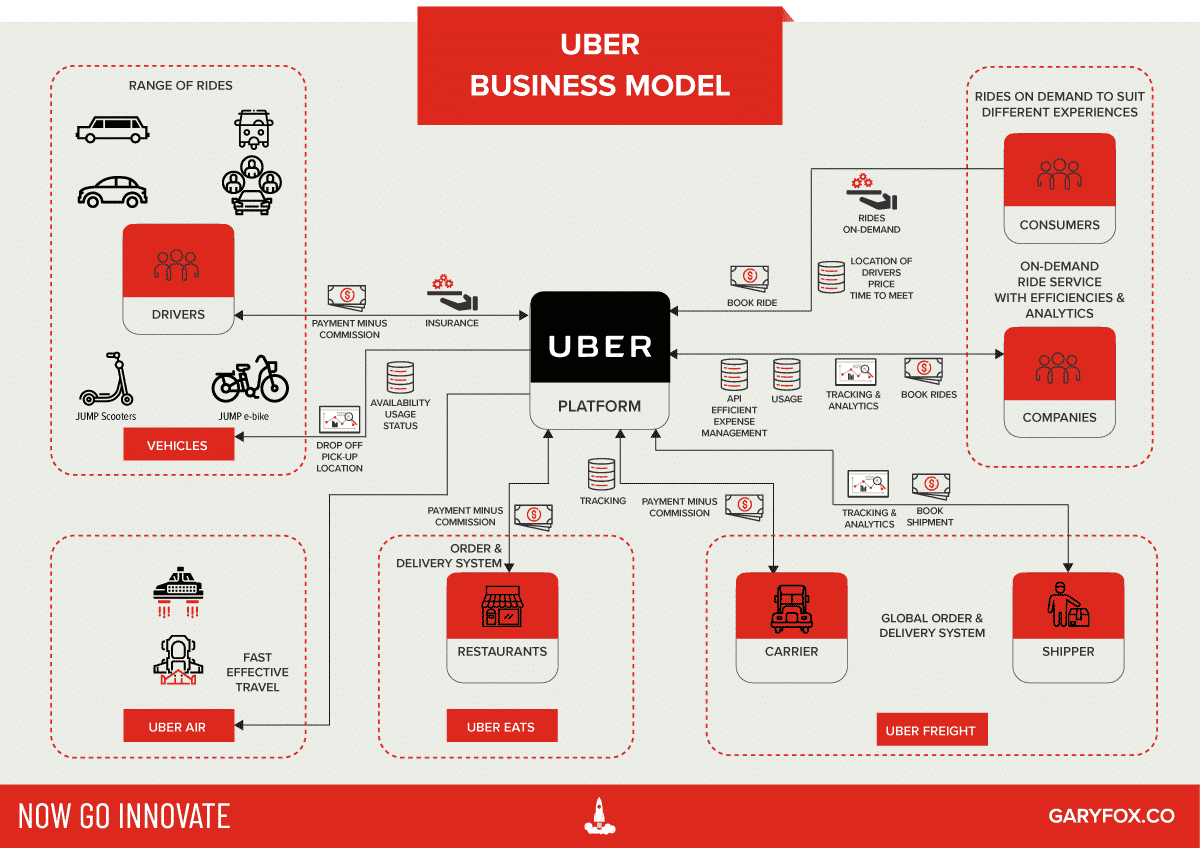
Uber Business Model - 1 Platform Attacking New Markets

What Changed?

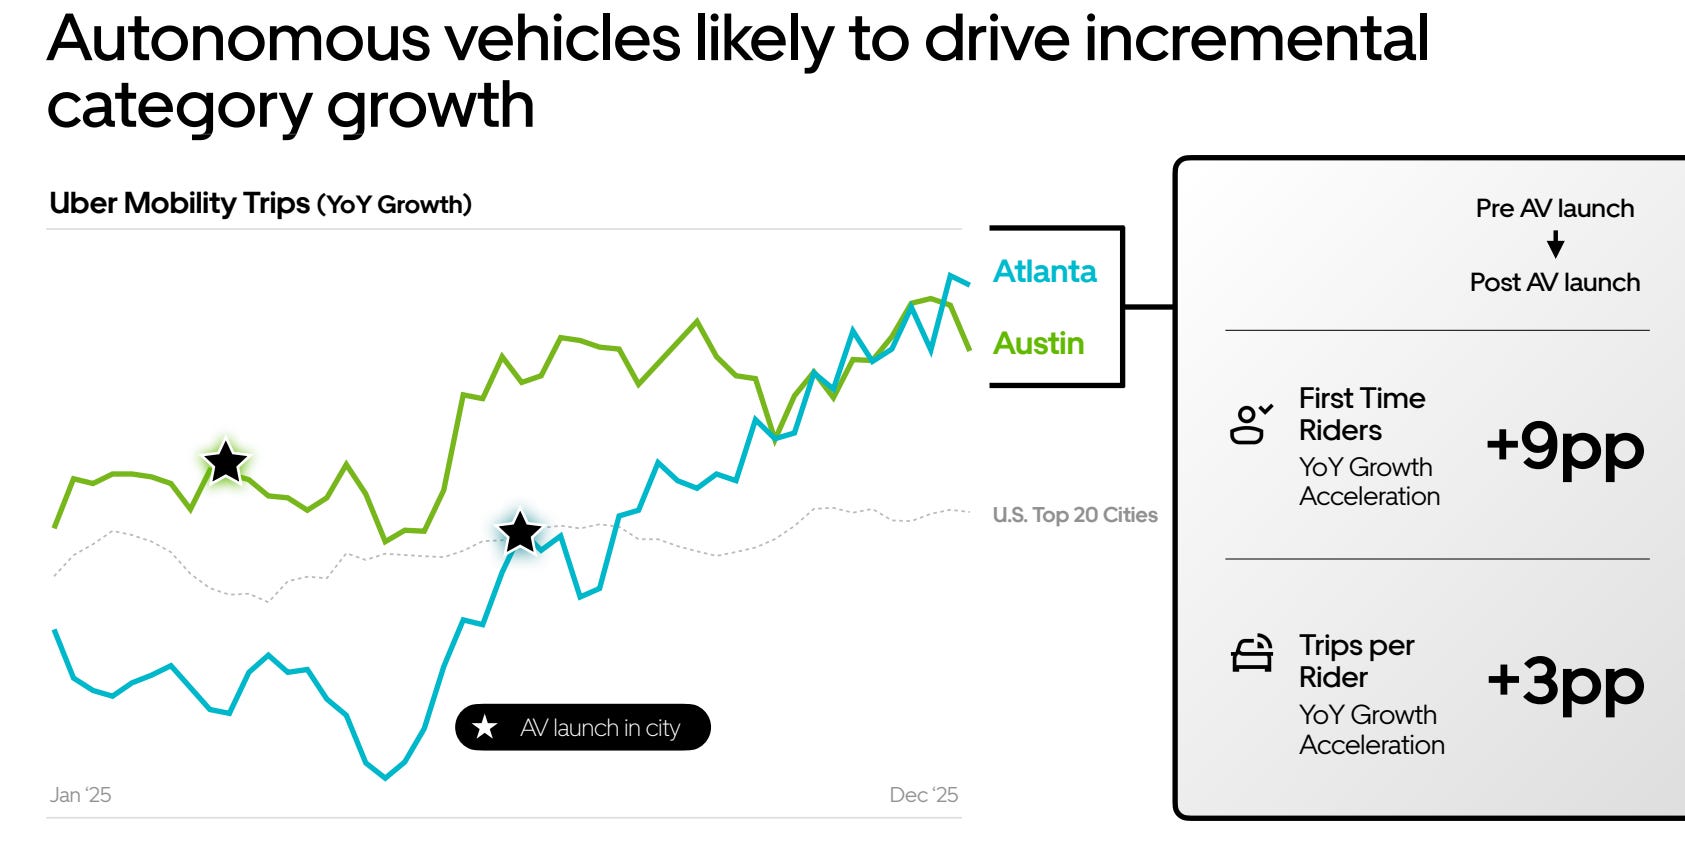
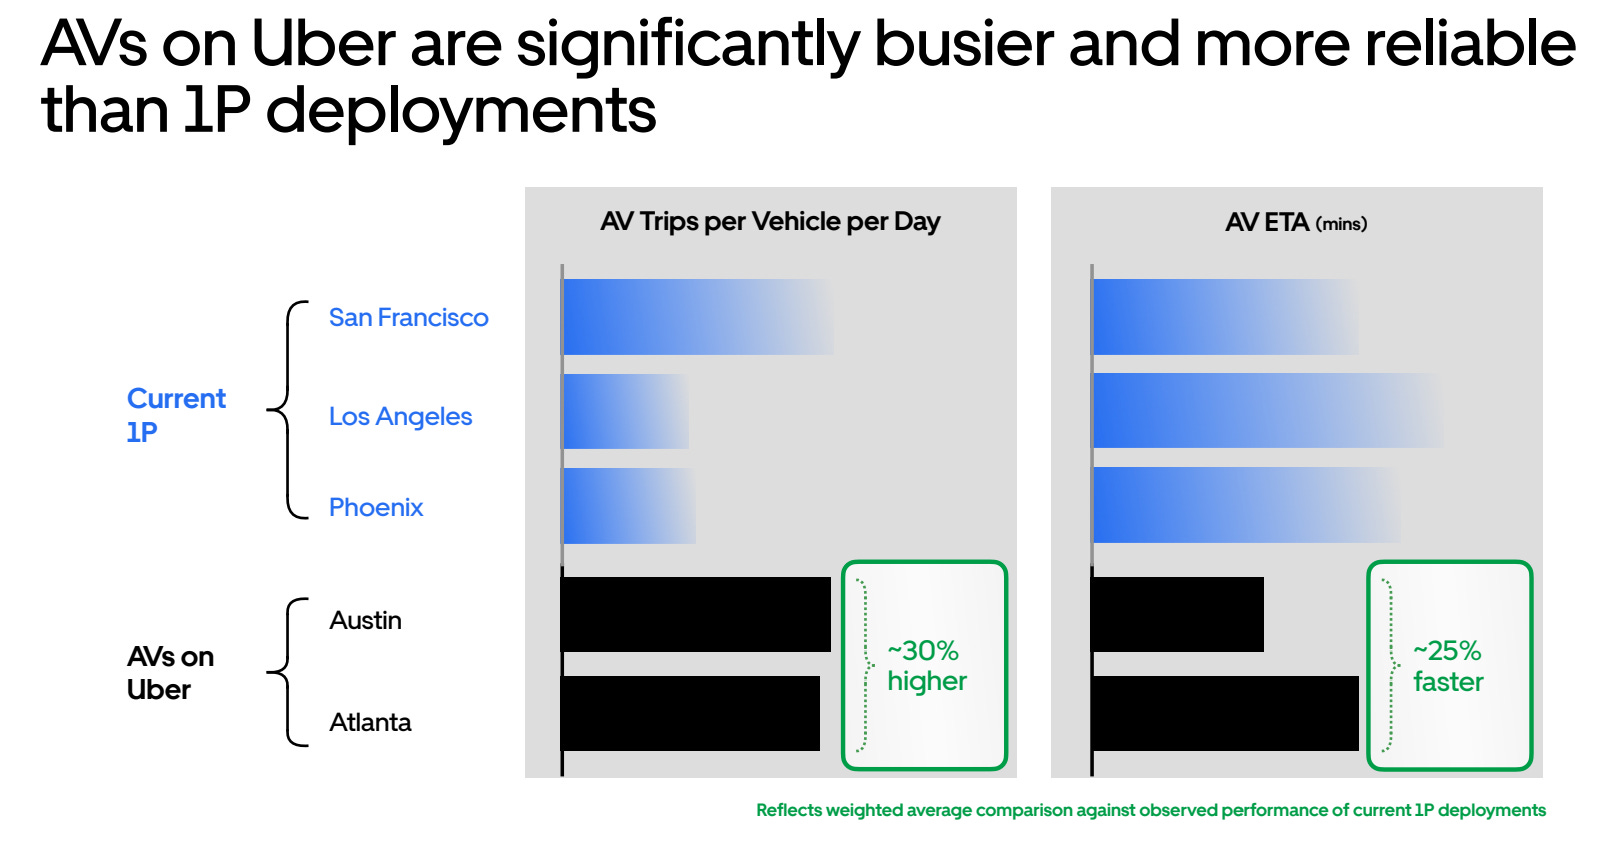
Autonomous trips on the platform grew ~10x over the past year. Management is targeting driverless service in up to 15 cities by the end of 2026. Uber just committed up to $1.25 billion to Rivian through 2031 for its own fleet of autonomous R2 SUVs.

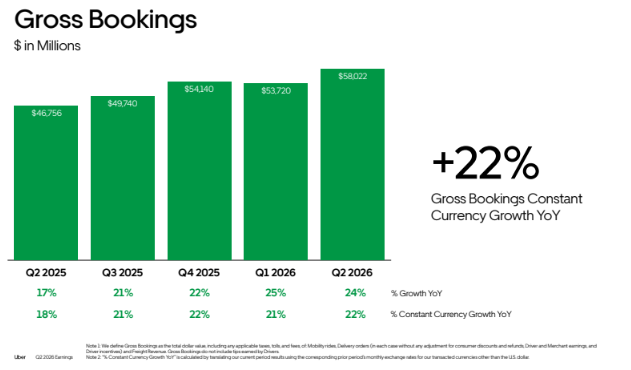
Uber’s core business is not slowing down. Gross bookings grew 22% to $58 billion. Trips grew 20% to 3.64 billion. Revenue grew 14% to $13.2 billion.

So what’s the bear case?

The Motley Fool put it well:

Uber doesn’t own the autonomous cars driving its own growth story.

If Waymo, or any single AV operator, reaches enough scale to run its own consumer-facing network, Uber’s aggregation advantage could stop being an advantage.

Paying up for a Rivian stake is a sensible hedge against that risk. It’s also, as the Fool noted, “a quiet admission” that owning the demand layer alone may not be enough.

That’s a real risk. It’s also years away from resolving either direction.

The Valuation

The average analyst target has Uber at $104.25. This implies meaningful upside if the market simply re-rates the core business at its current growth rate, before giving Uber any credit for winning the autonomous platform bet.

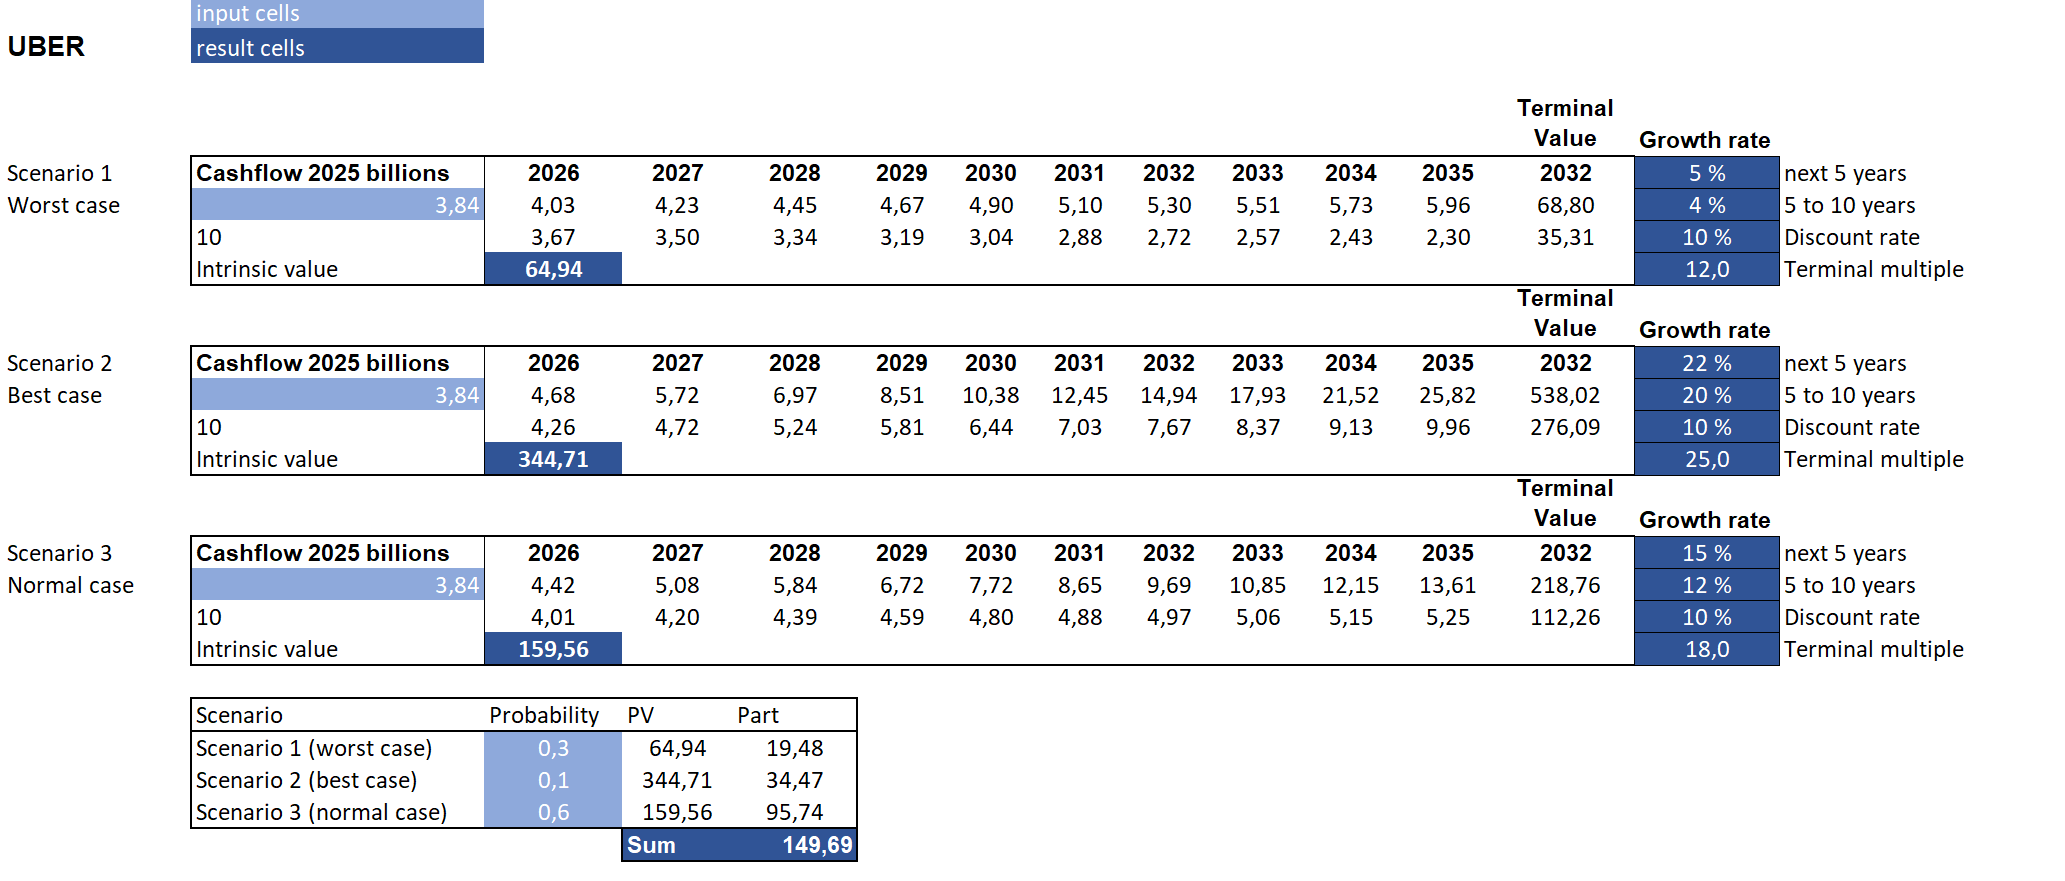
The consensus among investors is that Uber is 27-33% undervalued. That is a wide gap for a company that is growing bookings at 22% with a business model that owns the consumer habit layer.

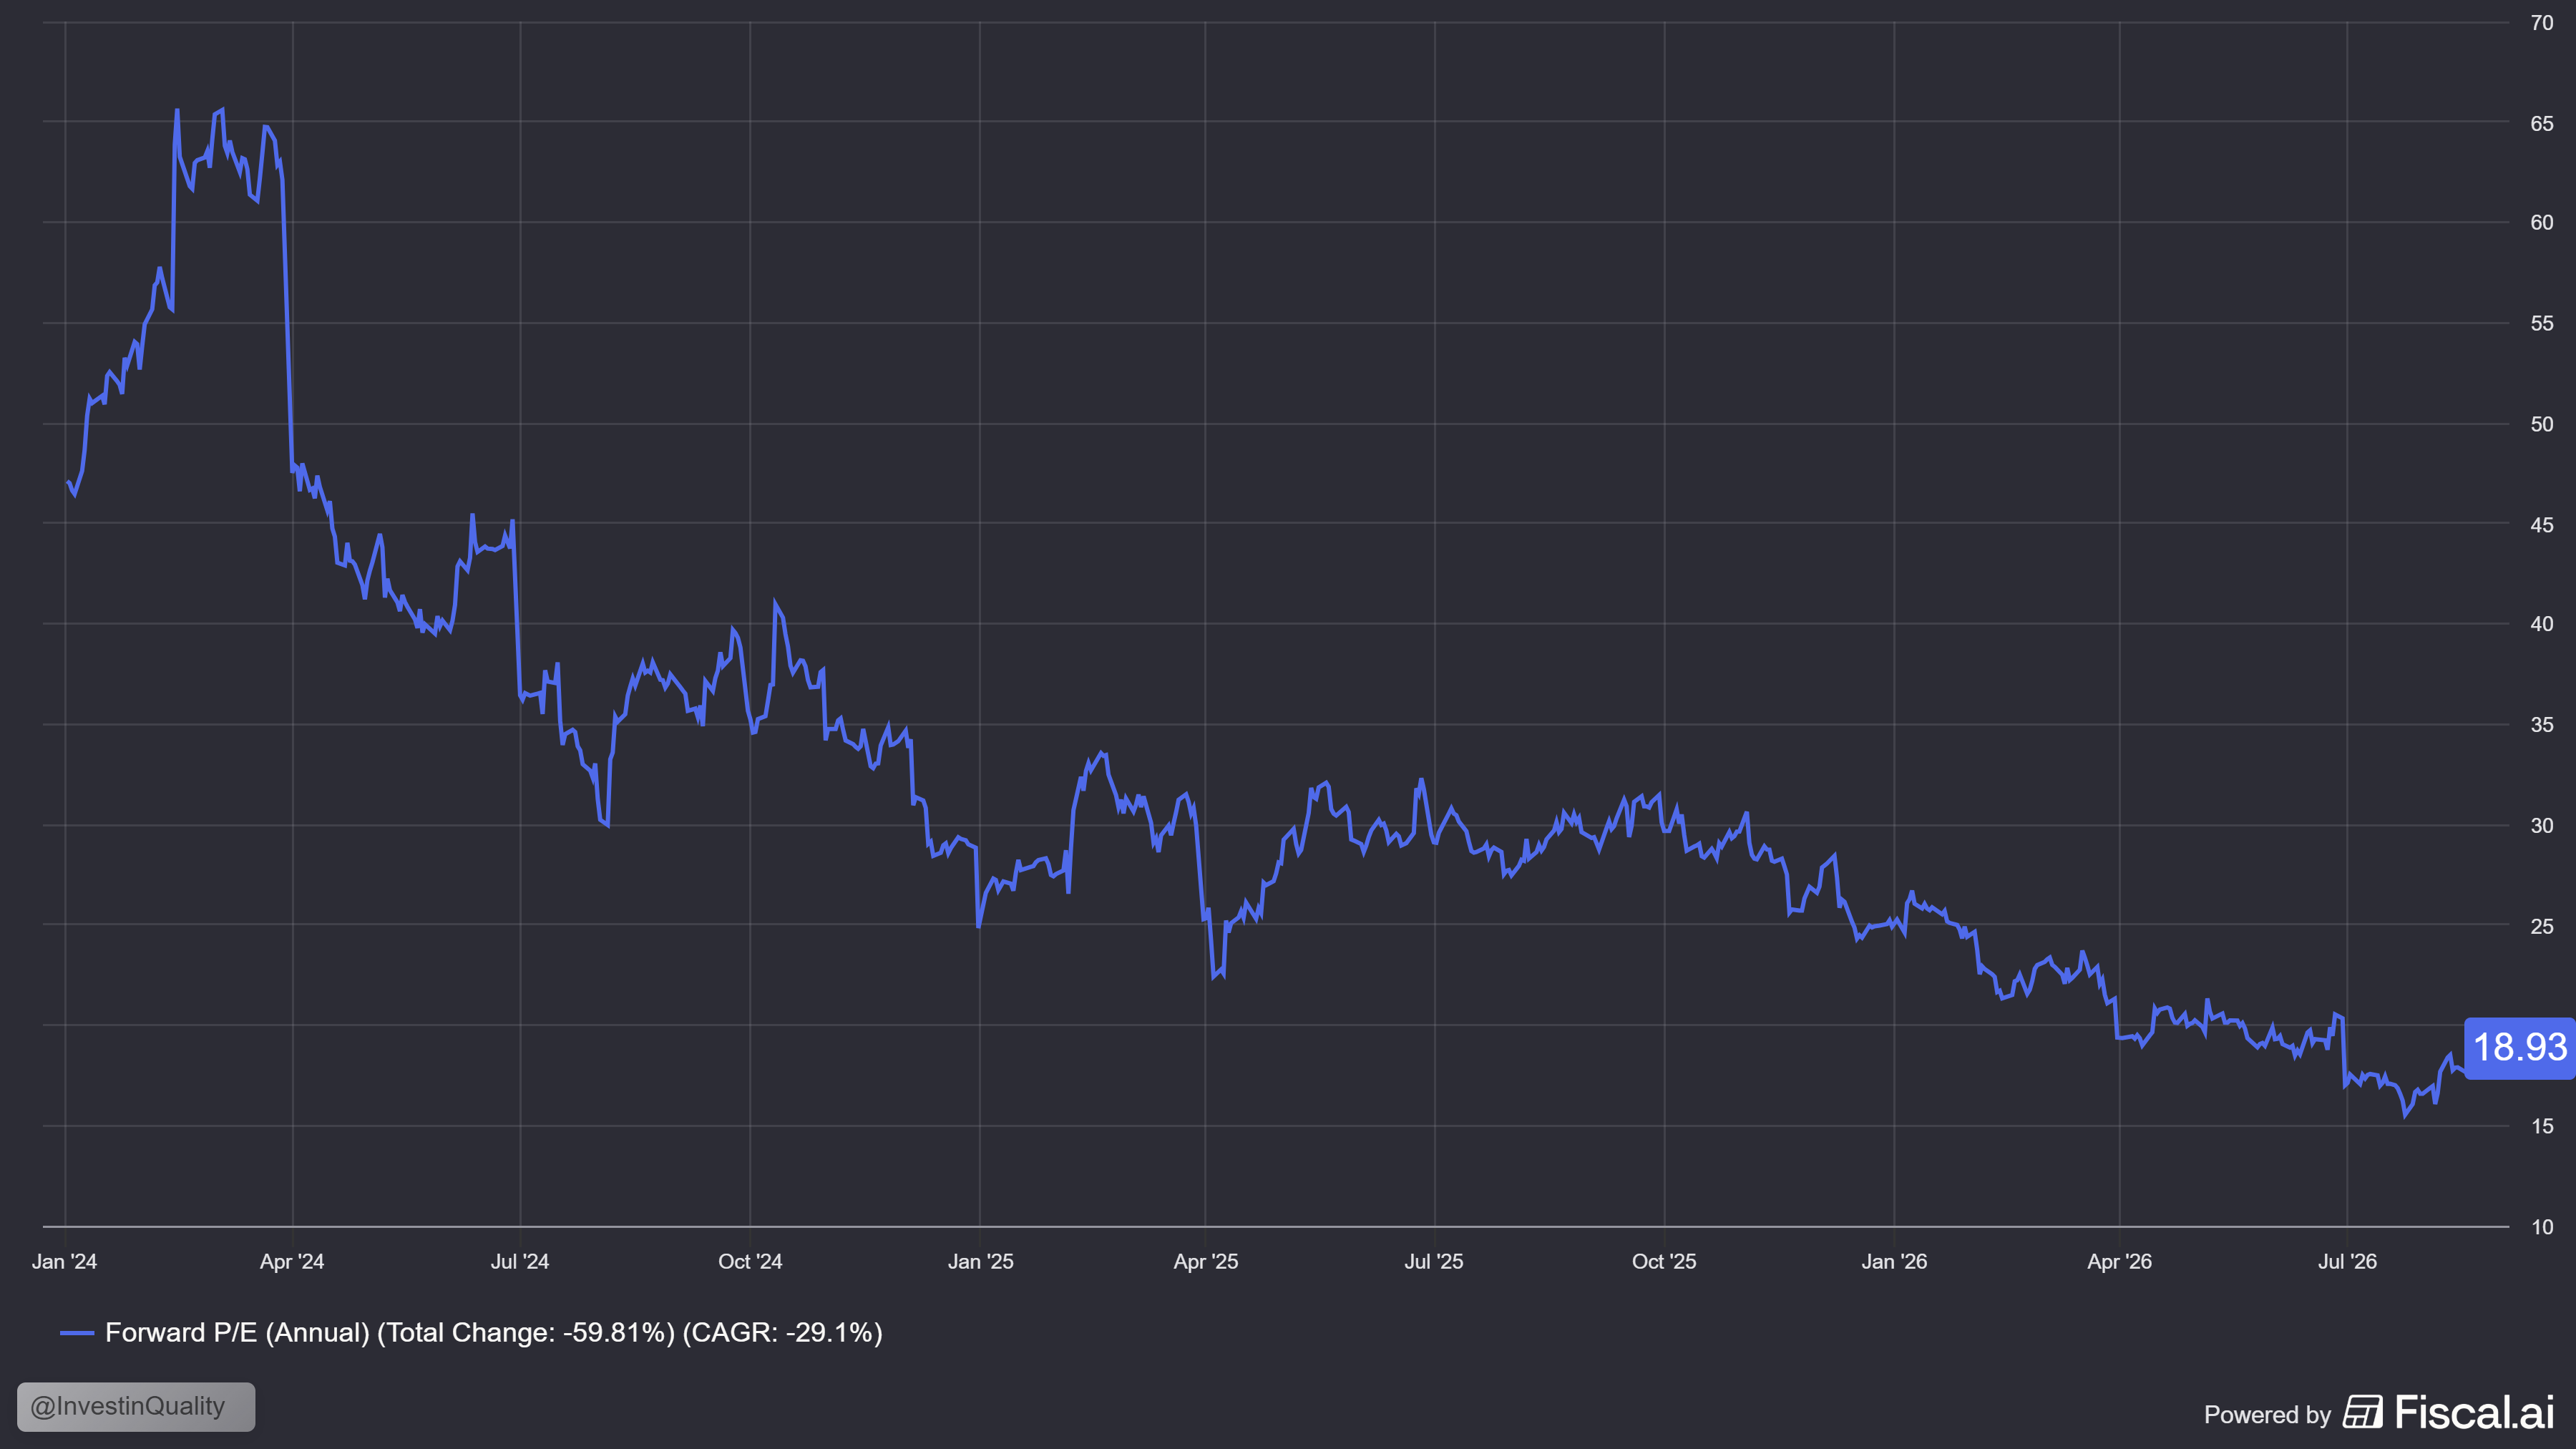
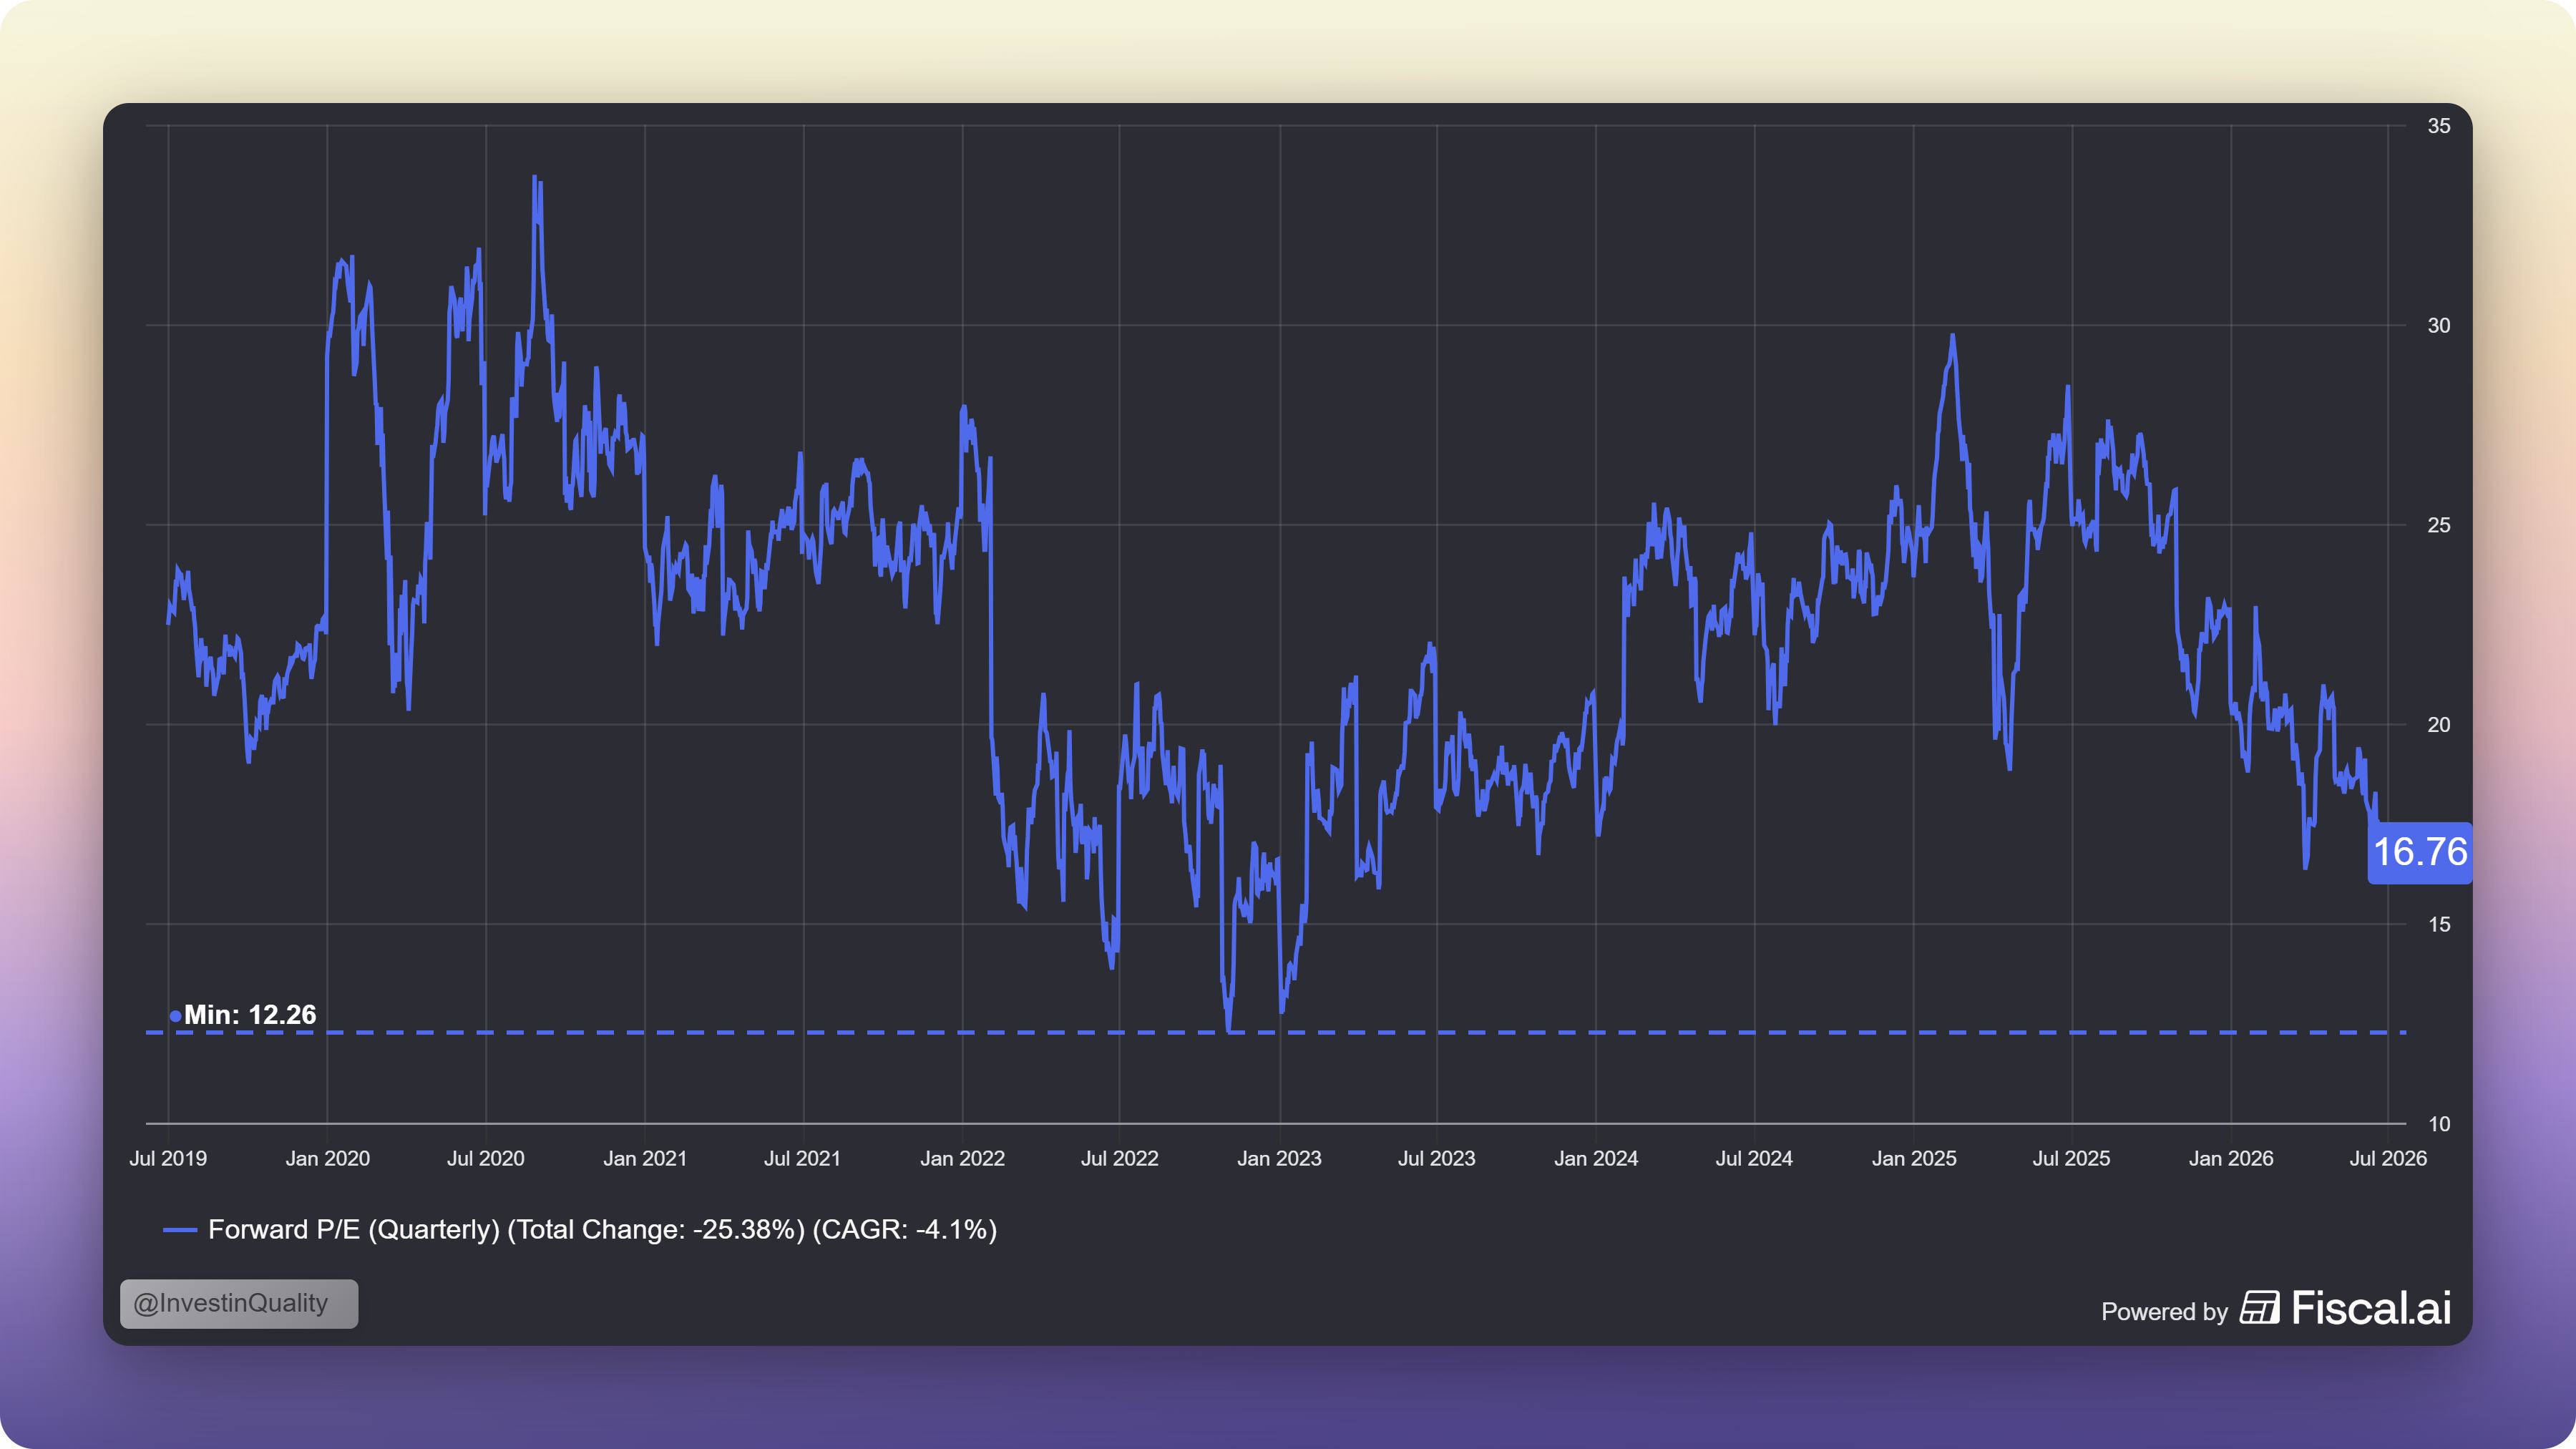
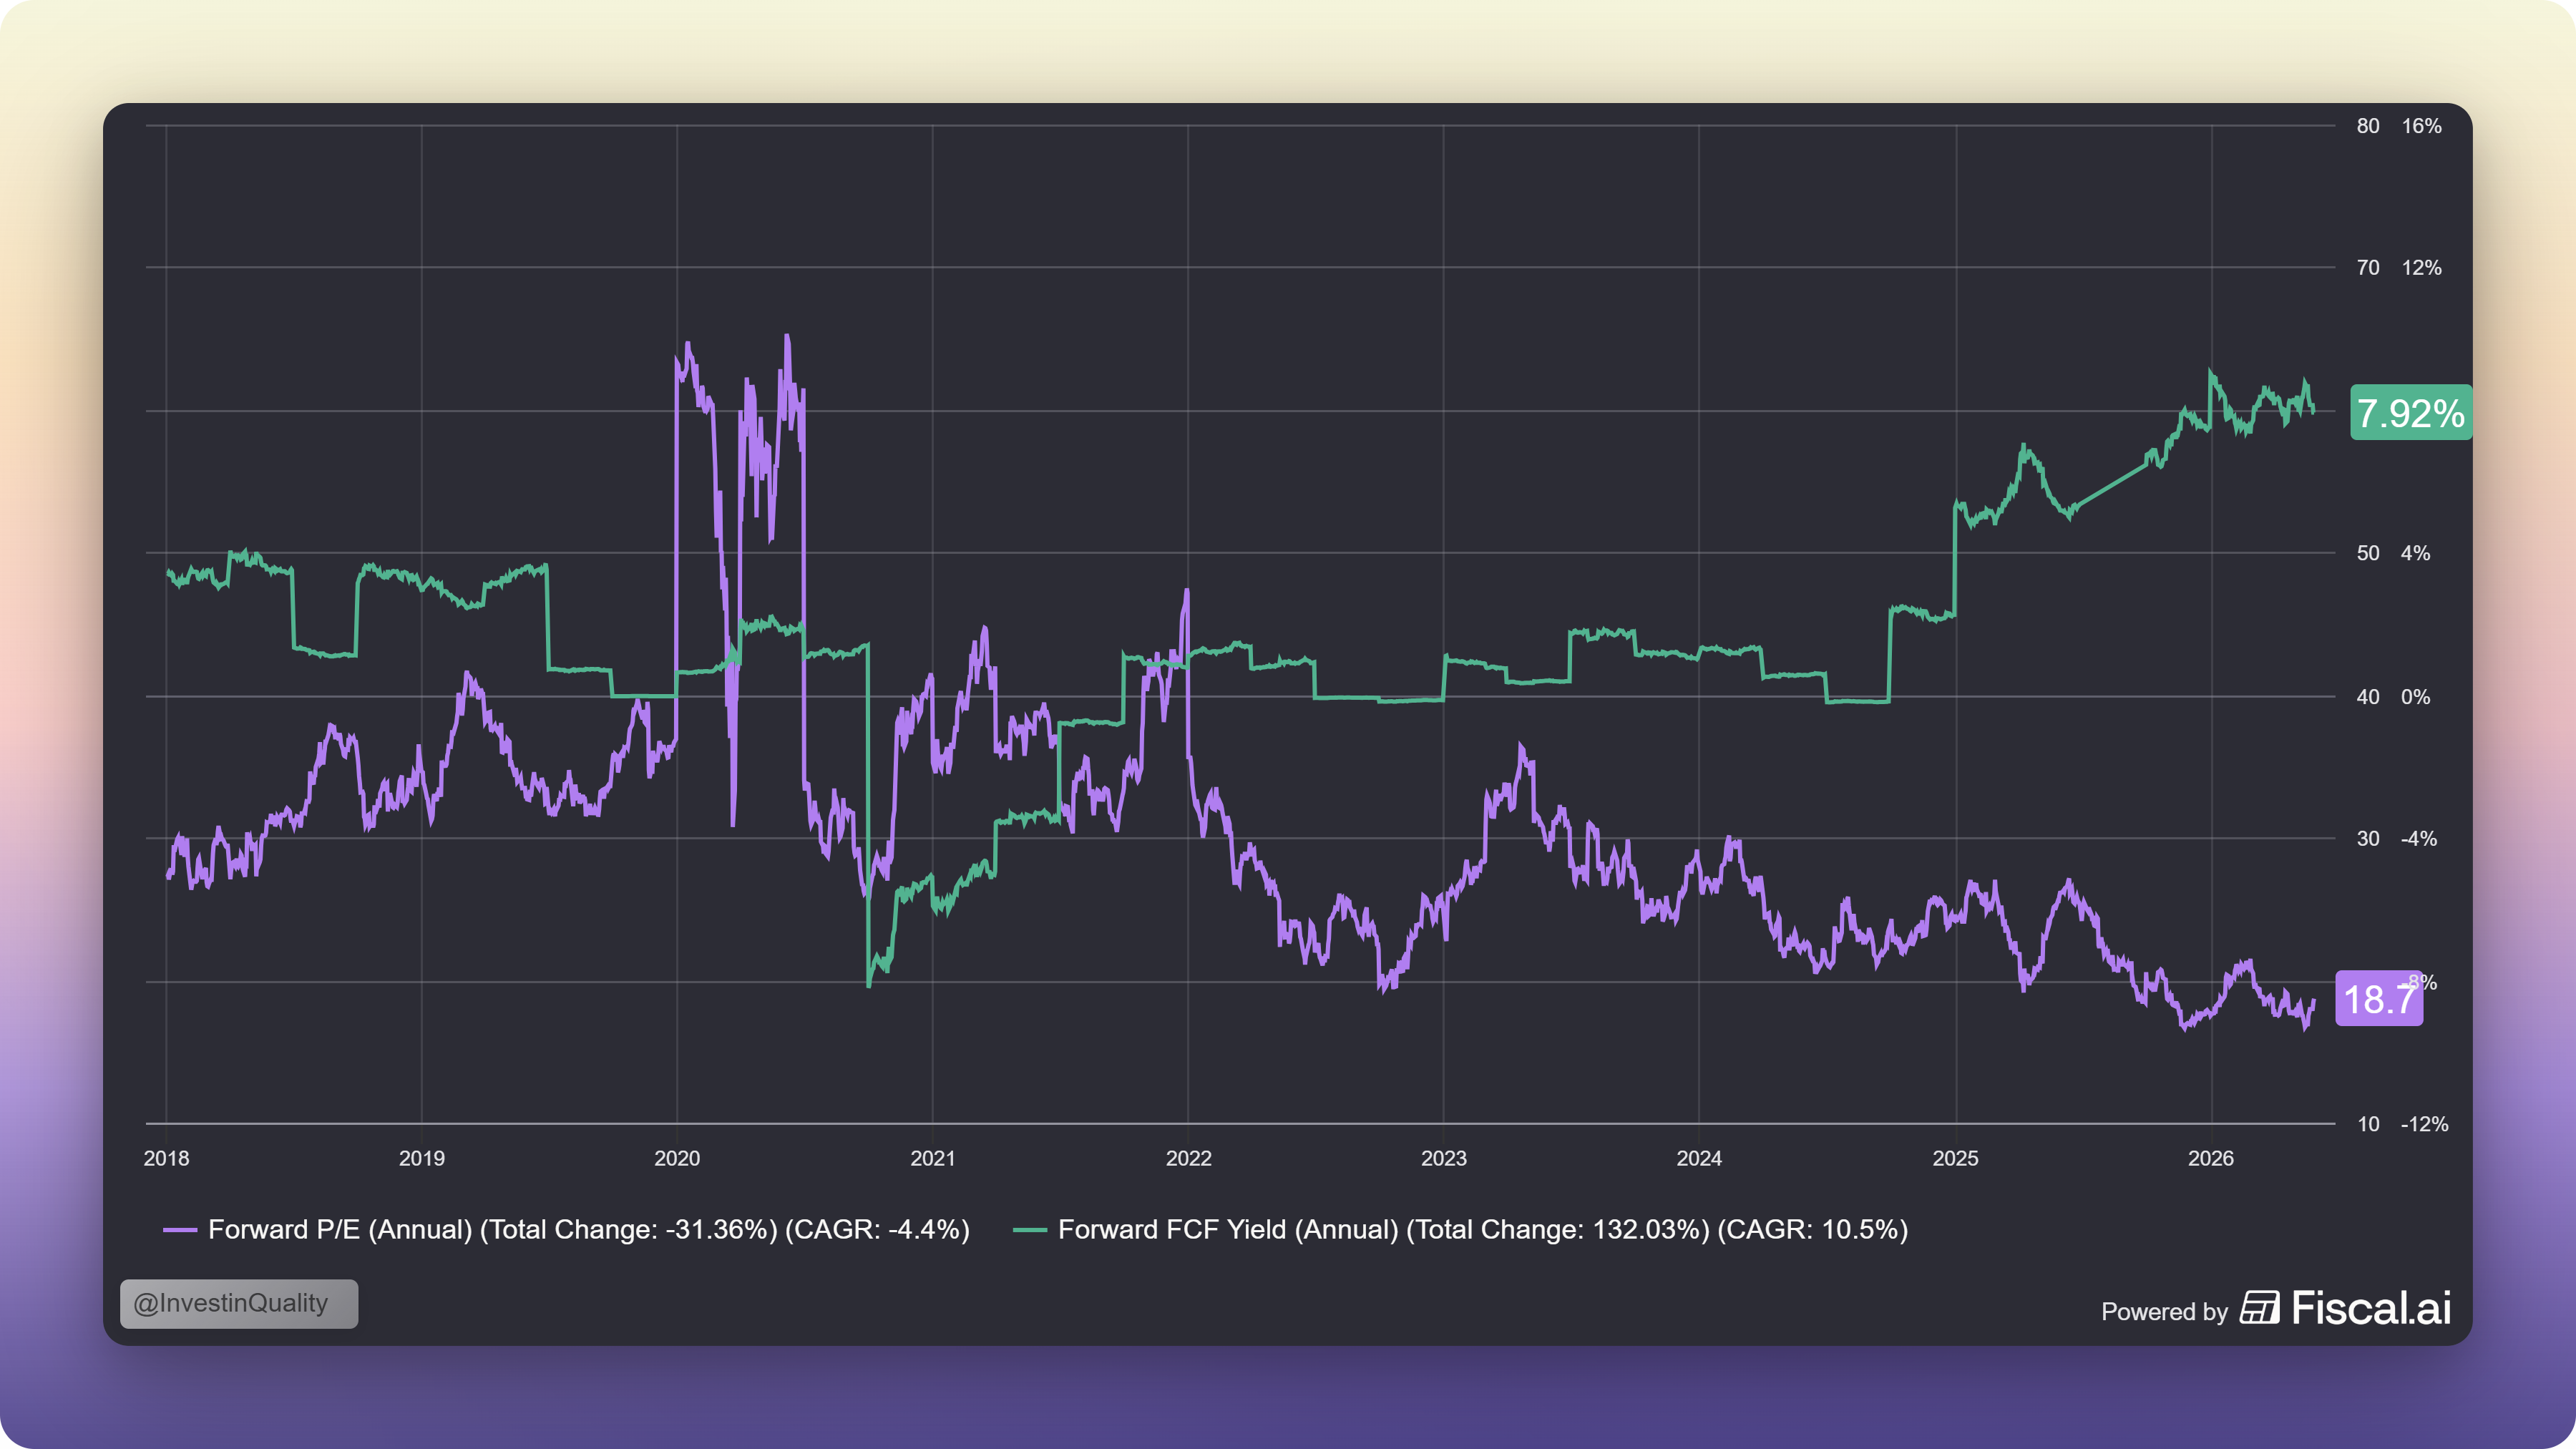
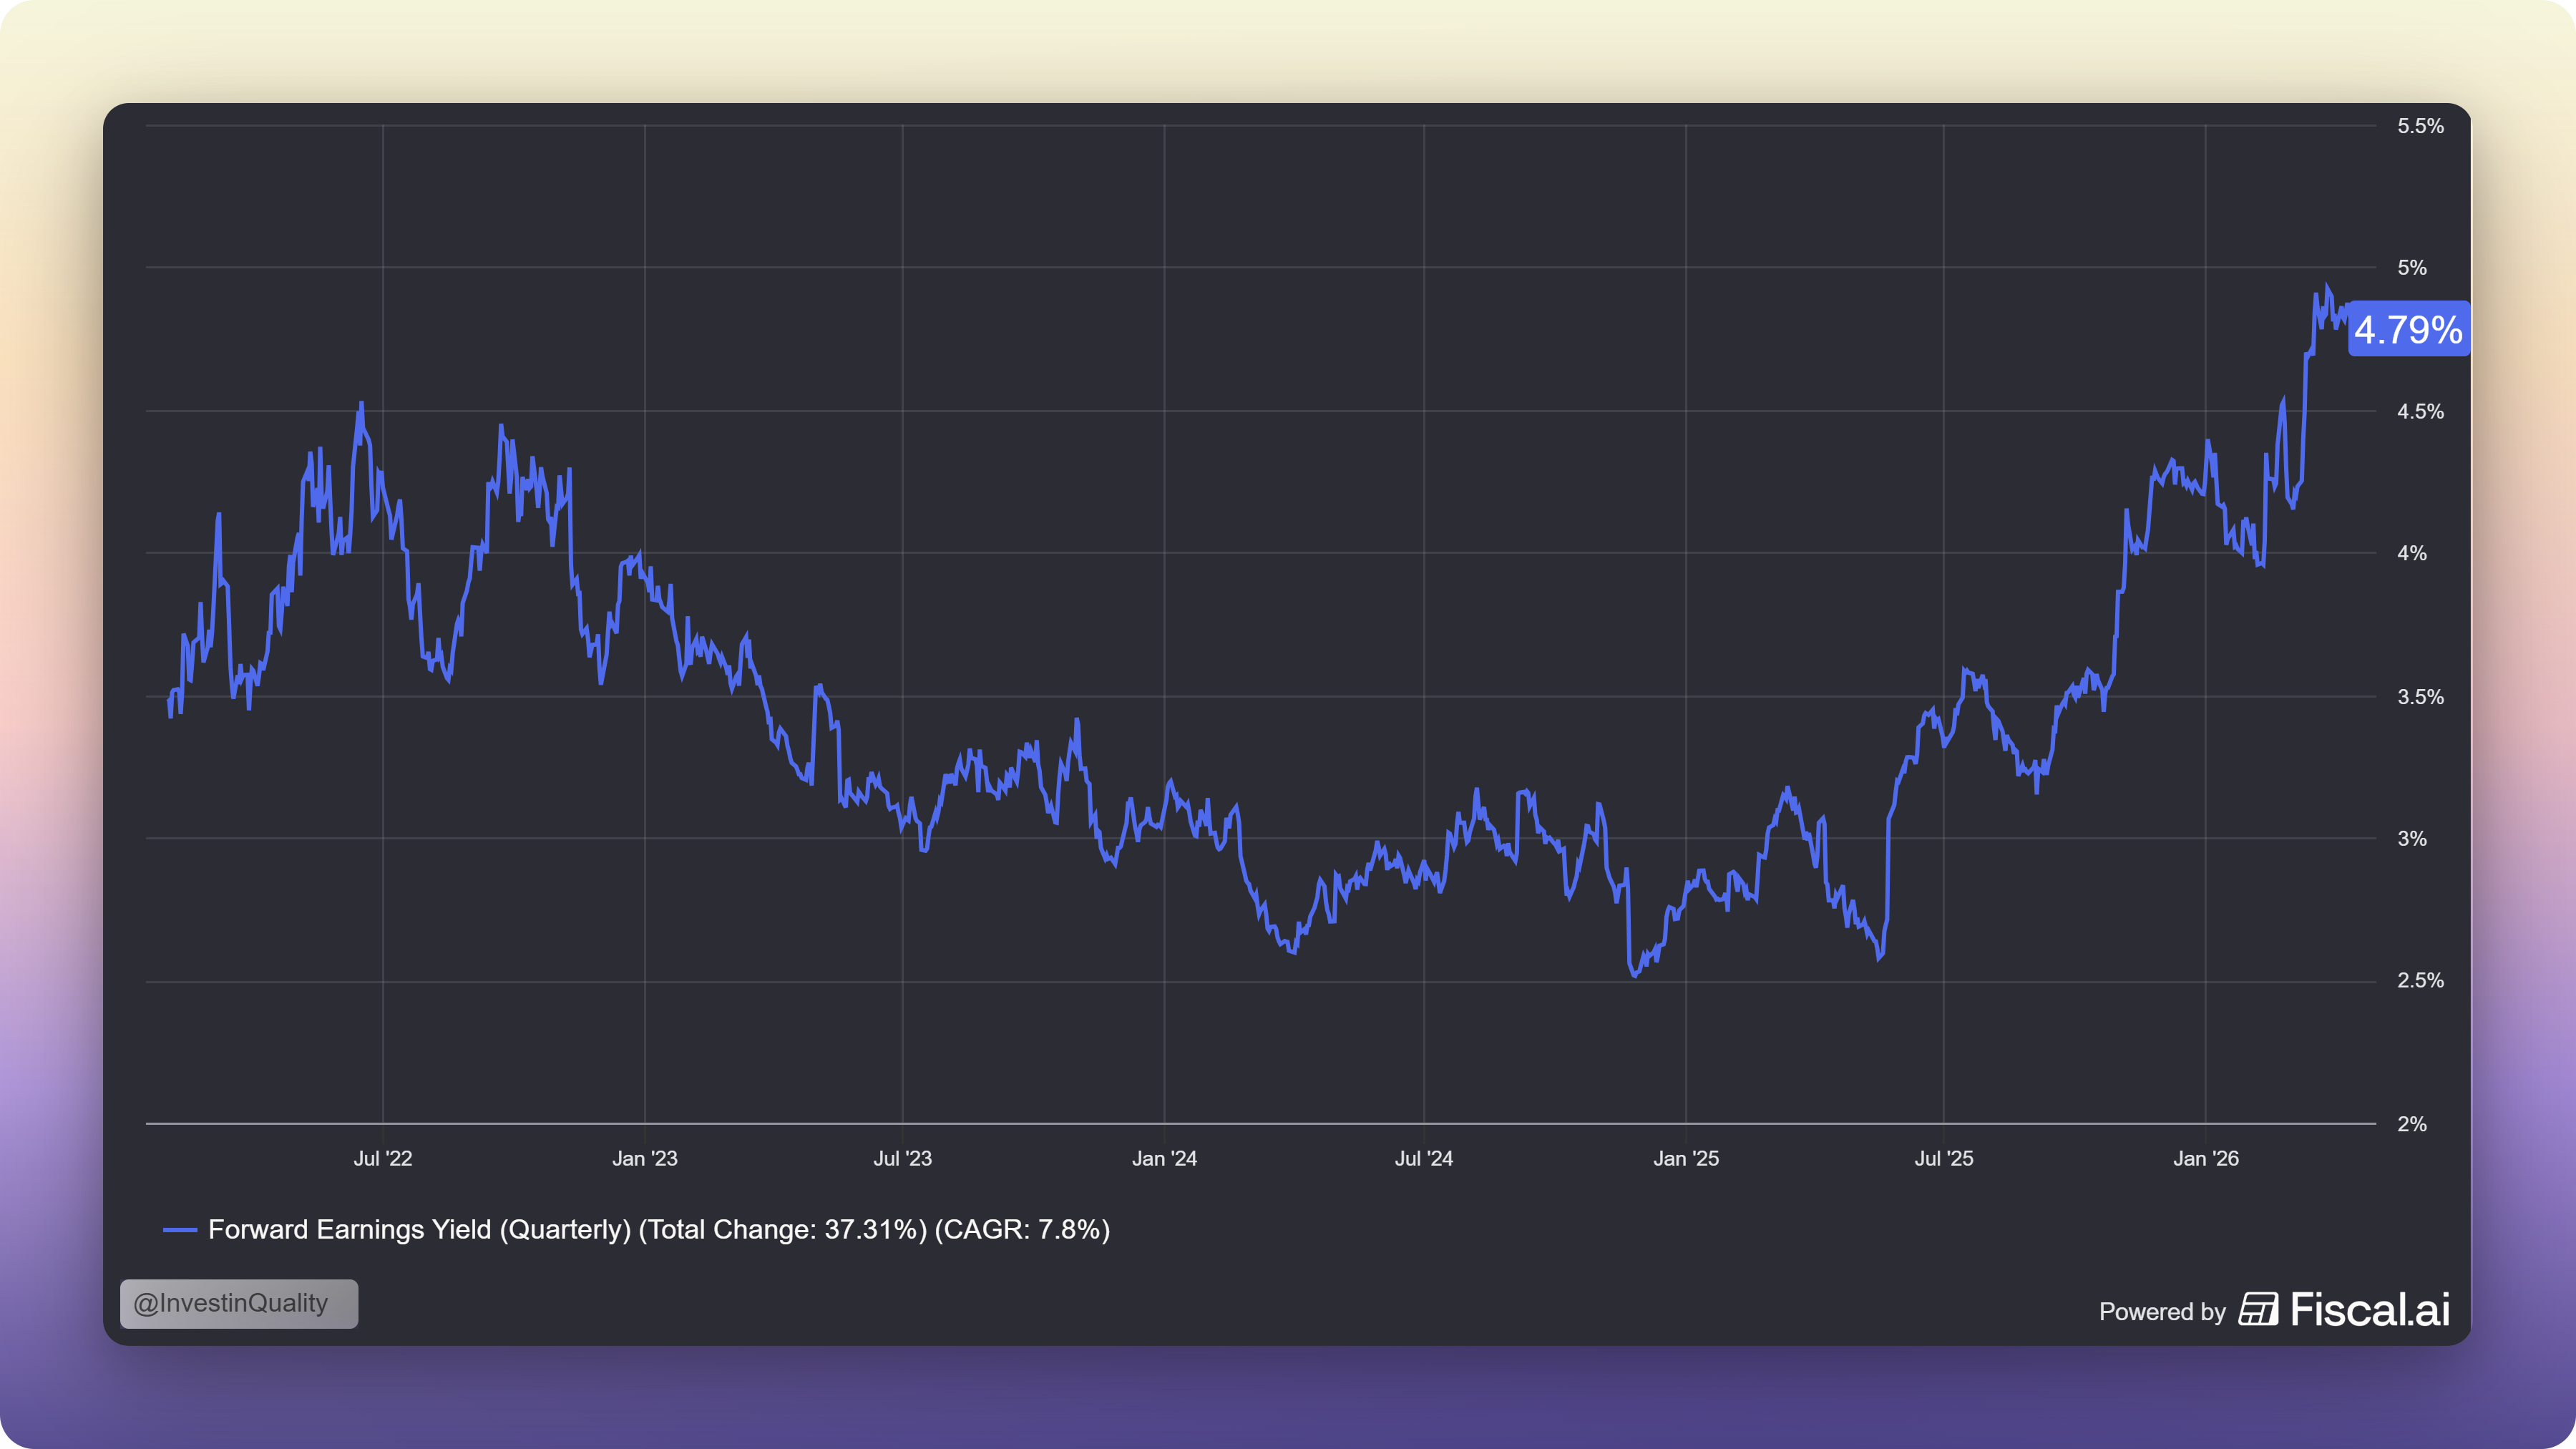
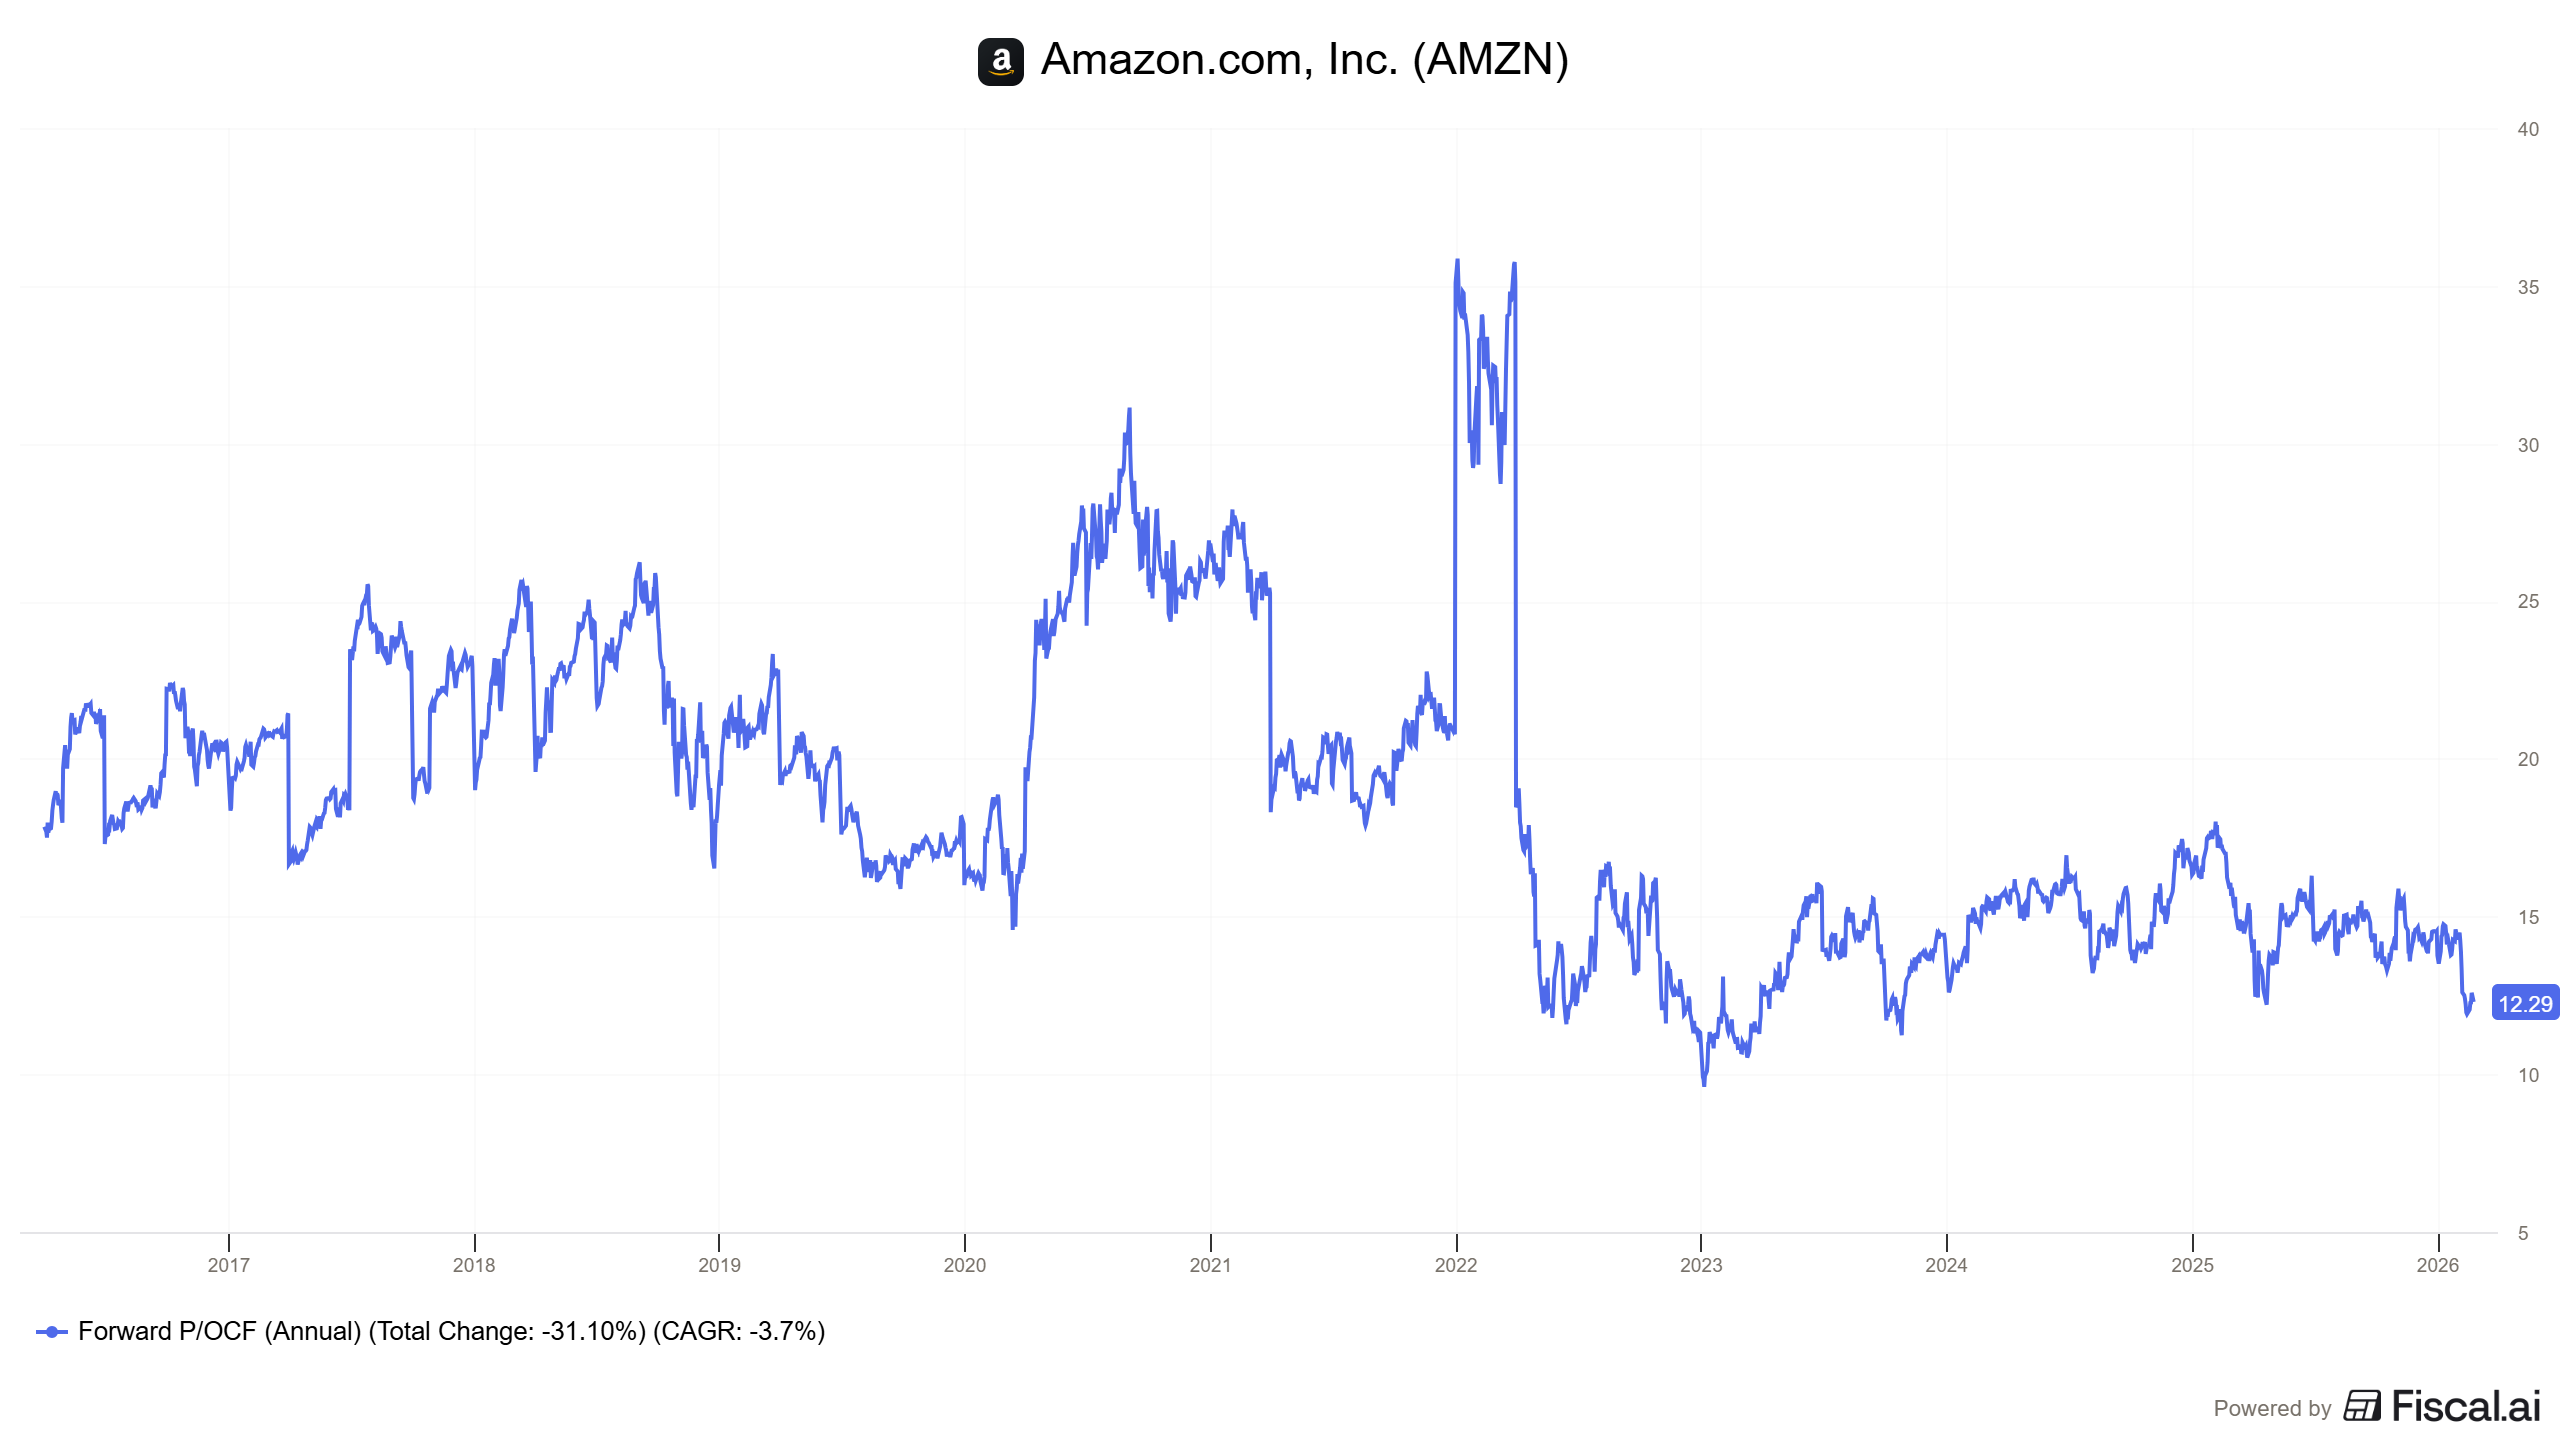
Forward PE is at 18.93x, the lowest in its history:


Nu Holdings 💳

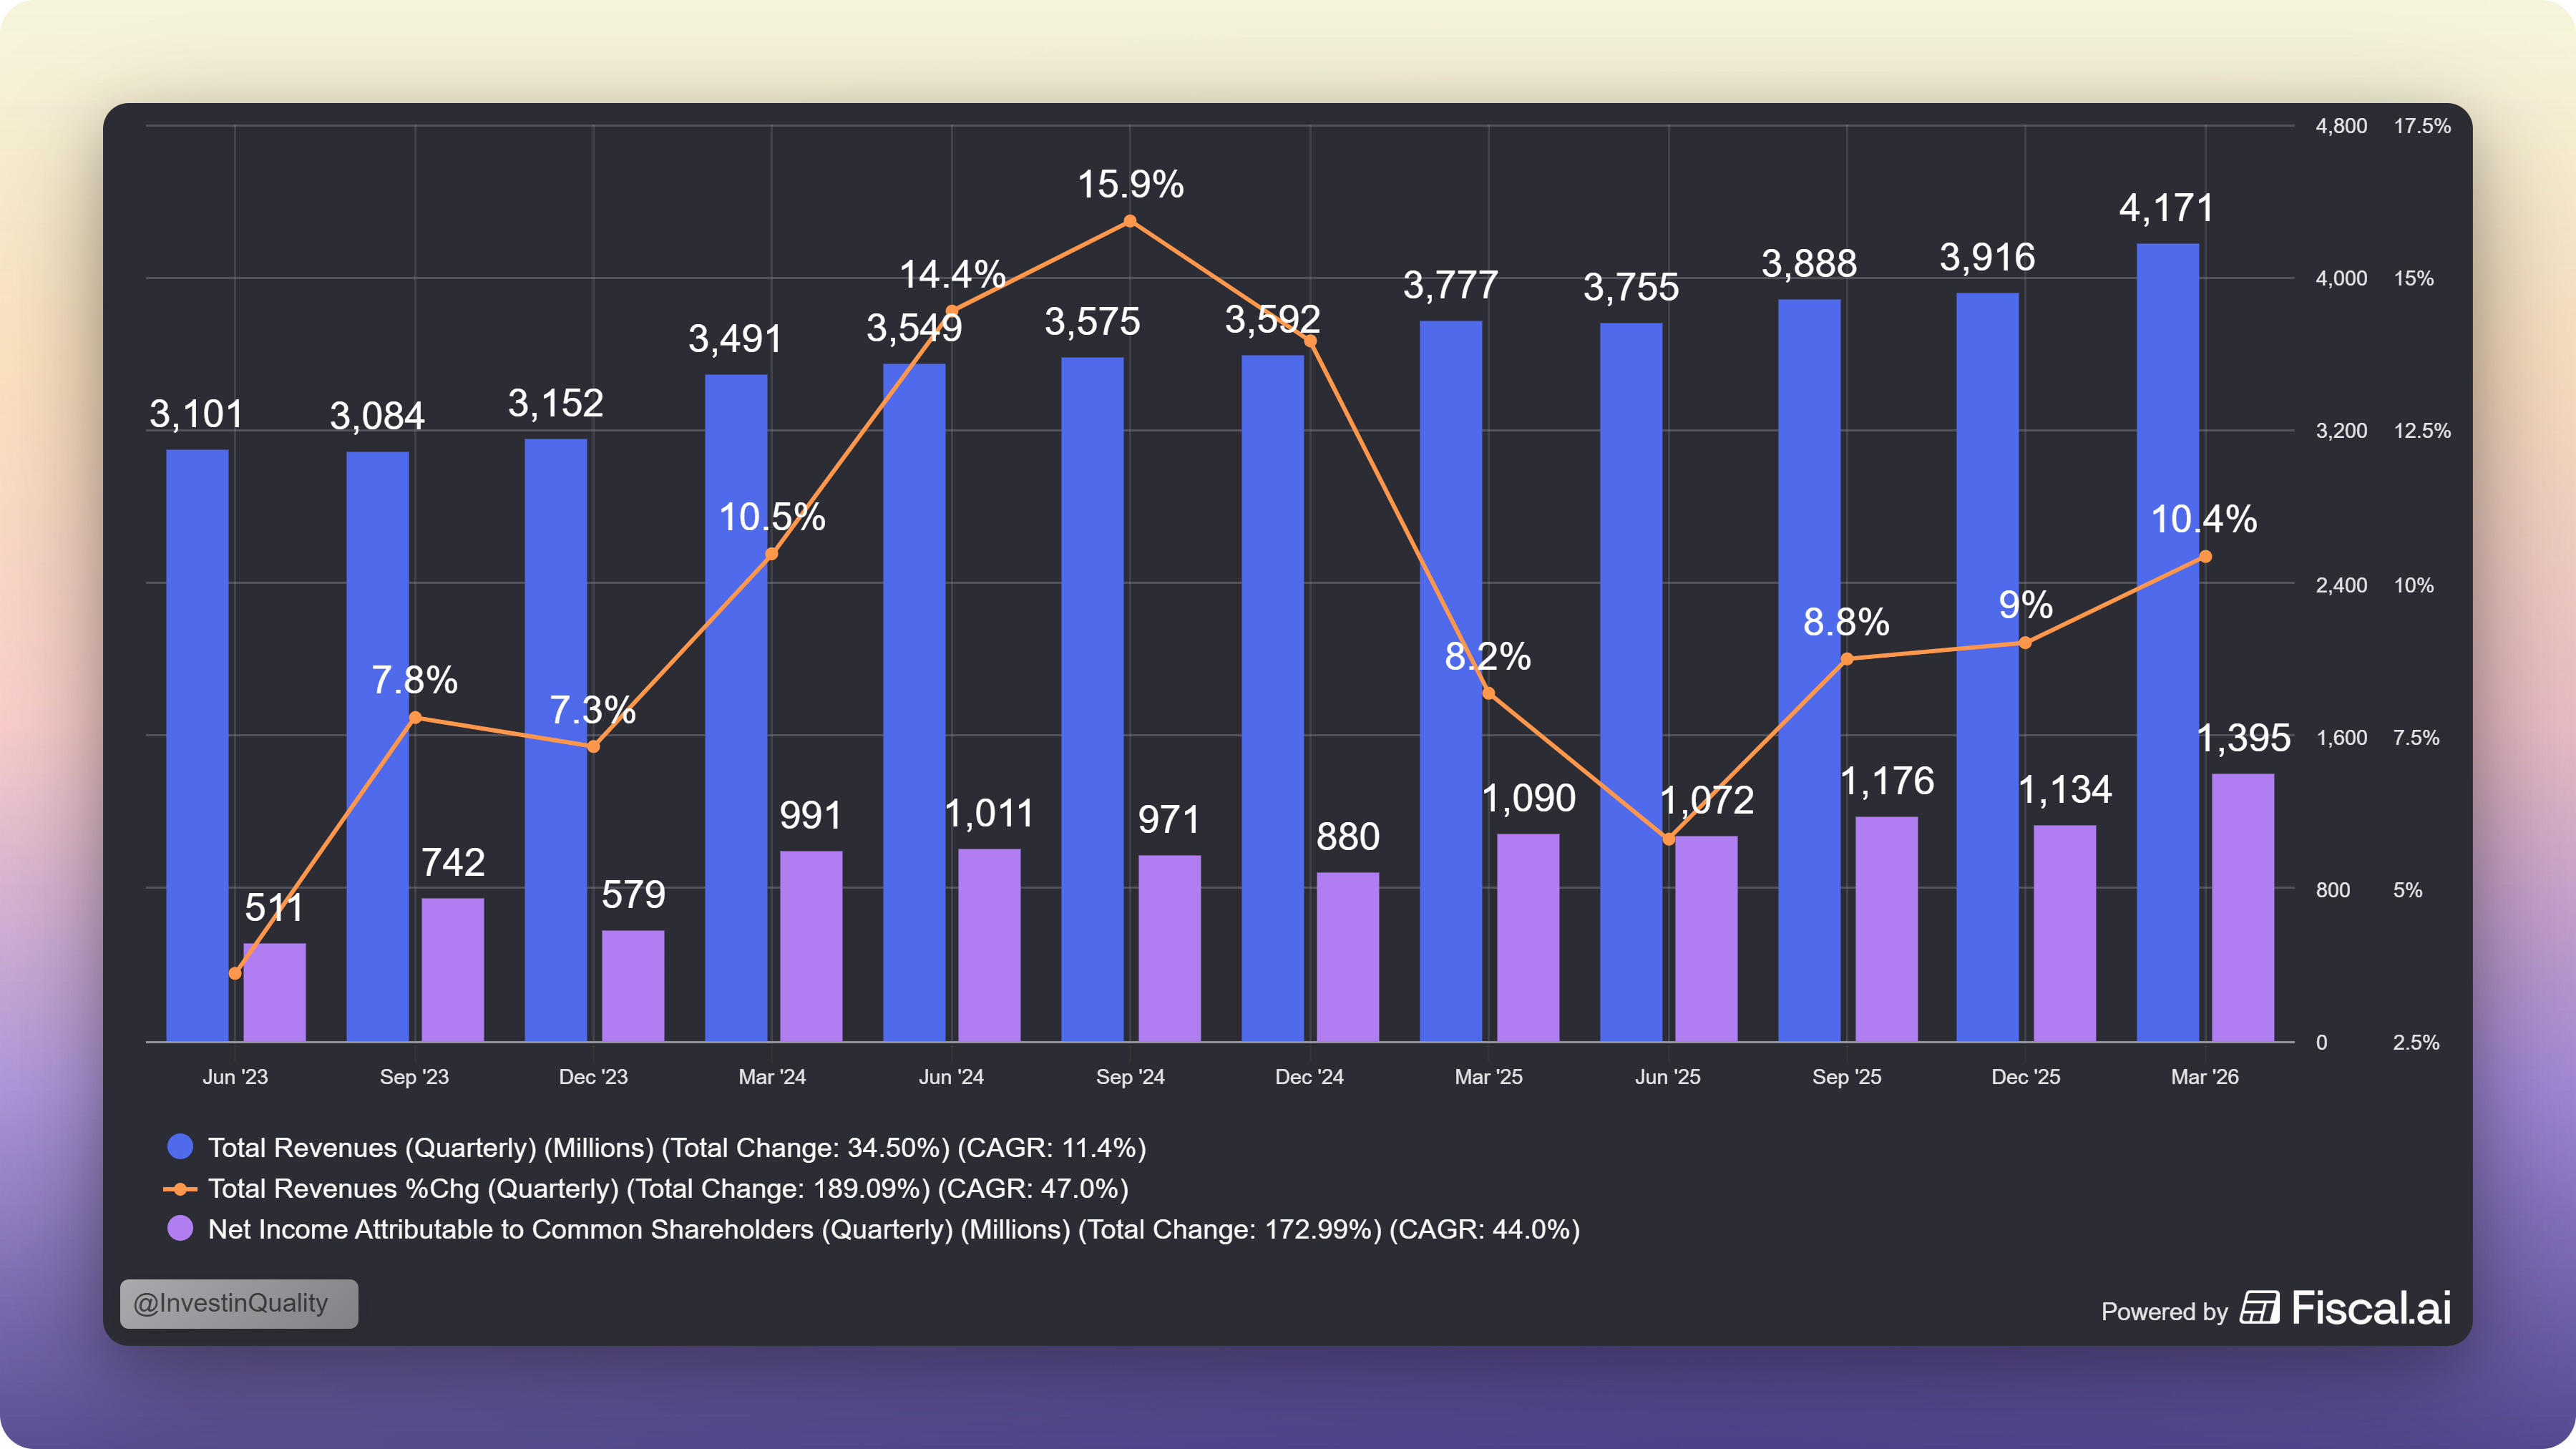
Nu Holdings just crossed $1 billion in quarterly net income for the first time in its history. The stock is still down -19.4% from where it traded in January.

The Business Model

Nu is Latin America’s largest digital bank.

No branches, built entirely on technology, serving a region traditional banks have underserved for decades.

It now has well over 135 million customers, mostly in Brazil, and is scaling aggressively into Mexico and Colombia.

Low-cost, transparent, digital-first financial services, sold to a market that was starved for exactly that. It’s the same playbook that made MercadoLibre work in e-commerce, applied to banking.

Nu holdings own equation makes this company interesting:

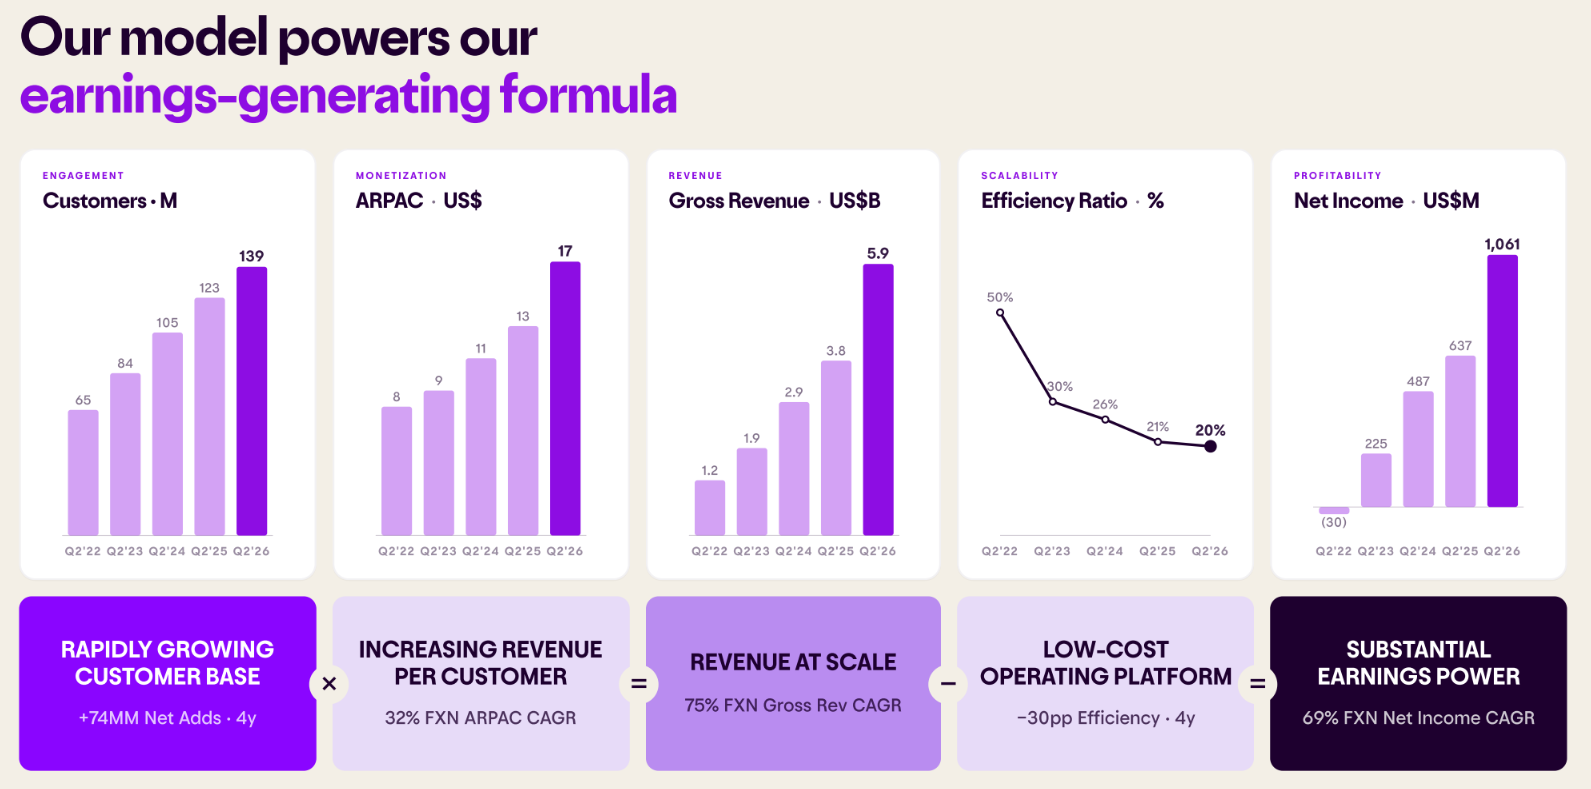
Rapidly growing customer base (+74M in 4 years) x Increasing revenue per customer (+32% CAGR) = Revenue at scale (75% gross revenue CAGR) - Low-cost operating platform = Substantial earnings power (69% Net income CAGR)

What Changed?

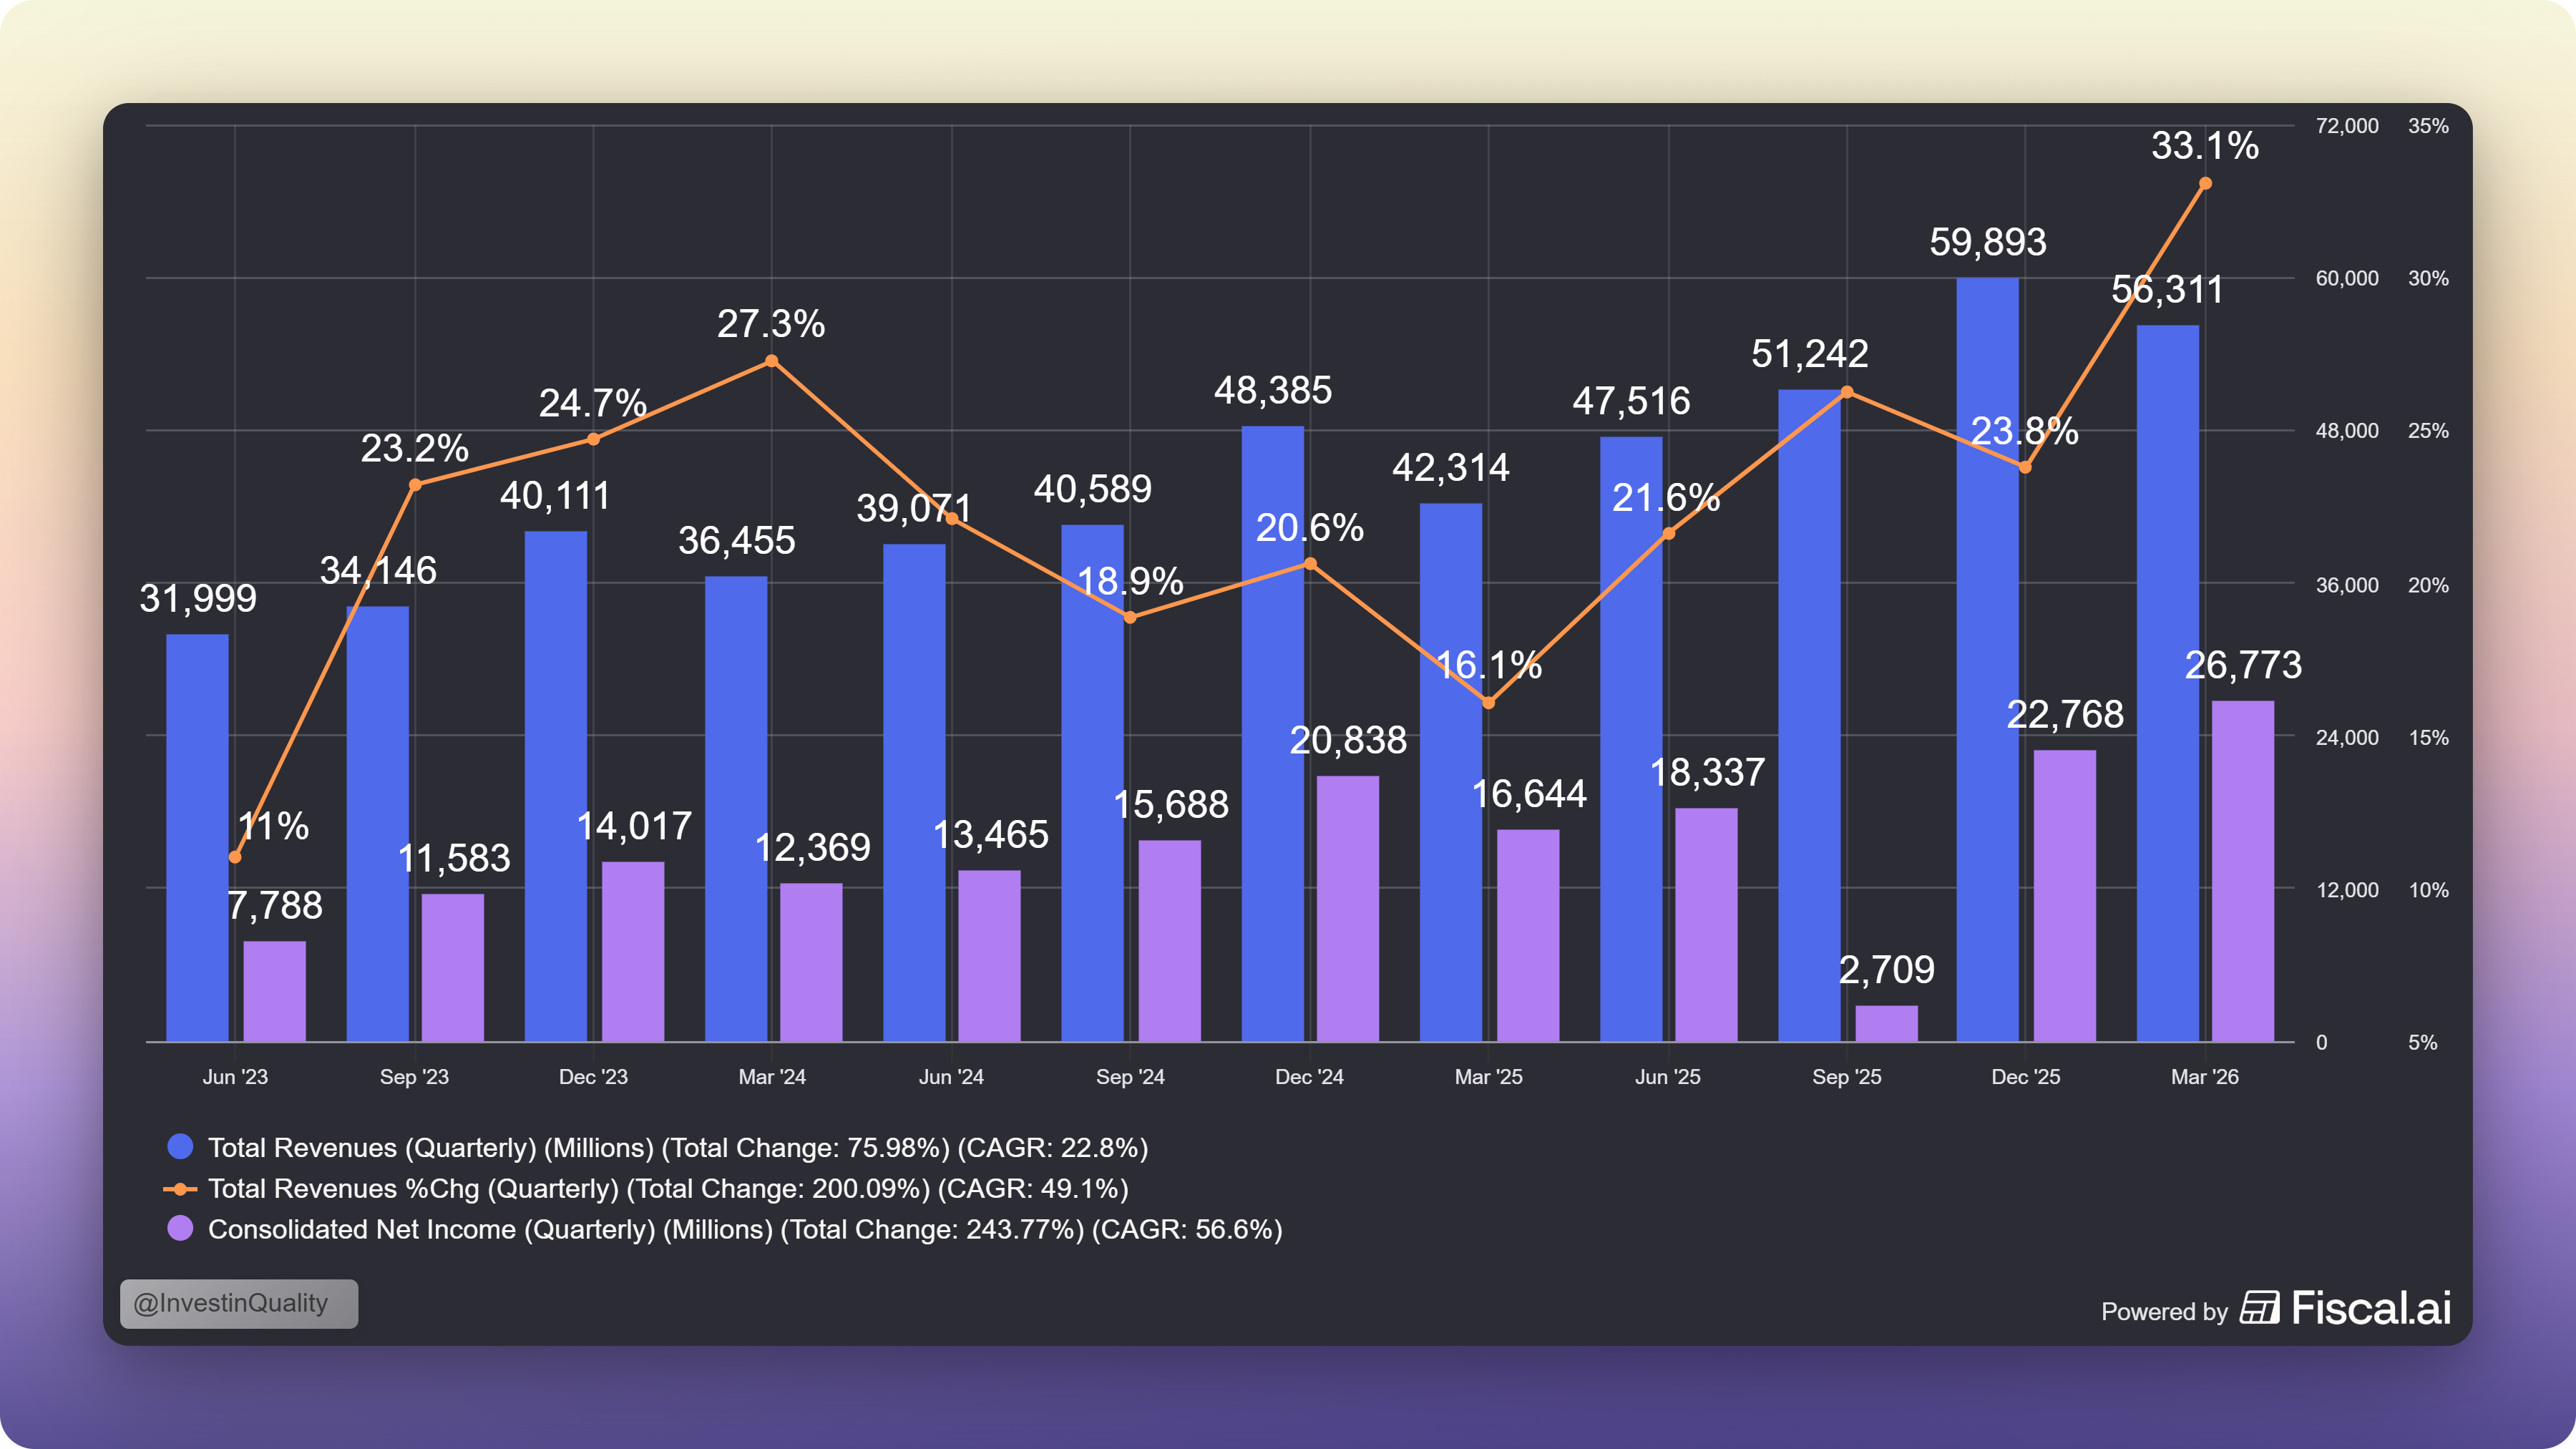
Q2 2026 was a record quarter across the board. Revenue came in around $5.9 billion, up 39% year over year. Net income landed north of $1 billion, up from $637 million a year earlier. Return on equity hit 33%, a figure most global banks only could dream of, let alone a 13-year-old fintech.

Nu just secured a full banking license in Mexico, where it’s now the largest digital bank with 16 million customers. It picked up a Brazilian banking license via the Banco Porto Real acquisition. It’s rolling its NuFormer AI models into underwriting and service across the business.

So why is the stock still down from its highs?

Earlier this year, shares fell as much as 36% from January’s peak on rising credit-loss provisions and macro deterioration in Brazil. Non-performing loans have climbed to 6.9% of the loan book, the one number that decides whether this turns into a real credit problem or stays a growing pain.

That’s the number to watch.

The Valuation

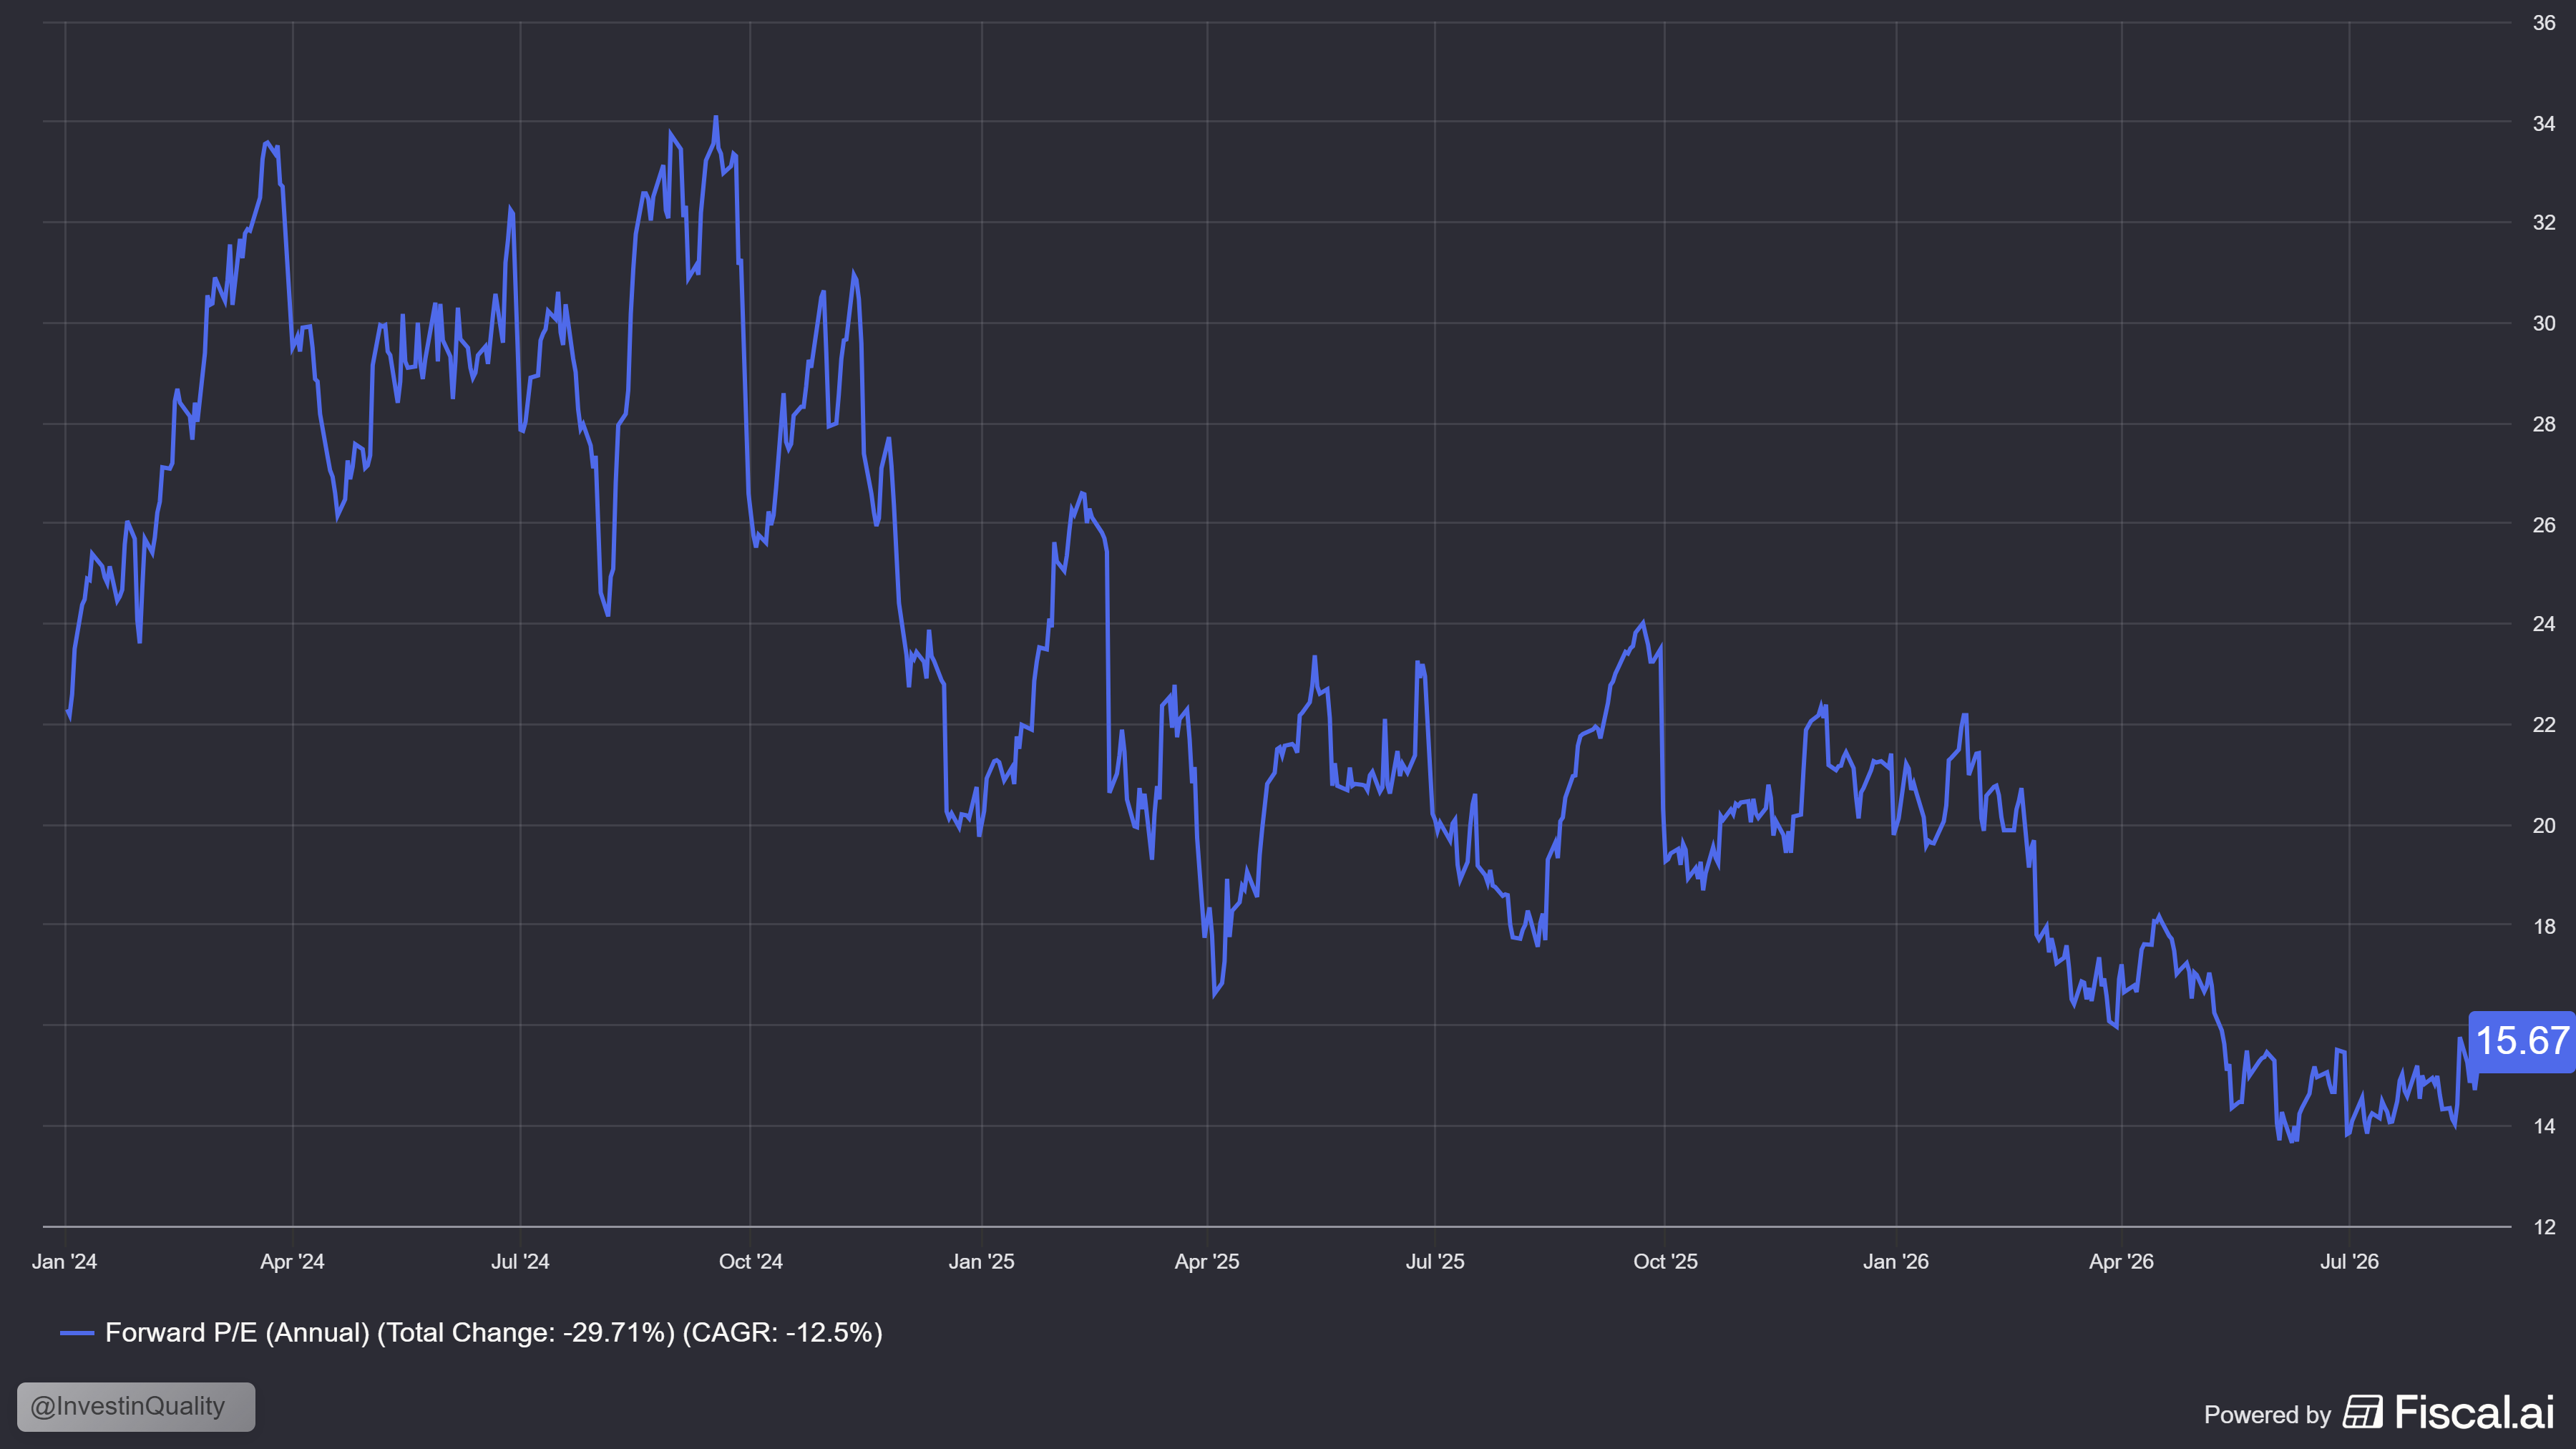
Nu trades at a forward PE of 15.67x, for a business growing earnings around 48% annually, that is a rare combination of growth and valuation. Especially when the business model is proving to be profitable and scalable.

The 8–15% pop the stock put in after this quarter’s print suggests the market is starting to notice. The question now is whether asset quality holds up long enough for the re-rating to finish.

The rest of the article is for Premium subscribers, join today and get:

  • Monthly top 5 buy reports

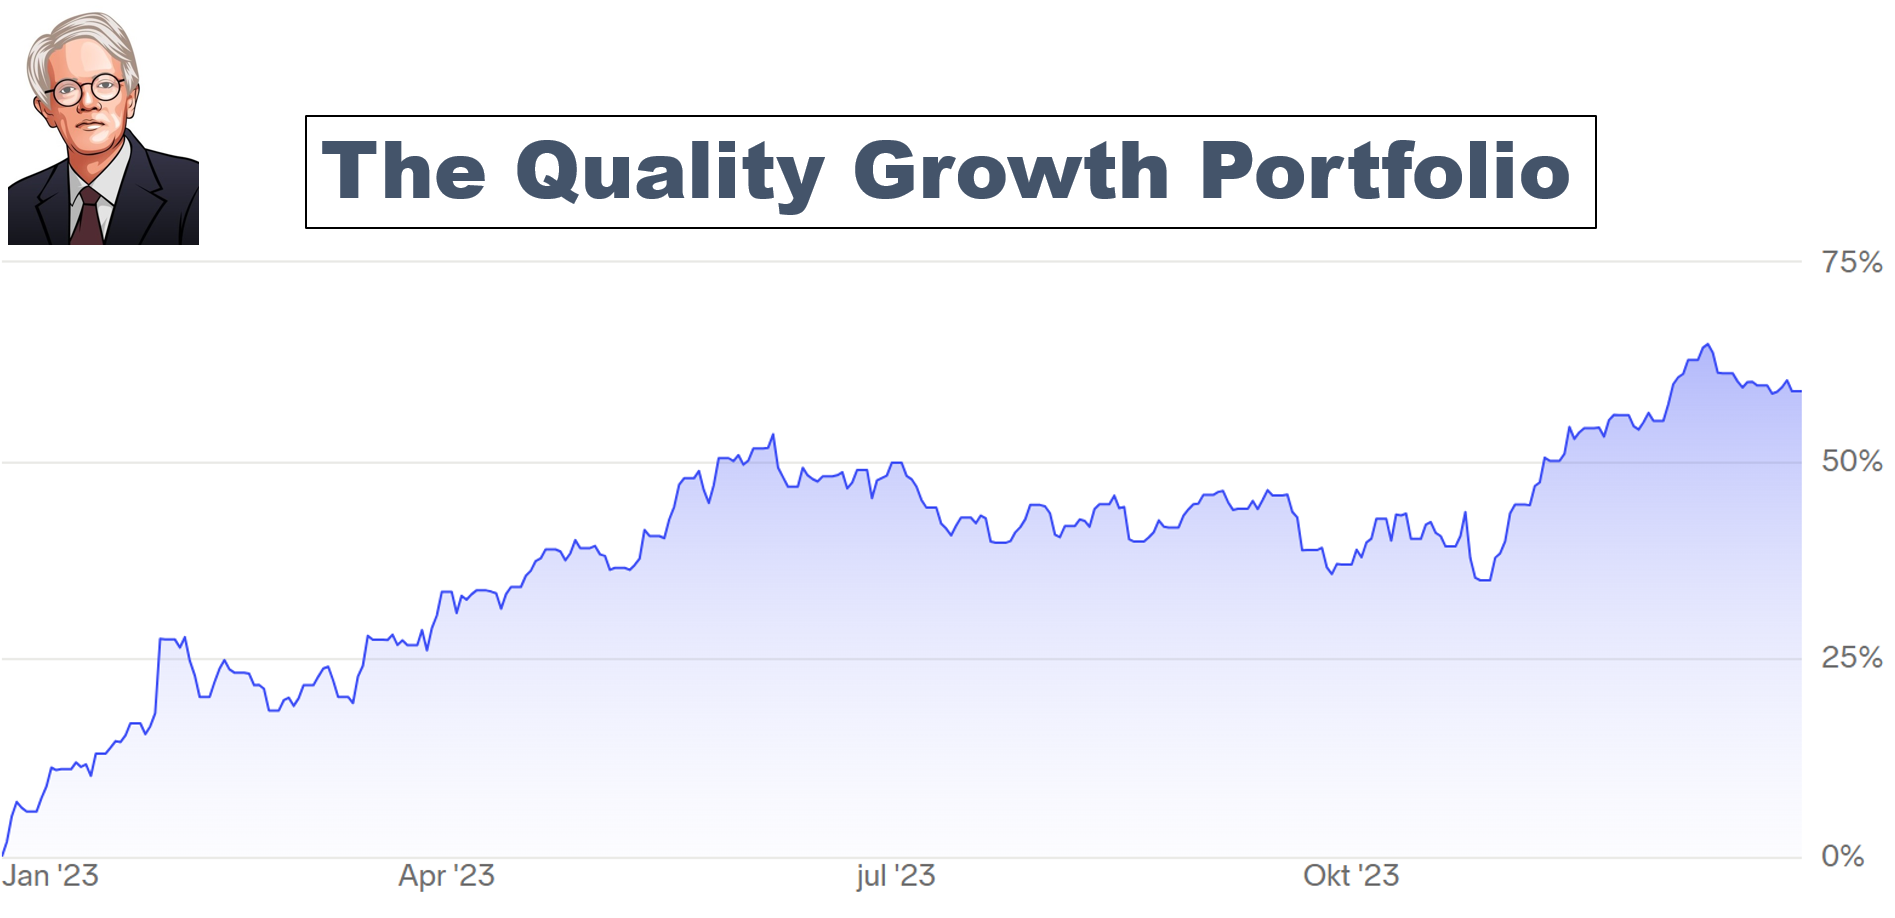
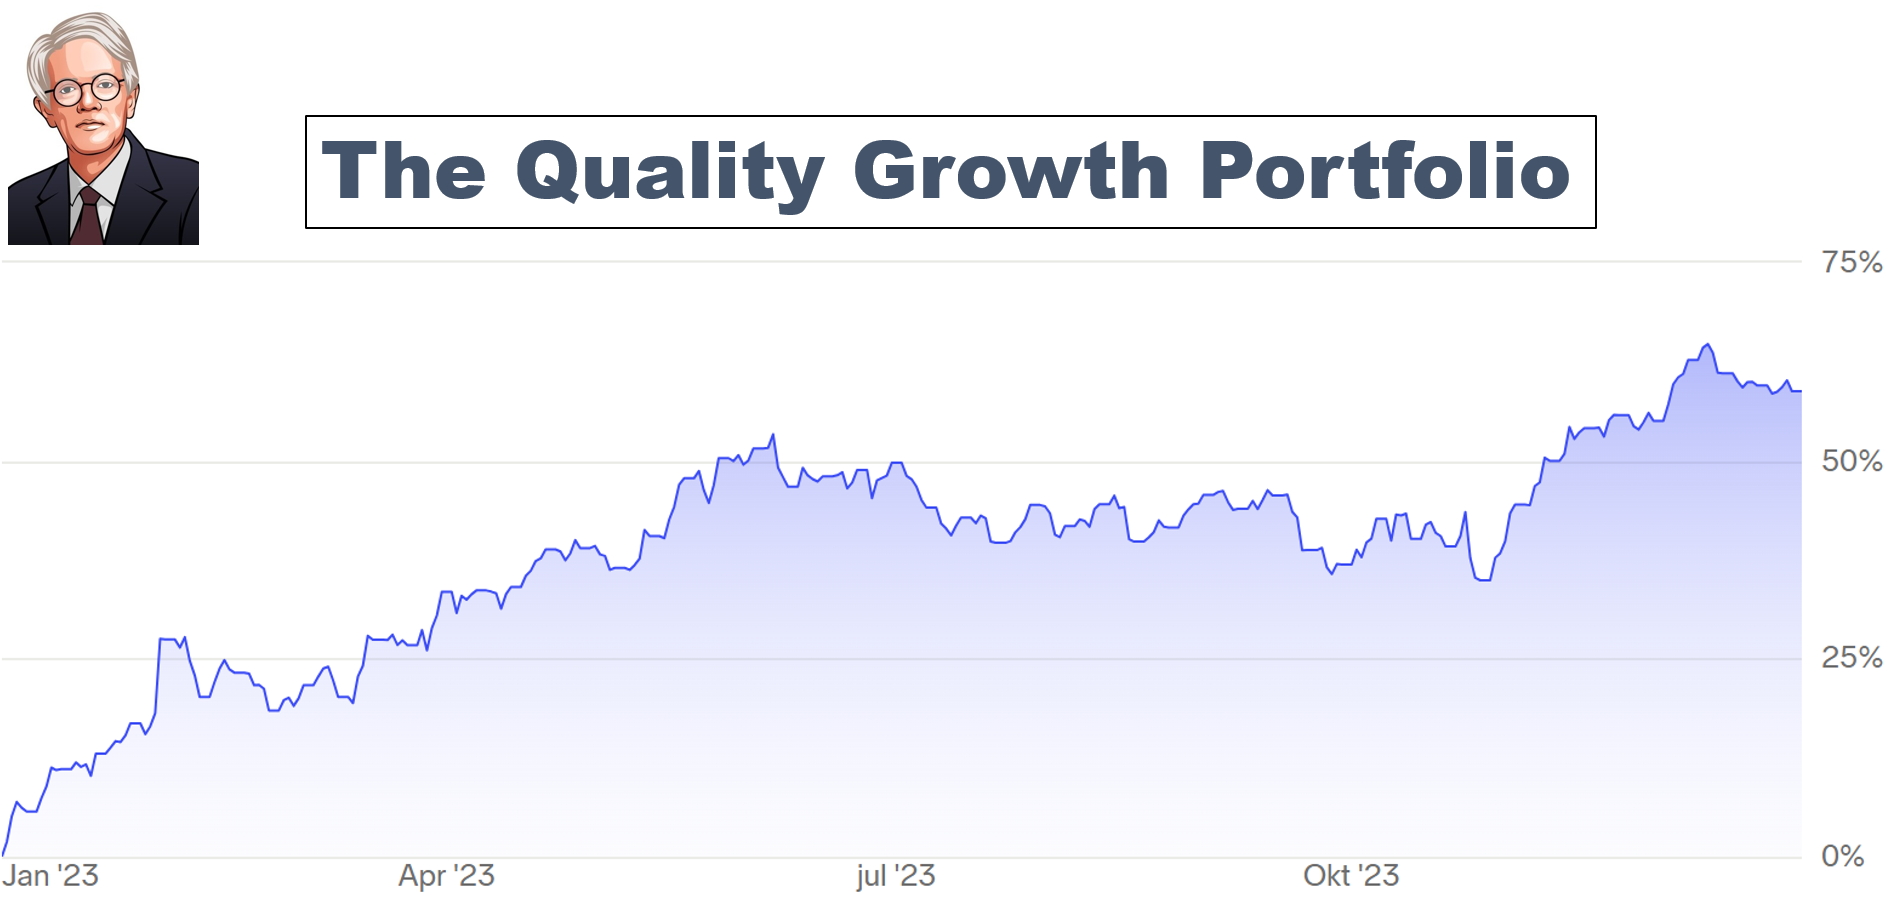
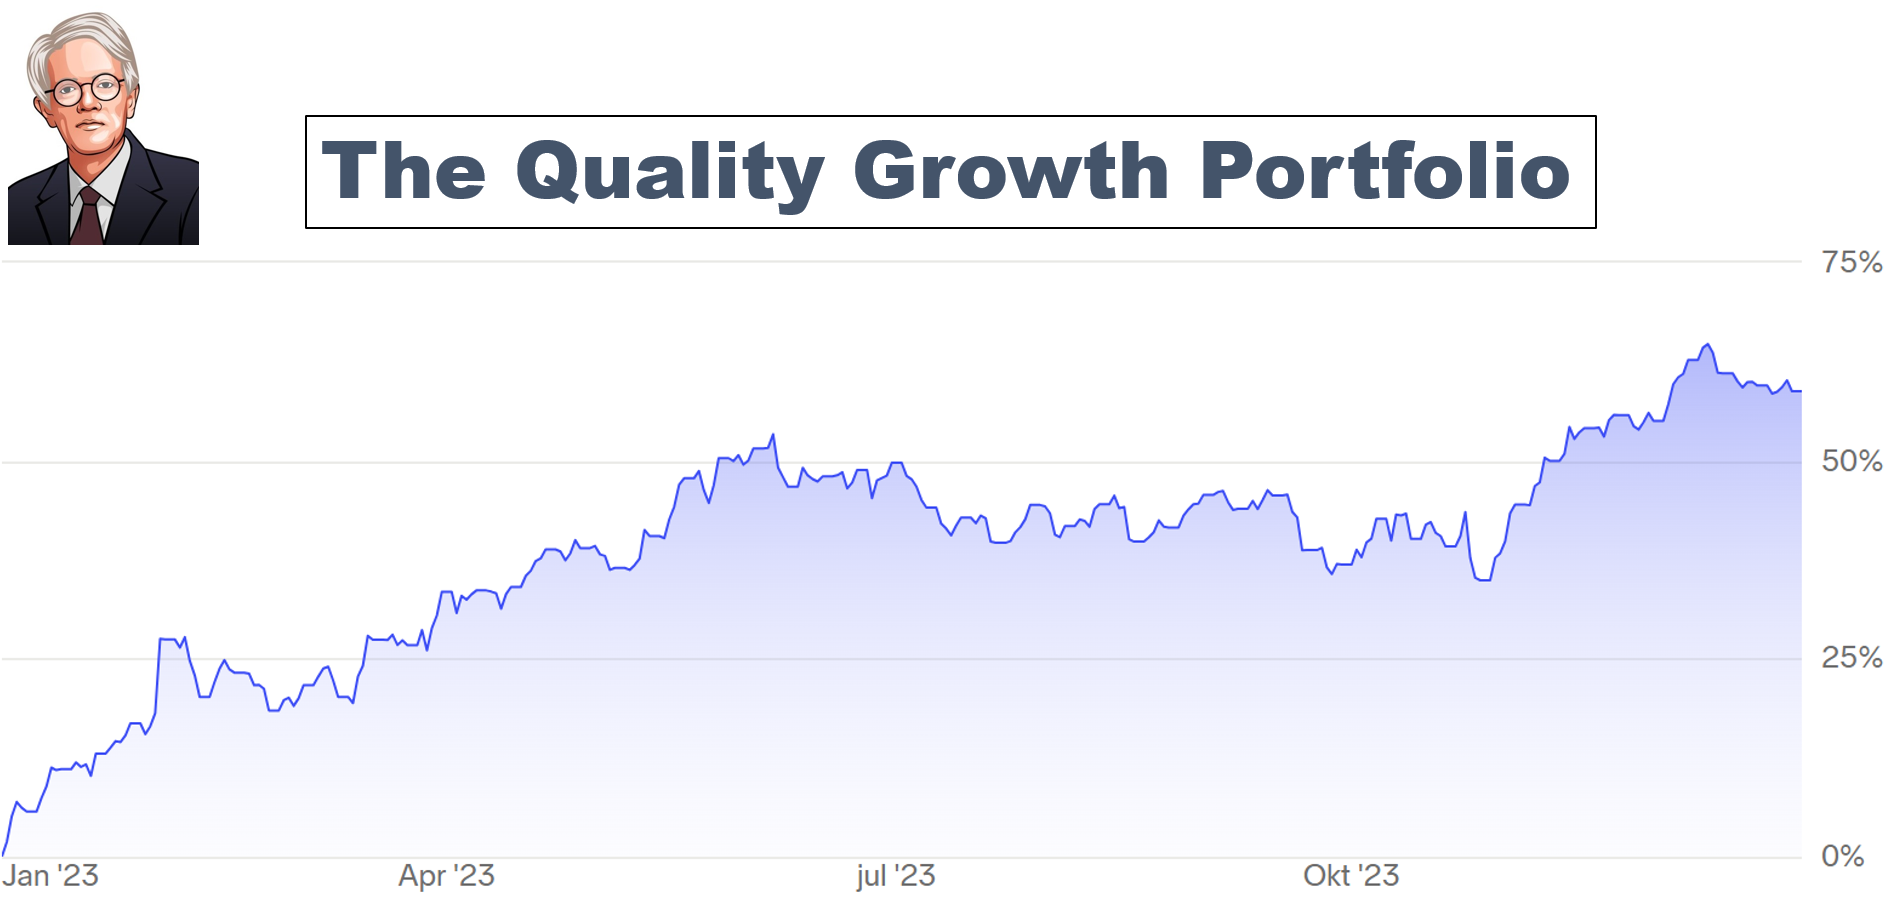
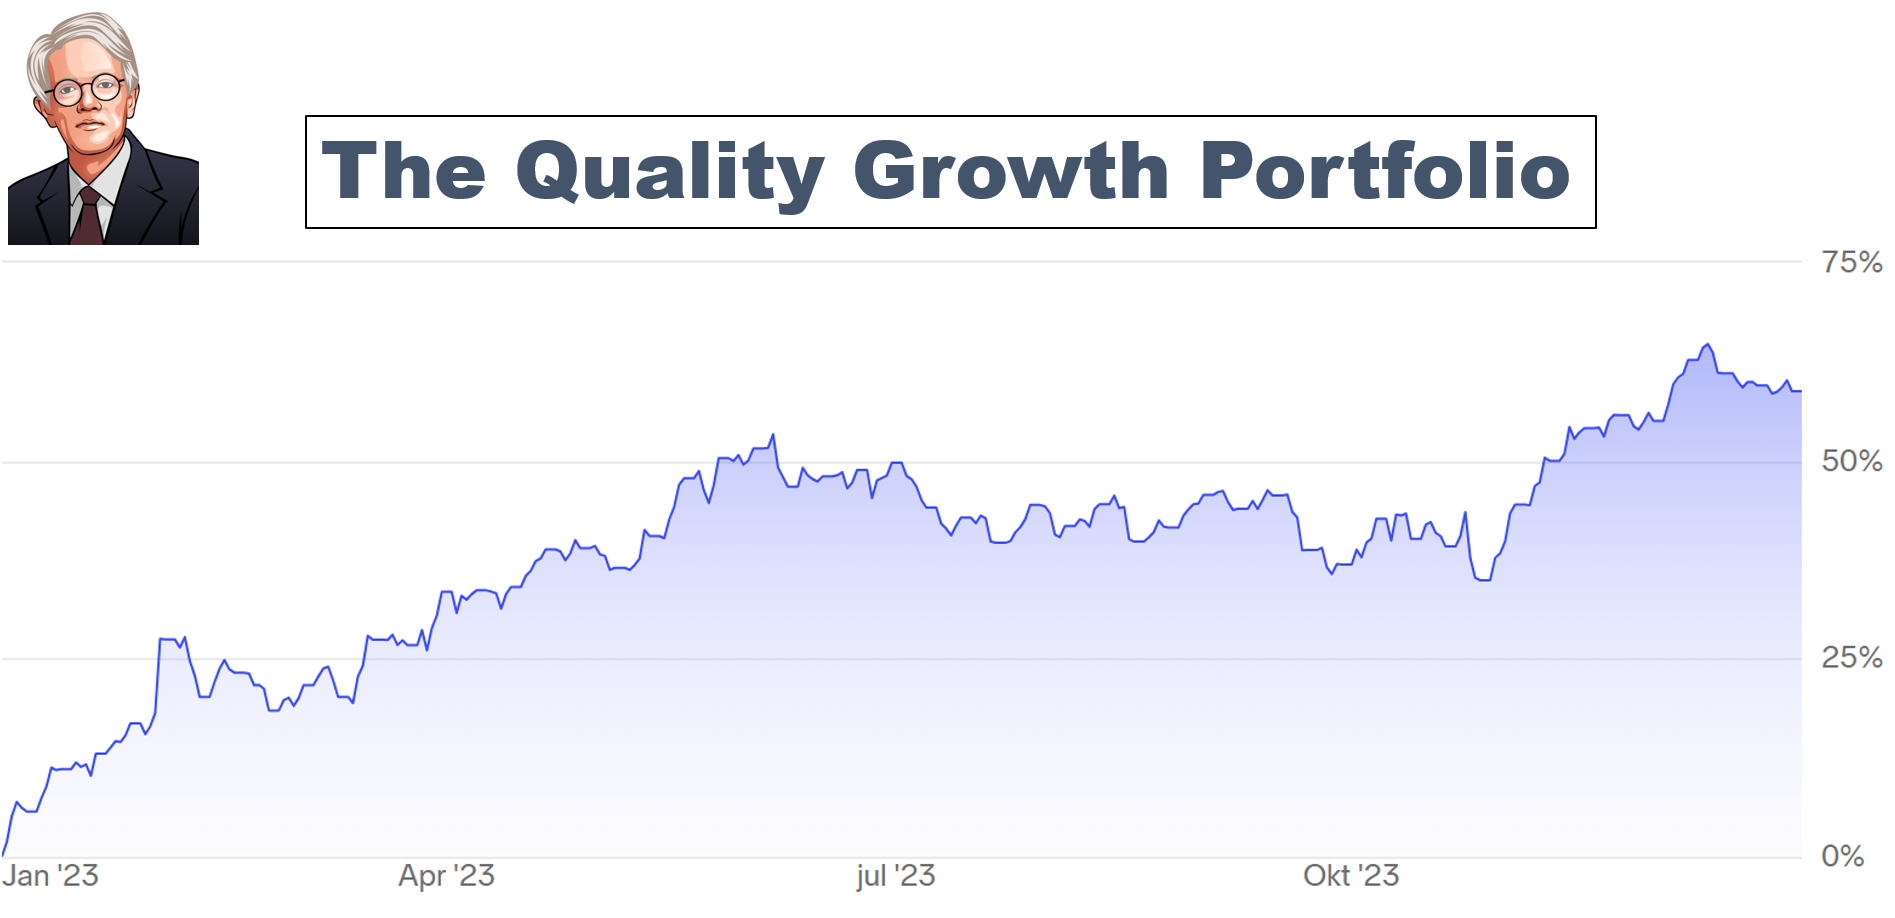
  • Real-time buy and sell alerts in the Quality Growth Portfolio

  • Monthly Deep Dives: Actionable breakdowns of world-class businesses

Get 25% off forever

Read more

☐ ☆ ✇ Invest in Quality

Buying a New Tech Compounder 🚀

By: Invest In Assets 📈

Hi investor 👋

We all want to benefit from the boom in AI and new technology, but the question is always:

What company wins?

  • Nvidia or custom silicon?

  • OpenAI or Anthropic?

  • GPUs or XPUs?

If you pick the wrong side of that bet, it doesn’t matter how cheap the stock looked going in.

That question is hard to answer. But what if you could invest in a company that is positioned to grow massively despite who wins in the end?

What I want is a business that gets paid regardless of which AI lab wins, which architecture wins, or which hyperscaler spends the most.

I believe I’ve found it, so I’m starting a new position this week.

Here’s the stock, why I bought it, and why I think it’s one of the better ways to get exposure to the massive AI and emerging technology trends without picking the exact winner.

The rest of this article, the stock, the thesis, the valuation case, and the risks, is for Premium subscribers only.

Get 25% off forever

Read more

☐ ☆ ✇ Invest in Quality

The Hardest Part of Investing Has Nothing to Do With Stocks 💎

By: Invest In Assets 📈

Doing nothing.

Long-term investing is usually framed as a test of intelligence.

It isn’t.

It is a test of temperament under boredom.

The hardest part of long-term investing is not:

  • Finding good businesses

  • Understanding economics

  • Surviving drawdowns

It is sitting still while nothing happens, and resisting the urge to act.

Invest in Quality is a reader-supported publication. To receive new posts and support my work, consider becoming a free or paid subscriber.

Why Inactivity Feels Like Failure

Most investors are conditioned to equate activity with competence.

In markets, this becomes dangerous when:

  • Prices drift sideways

  • News is repetitive

  • Portfolios look unchanged

It feels like something must be done.

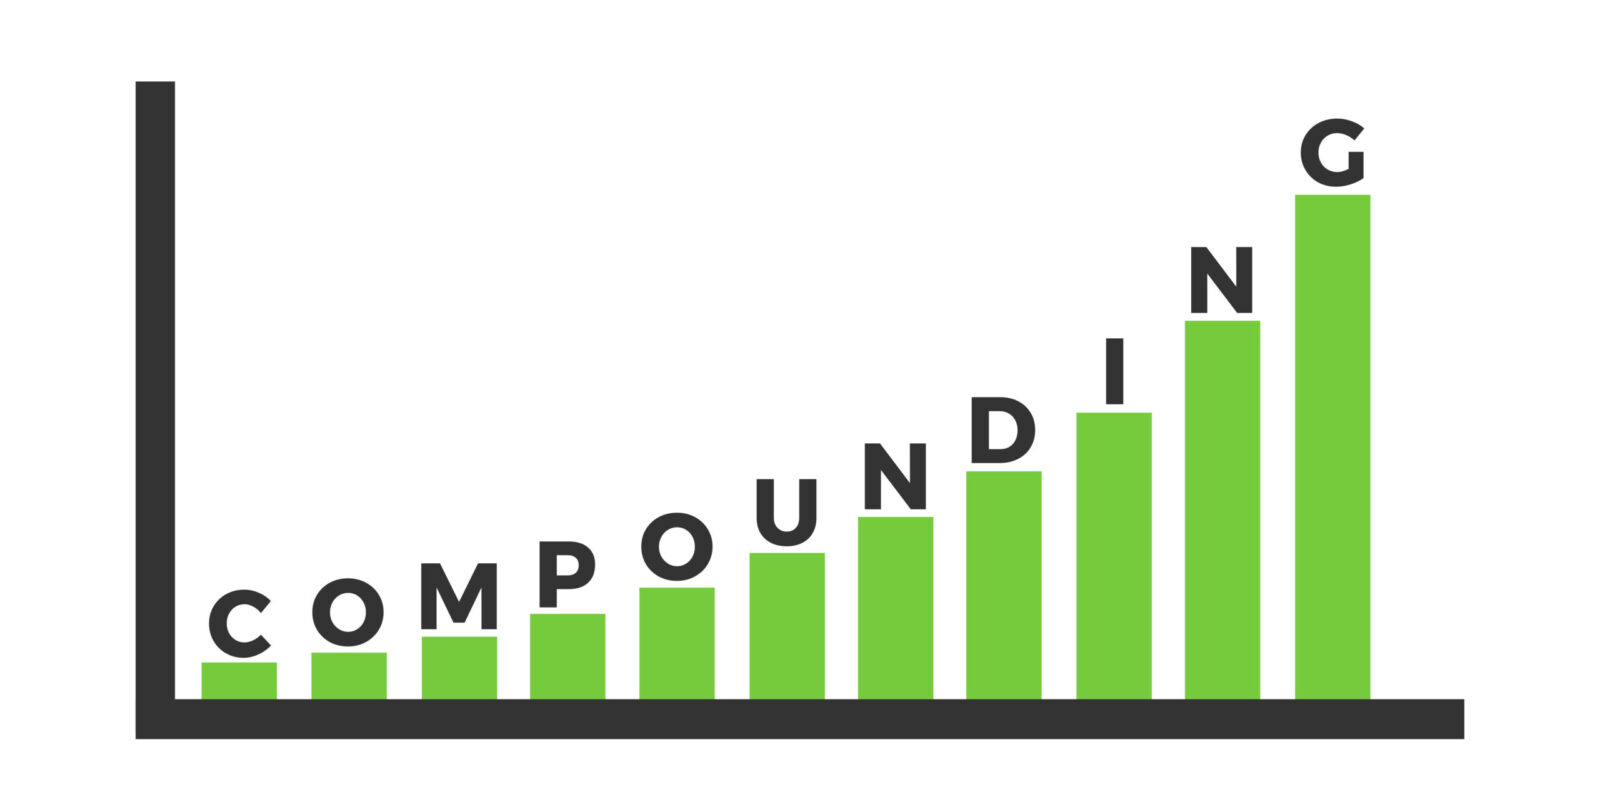
But compounding does not announce itself.

It works on timescales that do not align with human attention.

The mismatch between business progress and market feedback is where most investors break.

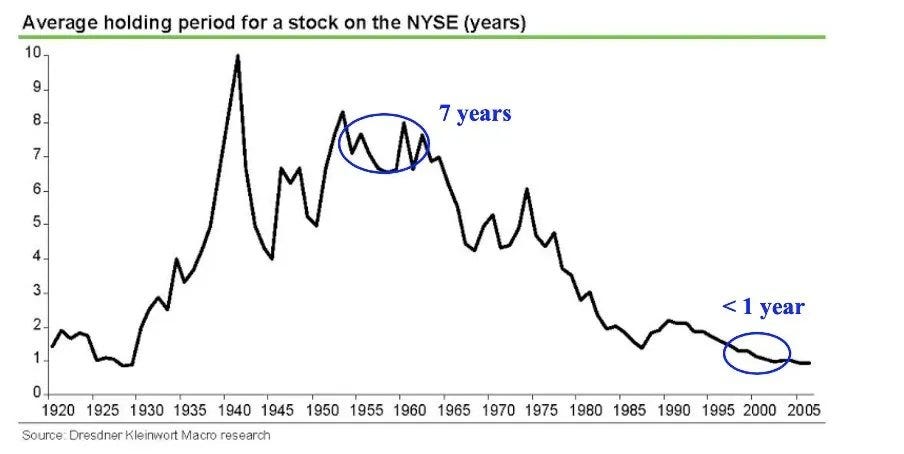
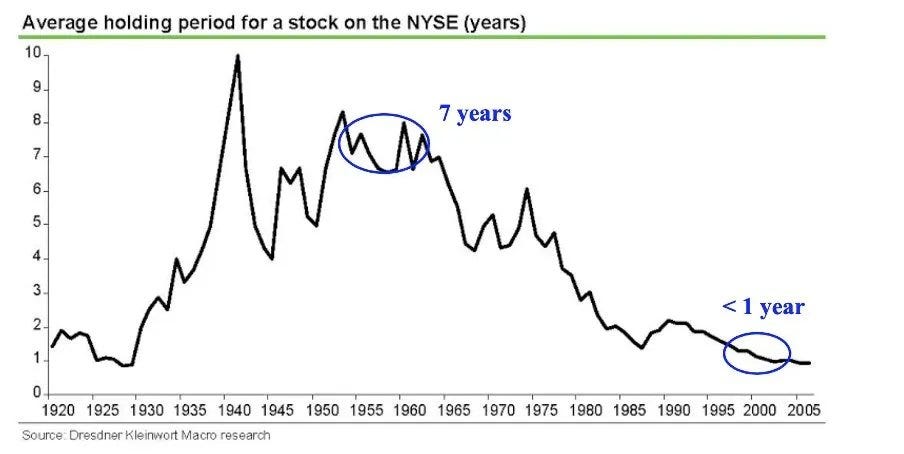
This need to ‘act’ shows up in the data, as our portfolios become more accessible to us with new technologies:

Compounding Is a Slow, Uneventful Process

A great business compounds through:

  • Incremental price increases

  • Modest reinvestment

  • Operational discipline

  • Capital allocation over time

None of this is exciting quarter to quarter.

The stock, meanwhile, may:

  • Go nowhere for years

  • Underperform flashier peers

  • Test your conviction without breaking the thesis

This is not a bug, but a feature of compounding. If you want an edge, think longer term than most investors.

Why Doing Nothing Is So Difficult

Inactivity creates three pressures:

1. Social Pressure

Other investors are always doing something.

New ideas. New trades. New narratives. New winners.

Doing nothing feels unsophisticated by comparison, even when it’s correct.

2. Psychological Pressure

The brain wants feedback.

No movement feels like stagnation, even if the underlying value is compounding steadily.

3. Career and Identity Pressure

For professionals, activity signals relevance.

For individuals, it signals engagement and competency.

Inactivity feels like neglect, even when it’s discipline and deliberate.

The Cost of Unnecessary Action

Most long-term underperformance does not come from catastrophic mistakes.

It comes from small, unnecessary actions:

  • Selling a great business too early

  • Rotating into something “more exciting”

  • Reacting to temporary underperformance

  • Optimizing for short-term validation

Each action feels rational in isolation.

Collectively, they interrupt compounding.

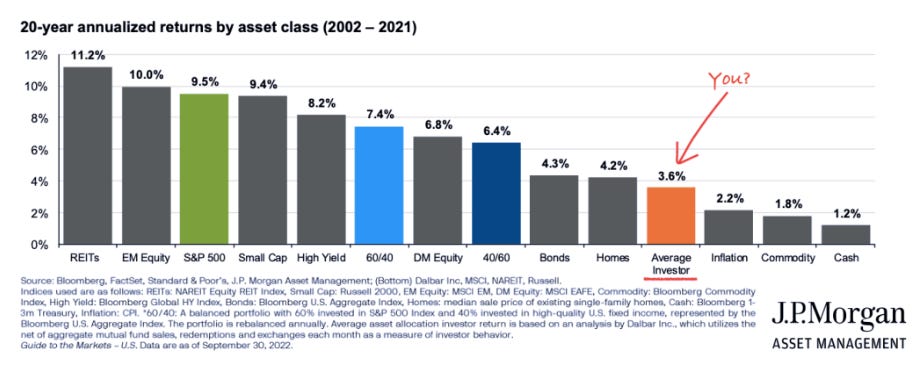
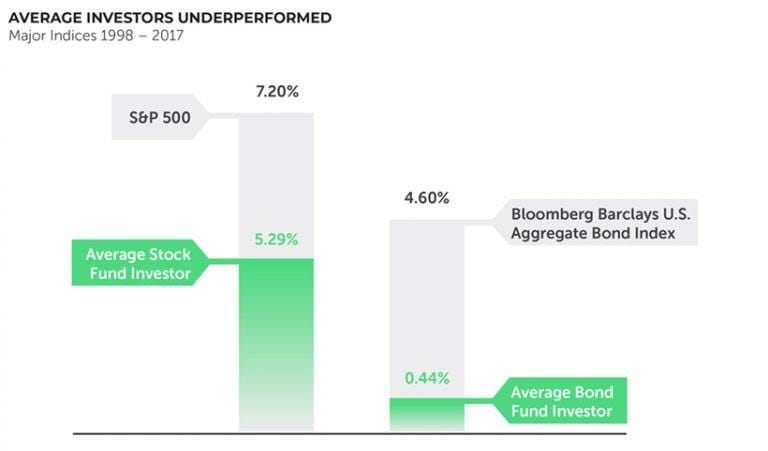
The result? You drift towards the average investor:

And, before you praise index fund or bond investors, they also underperform the funds they invest in for the same reason:

When Inactivity Is the Correct Action

Doing nothing is an edge when:

  • The business fundamentals are intact

  • Reinvestment economics remain attractive

  • Management is disciplined

  • The valuation is not extreme

In those conditions, activity adds risk, and not return.

Time is doing the work for you. Just allow it.

The Reframe That Changes Everything

The goal of long-term investing is not to be active.

It is to own the few things that deserve time.

Once that work is done, the highest-value decision is often to get out of the way.

This reframes inactivity from laziness to restraint.

“Time is your friend: Impulse is your enemy”

—John Bogle

Why the Best Investors Look Boring

Great long-term investors:

  • Trade infrequently

  • Repeat themselves

  • Appear inactive for long stretches

Not because they lack ideas, but because they understand opportunity cost.

Every action competes with the alternative:

letting a great business keep compounding.

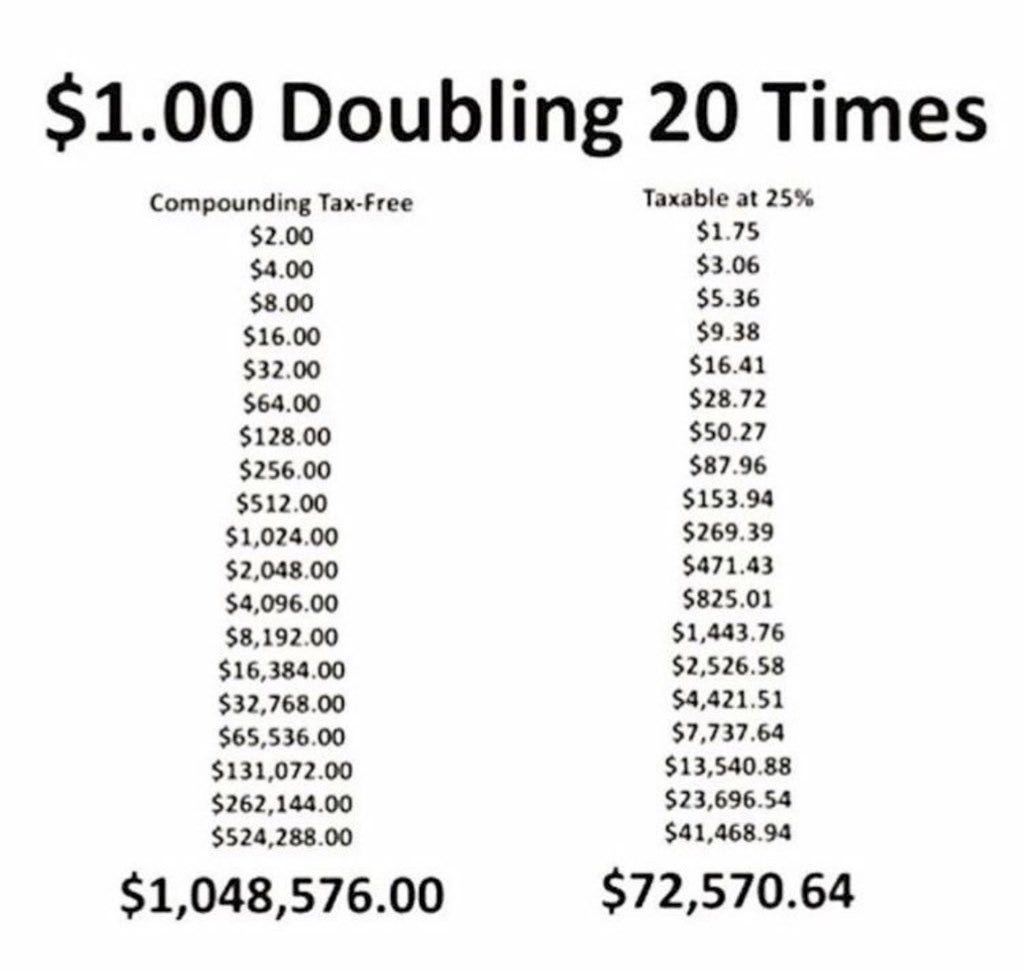
There are also tax advantages to holding a position versus buying a new:

A Practical Test

When you feel the urge to act, ask:

Has something fundamental changed, or am I just uncomfortable with stillness?

If the answer is the latter, doing nothing is likely the correct move.

The Irony

The market rewards:

  • Patience

  • Restraint

  • Endurance

But provides constant incentives to abandon them.

The edge is not seeing more.

It is interfering less.

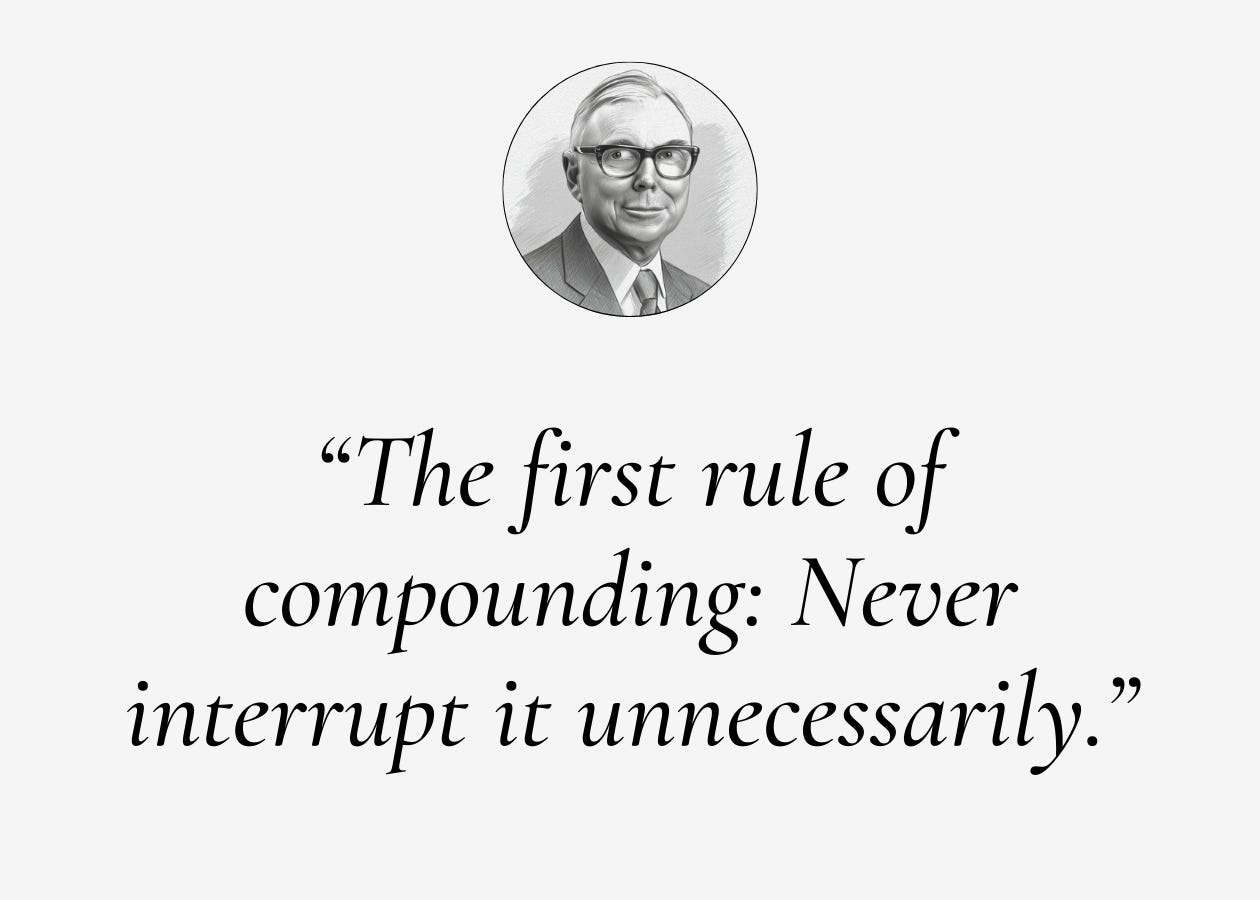
Remember Charlie Munger’s rule:

The first rule of compounding: Never interrupt it unnecessarily.

Final Thought

Long-term investing is not a game of constant optimization.

It is a game of avoiding self-inflicted wounds while time compounds a small number of good decisions.

Most people can buy a great business.

Very few can sit with it through peaks and valleys, year after year, while nothing happens, headlines change, and boredom sets in.

That is the hardest part.

And for those who can do it, it is also the single best edge an investor can have.

Ready to take the next step? Here’s how I can help you grow your investing journey:

  1. Go Premium — Unlock exclusive content and follow our market-beating Quality Growth portfolio. Learn more here.

  2. Essentials of Quality Growth — Join over 300 investors who have built winning portfolios with this step-by-step guide to identifying top-quality compounders. Get the guide.

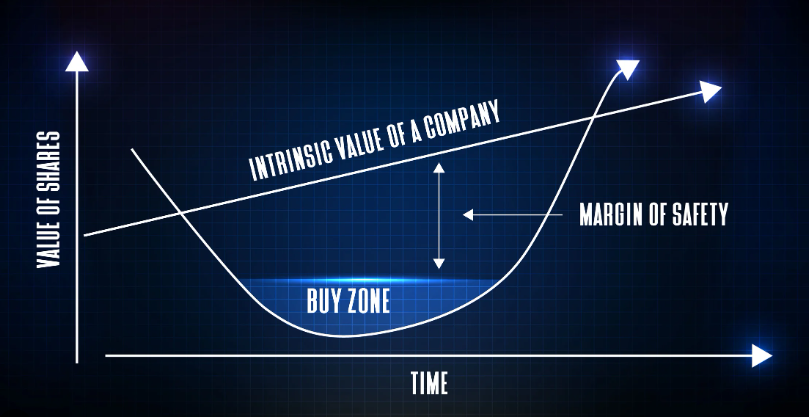
  3. Free Valuation Cheat Sheet — Discover a simple, reliable way to value businesses and set your margin of safety. Download now.

  4. Free Guide: How to Identify a Compounder — Learn the key traits of companies worth holding for the long term. Access it here.

  5. Free Guide: How to Analyze Financial Statements — Master reading balance sheets, income statements, and cash flows. Start learning.

  6. Get Featured — Promote yourself to over 24,000 active stock market investors with a 42% open rate. Reach out: investinassets20@gmail.com

Invest in Quality is a reader-supported publication. To receive new posts and support my work, consider becoming a free or paid subscriber.

☐ ☆ ✇ Invest in Quality

Terry Smith's Radical Shift in Strategy 📈

By: Invest In Assets 📈

Hi, investor 👋

Terry Smith, the legendary quality investor, just made the biggest strategy shift of his career.

For 20 years, his playbook was simple: buy great companies, pay a fair price, hold forever.

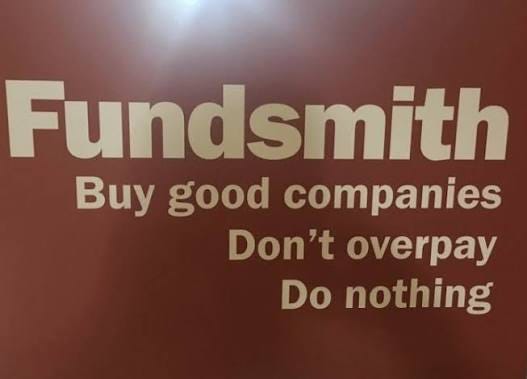
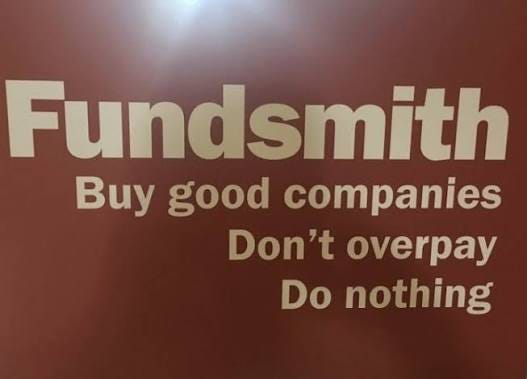
The best 7-word investing philosophy I've ever seen:

That approach made him one of the best fund managers in the world.

It’s also the approach he just significantly broke from.

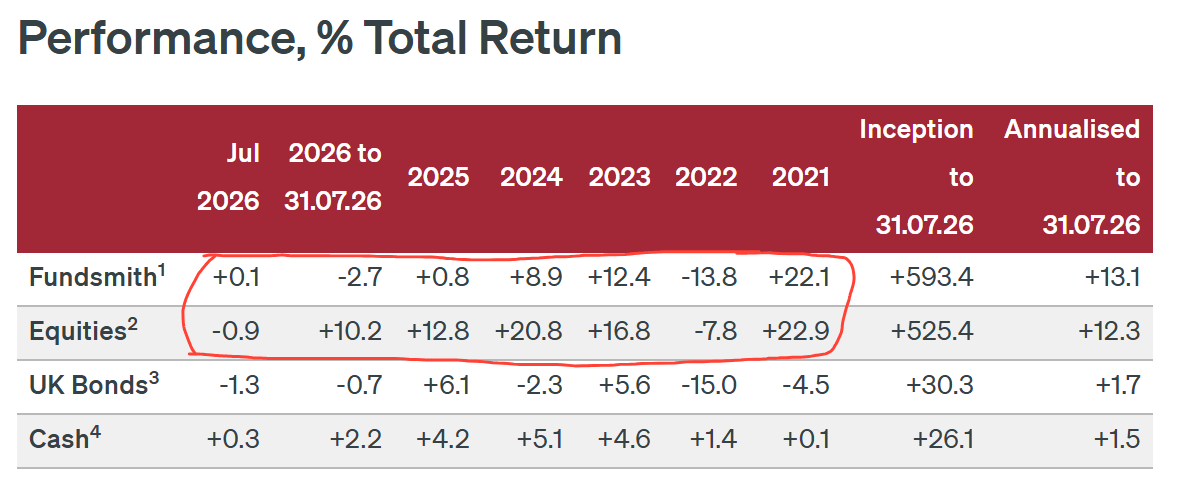
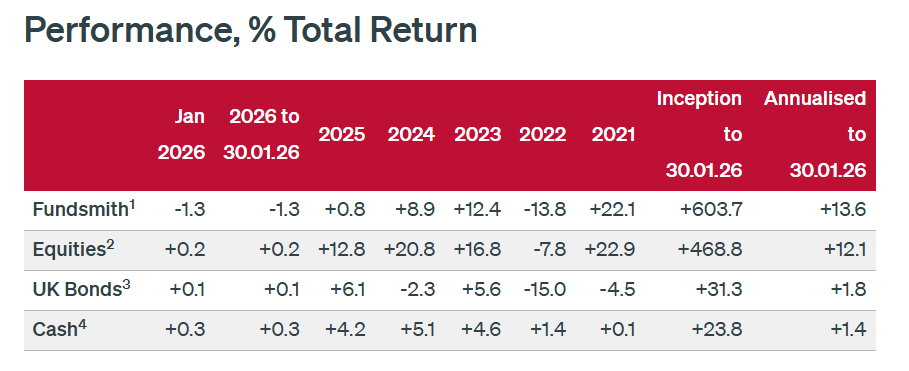
The shift comes after five straight years of underperformance, with Fundsmith now barely ahead of its benchmark since inception, despite being miles ahead of it at points in the past.

Many investors are saying Terry has lost the plot. I think he’s finally fixing the one thing that made him great in the first place, and then let him down.

Subscribe now

What made Terry Smith great

I’ve followed Terry’s portfolio for years. What actually drove his best returns wasn’t just “buy quality.” It was buying quality at a discount.

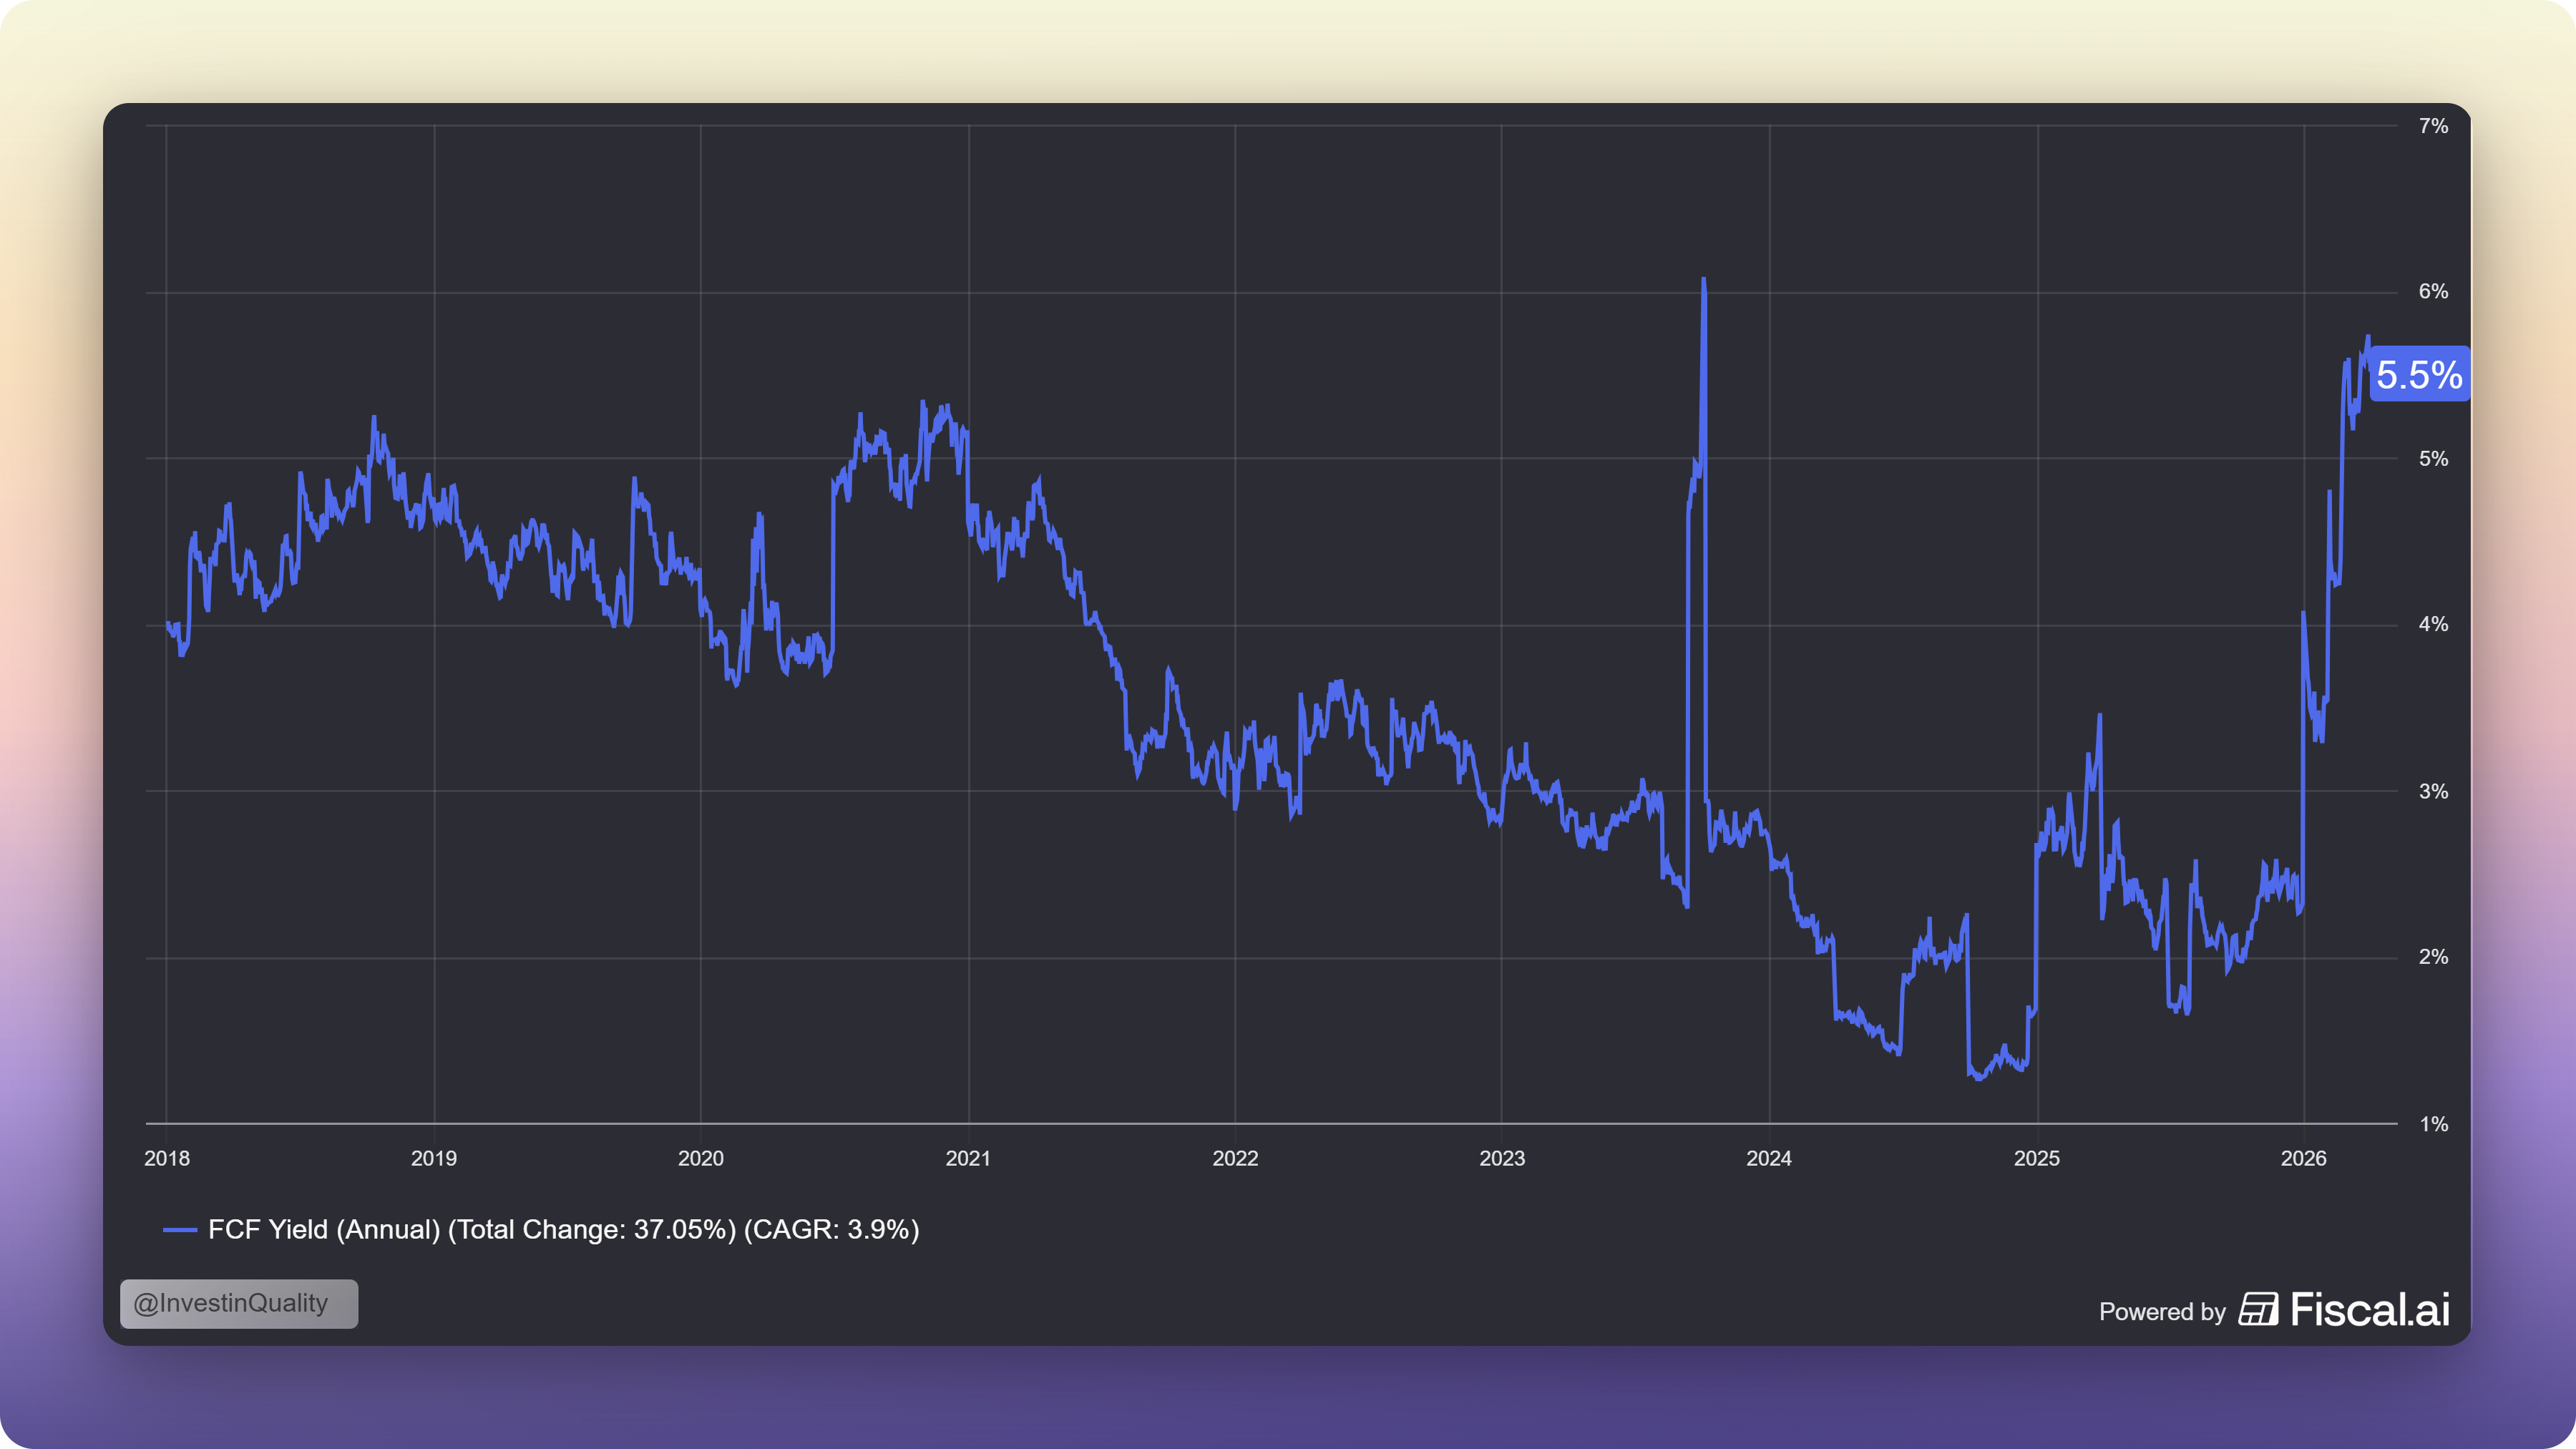
At the start of his best-performing stretch, his holdings had a meaningfully higher free cash flow yield than the index.

That gap closed over time, and eventually his portfolio got more expensive than the market.

For a while, that didn’t matter, because he was getting paid twice: multiple expansion and earnings growth, compounding together. That combination is what built the legend (The dual engine of compounding).

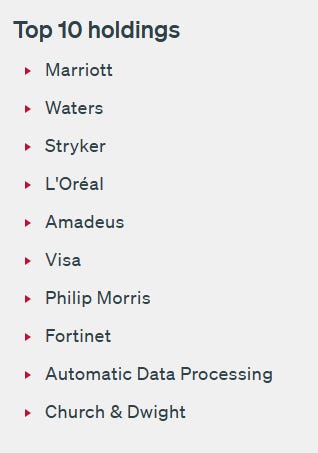
But in recent years, Terry got complacent and kept holding expensive, slow-growing “quality” names well past the point where the valuation made sense. Look at his top holdings before this shift:

Marriott International (his top holding):

  • 38.6x trailing earnings

  • 30.9x forward

  • 2.9% FCF yield

  • 11.4% expected growth

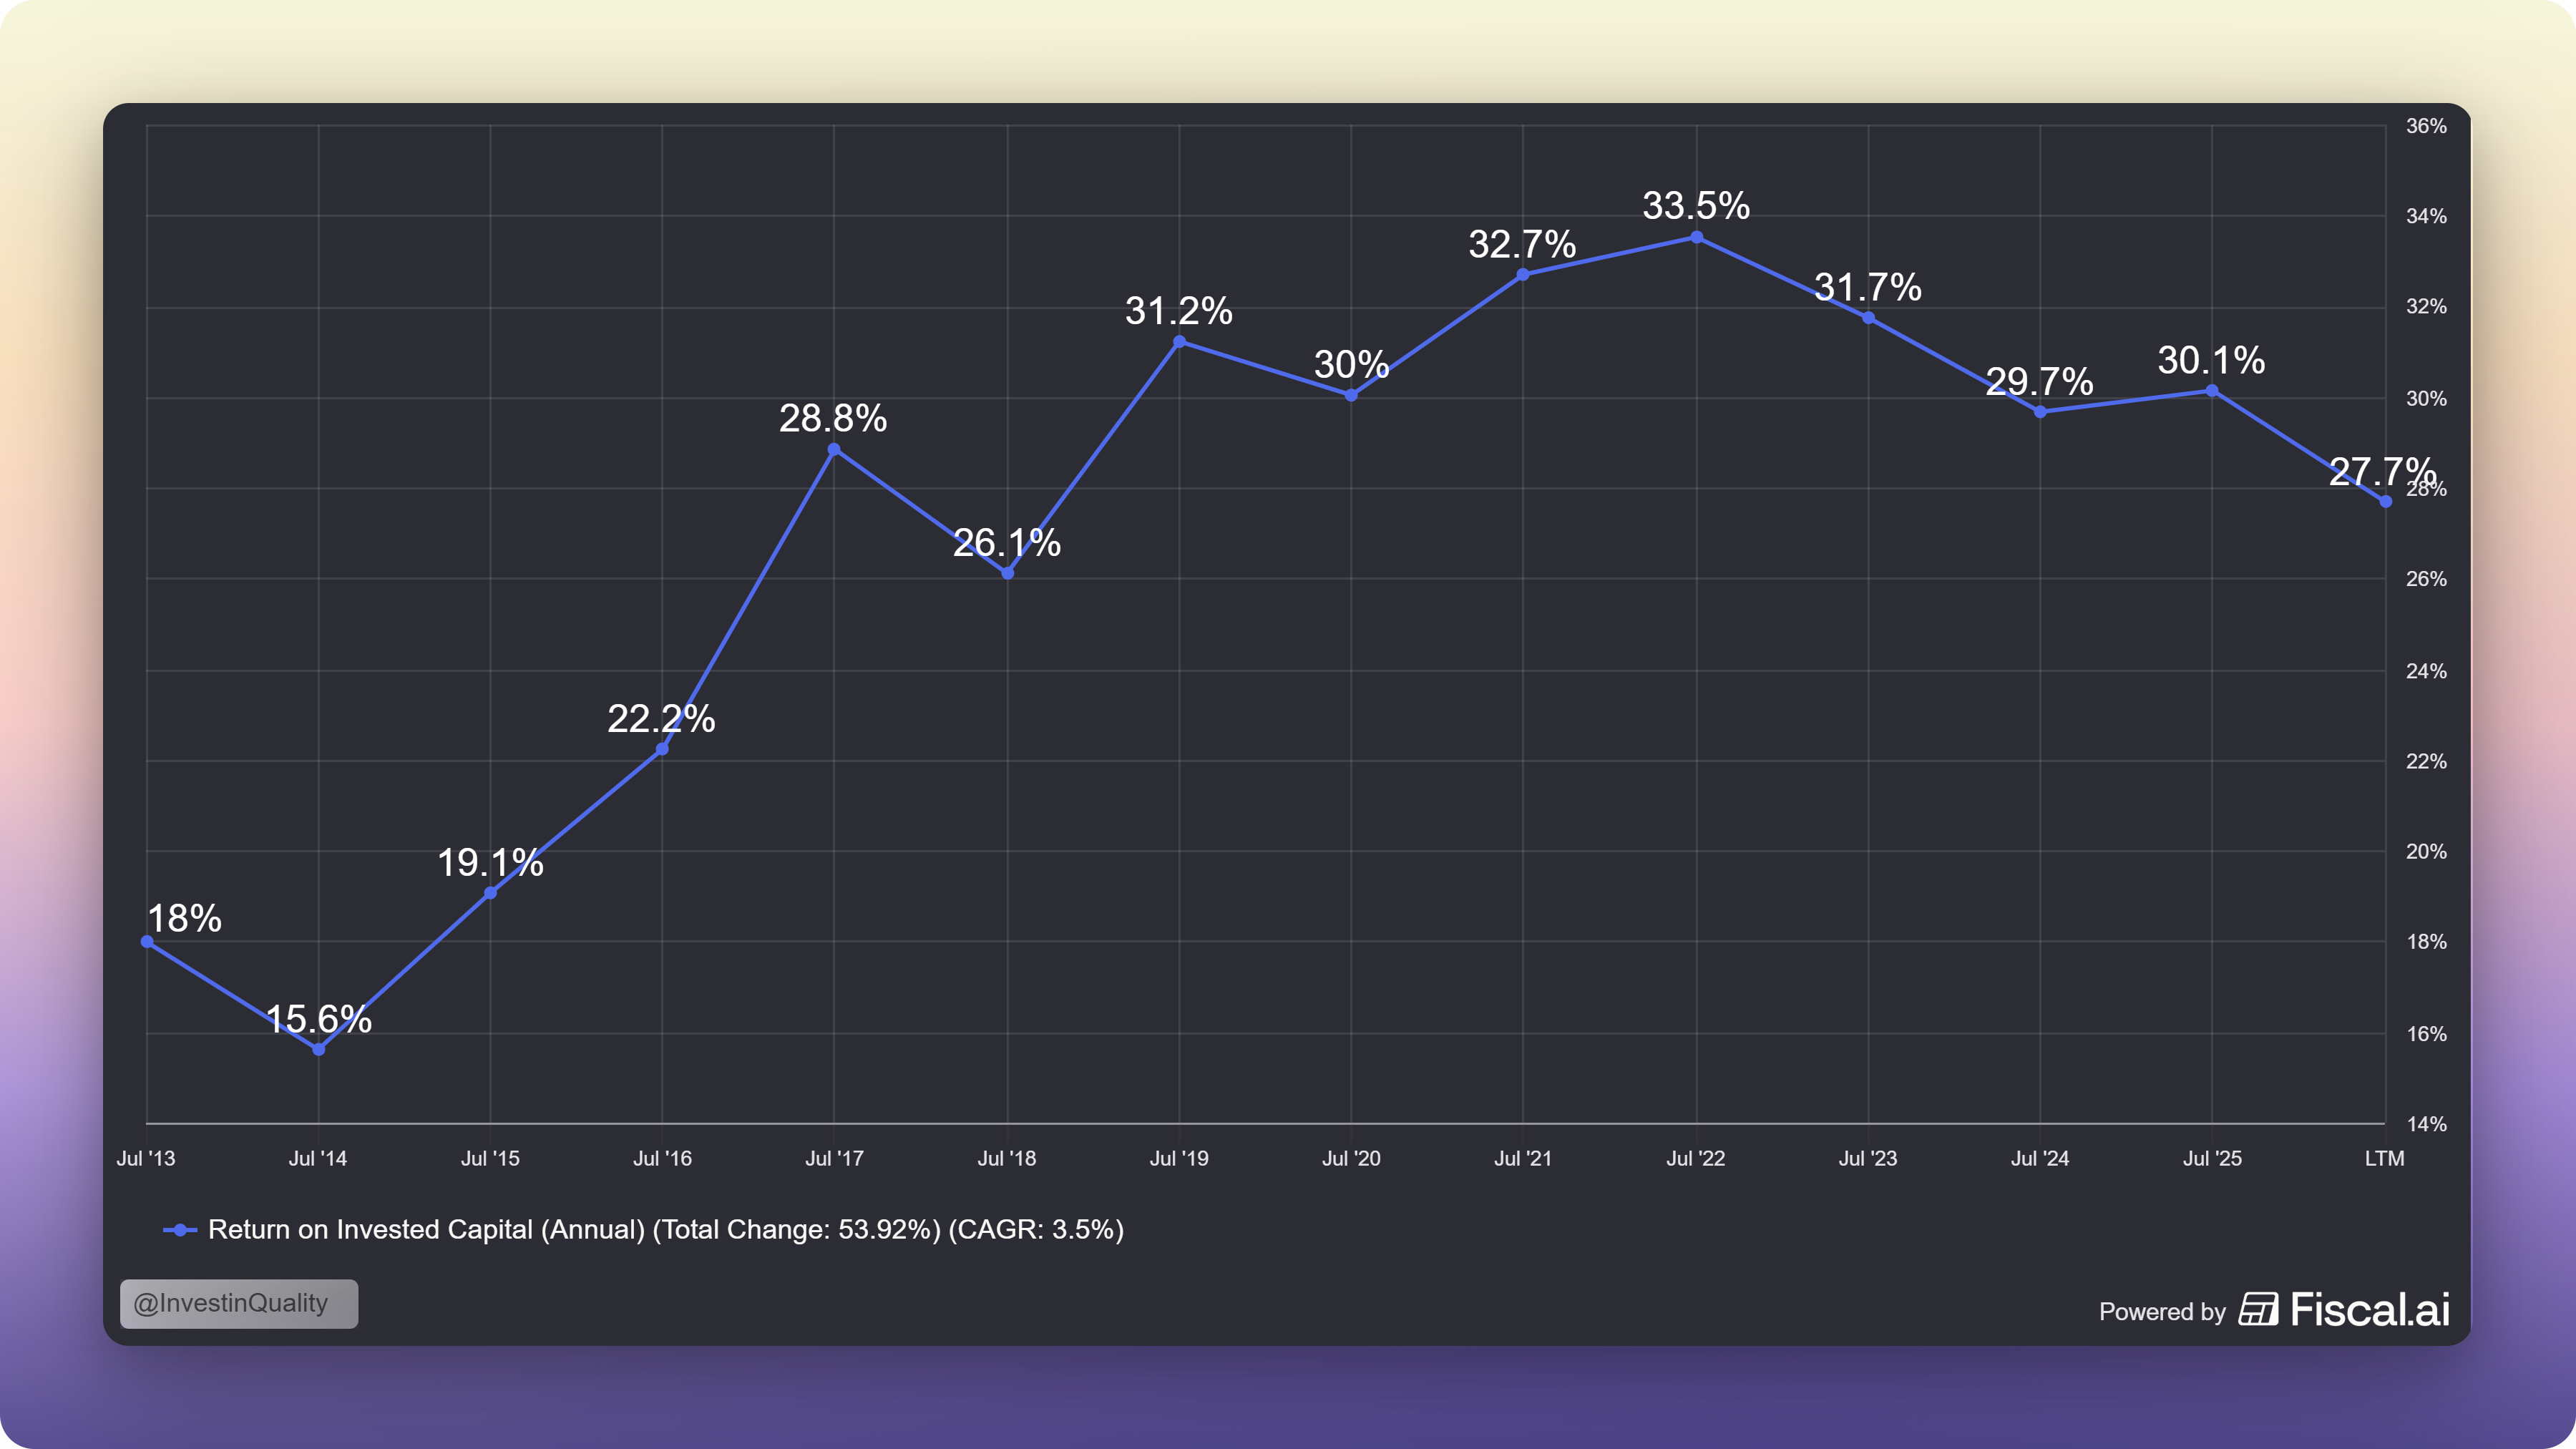
  • ROIC of just 12.8%

From 2022 to TTM 2026, the PE expanded 19.64% annually while EPS only grew 8.03%. Almost all the stock’s return came from multiple expansion.

Waters Corp.

  • 46.8x trailing PE

  • 24.6x forward

  • 11.1% expected growth

The stock hasn’t moved in five years. The PE expanded from ~32x to 46.8x while EPS actually contracted 7.4% annually.

Even a strong future (12% EPS growth, premium multiple held) only gets you to a 12% return, and that’s the good case.

Stryker Corp.

  • 36.9x trailing PE

  • 20.3x forward

  • 10.8% expected growth

  • 9.5% ROIC

The same story with Stryker Corp., expensive relative to growth.

These are great businesses. But from these valuations, there’s no realistic path to the ~15% annual returns Fundsmith investors have come to expect. You’re much more likely to get multiple contraction than expansion from here.

So Terry appears to have concluded that his strategy needed to evolve.

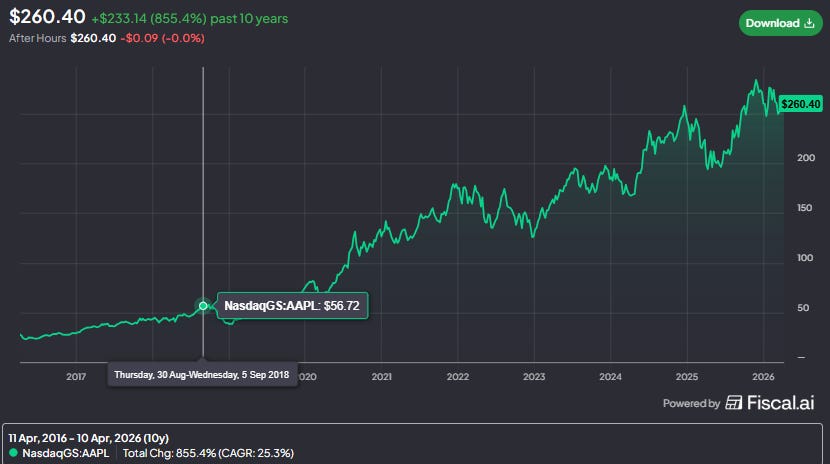
We’ve seen Buffett do the same thing when he bought Apple in 2016, breaking his own rule against high-tech businesses outside his circle of competence.

It became his most profitable trade ever.

Terry is making a similar bet: shift toward businesses actually positioned to grow, even if that means paying up and taking on more risk.

Terry is just doing it in a more dramatic fashion than Buffett.

Subscribe now

What he sold: expensive stalwarts with fading growth

The pattern across nearly every sale is the same: good business, bad combination of price and growth.

Atlas Copco – Organic growth has been weak for two years, not enough to justify a sub-3% FCF yield after the stock’s sharp run-up.

Coloplast – Organic growth slowed from a long-term average of 8% to 6%, alongside a couple of high-profile acquisition missteps.

EssilorLuxottica – Lower margins on smart glasses forced management to abandon its long-term profit targets. Still an interesting business riding the wearables trend, but competition is intensifying.

Intuit – Bought back only recently, sold again over how management handled the poor Mailchimp acquisition, including reporting results ex-Mailchimp, which both confirms how bad the deal was and raises concerns about denial. Terry prefers Sage for similar exposure without the Mailchimp baggage.

LVMH – China, its key market, is unlikely to recover until the property market does. Family succession is also a growing concern.

Magnum Ice Cream Co. – Too small and illiquid to build a meaningful position, and expensive relative to its growth.

Mettler-Toledo – Underlying growth of just 1% this year doesn’t justify its traditionally premium valuation.

Nike – The turnaround under new CEO Elliott Hill is taking longer than expected, with China and Converse still dragging.

Novo Nordisk – A market-leading position in the biggest drug discovery in decades, turned into an investment disaster. Terry defended this position publicly multiple times before finally deciding capital was better allocated elsewhere. In hindsight, the ideal exit was earlier, when the problems first surfaced, but a recovery before 2027 looks unlikely and this isn’t an unreasonable sale. Fundsmith gave up nearly all its gains from the position first built around 2017–2019.

Otis – Growth in maintenance and modernization hasn’t offset the decline in new construction demand from China.

Unilever – New CEO Hein Schumacher initially impressed by ruling out near-term M&A. He was fired after 18 months and replaced by CFO Fernando Fernandes, whose appointment was quickly followed by spinning off the ice cream business and a deal to transfer the food business to McCormick, despite earlier assurances there’d be no further disposals. It has the fingerprints of activist board member Nelson Peltz, whose track record with corporate restructuring Terry doesn’t trust. McCormick’s ROIC has consistently run in the single digits, and the deal structure doesn’t even give shareholders a vote.

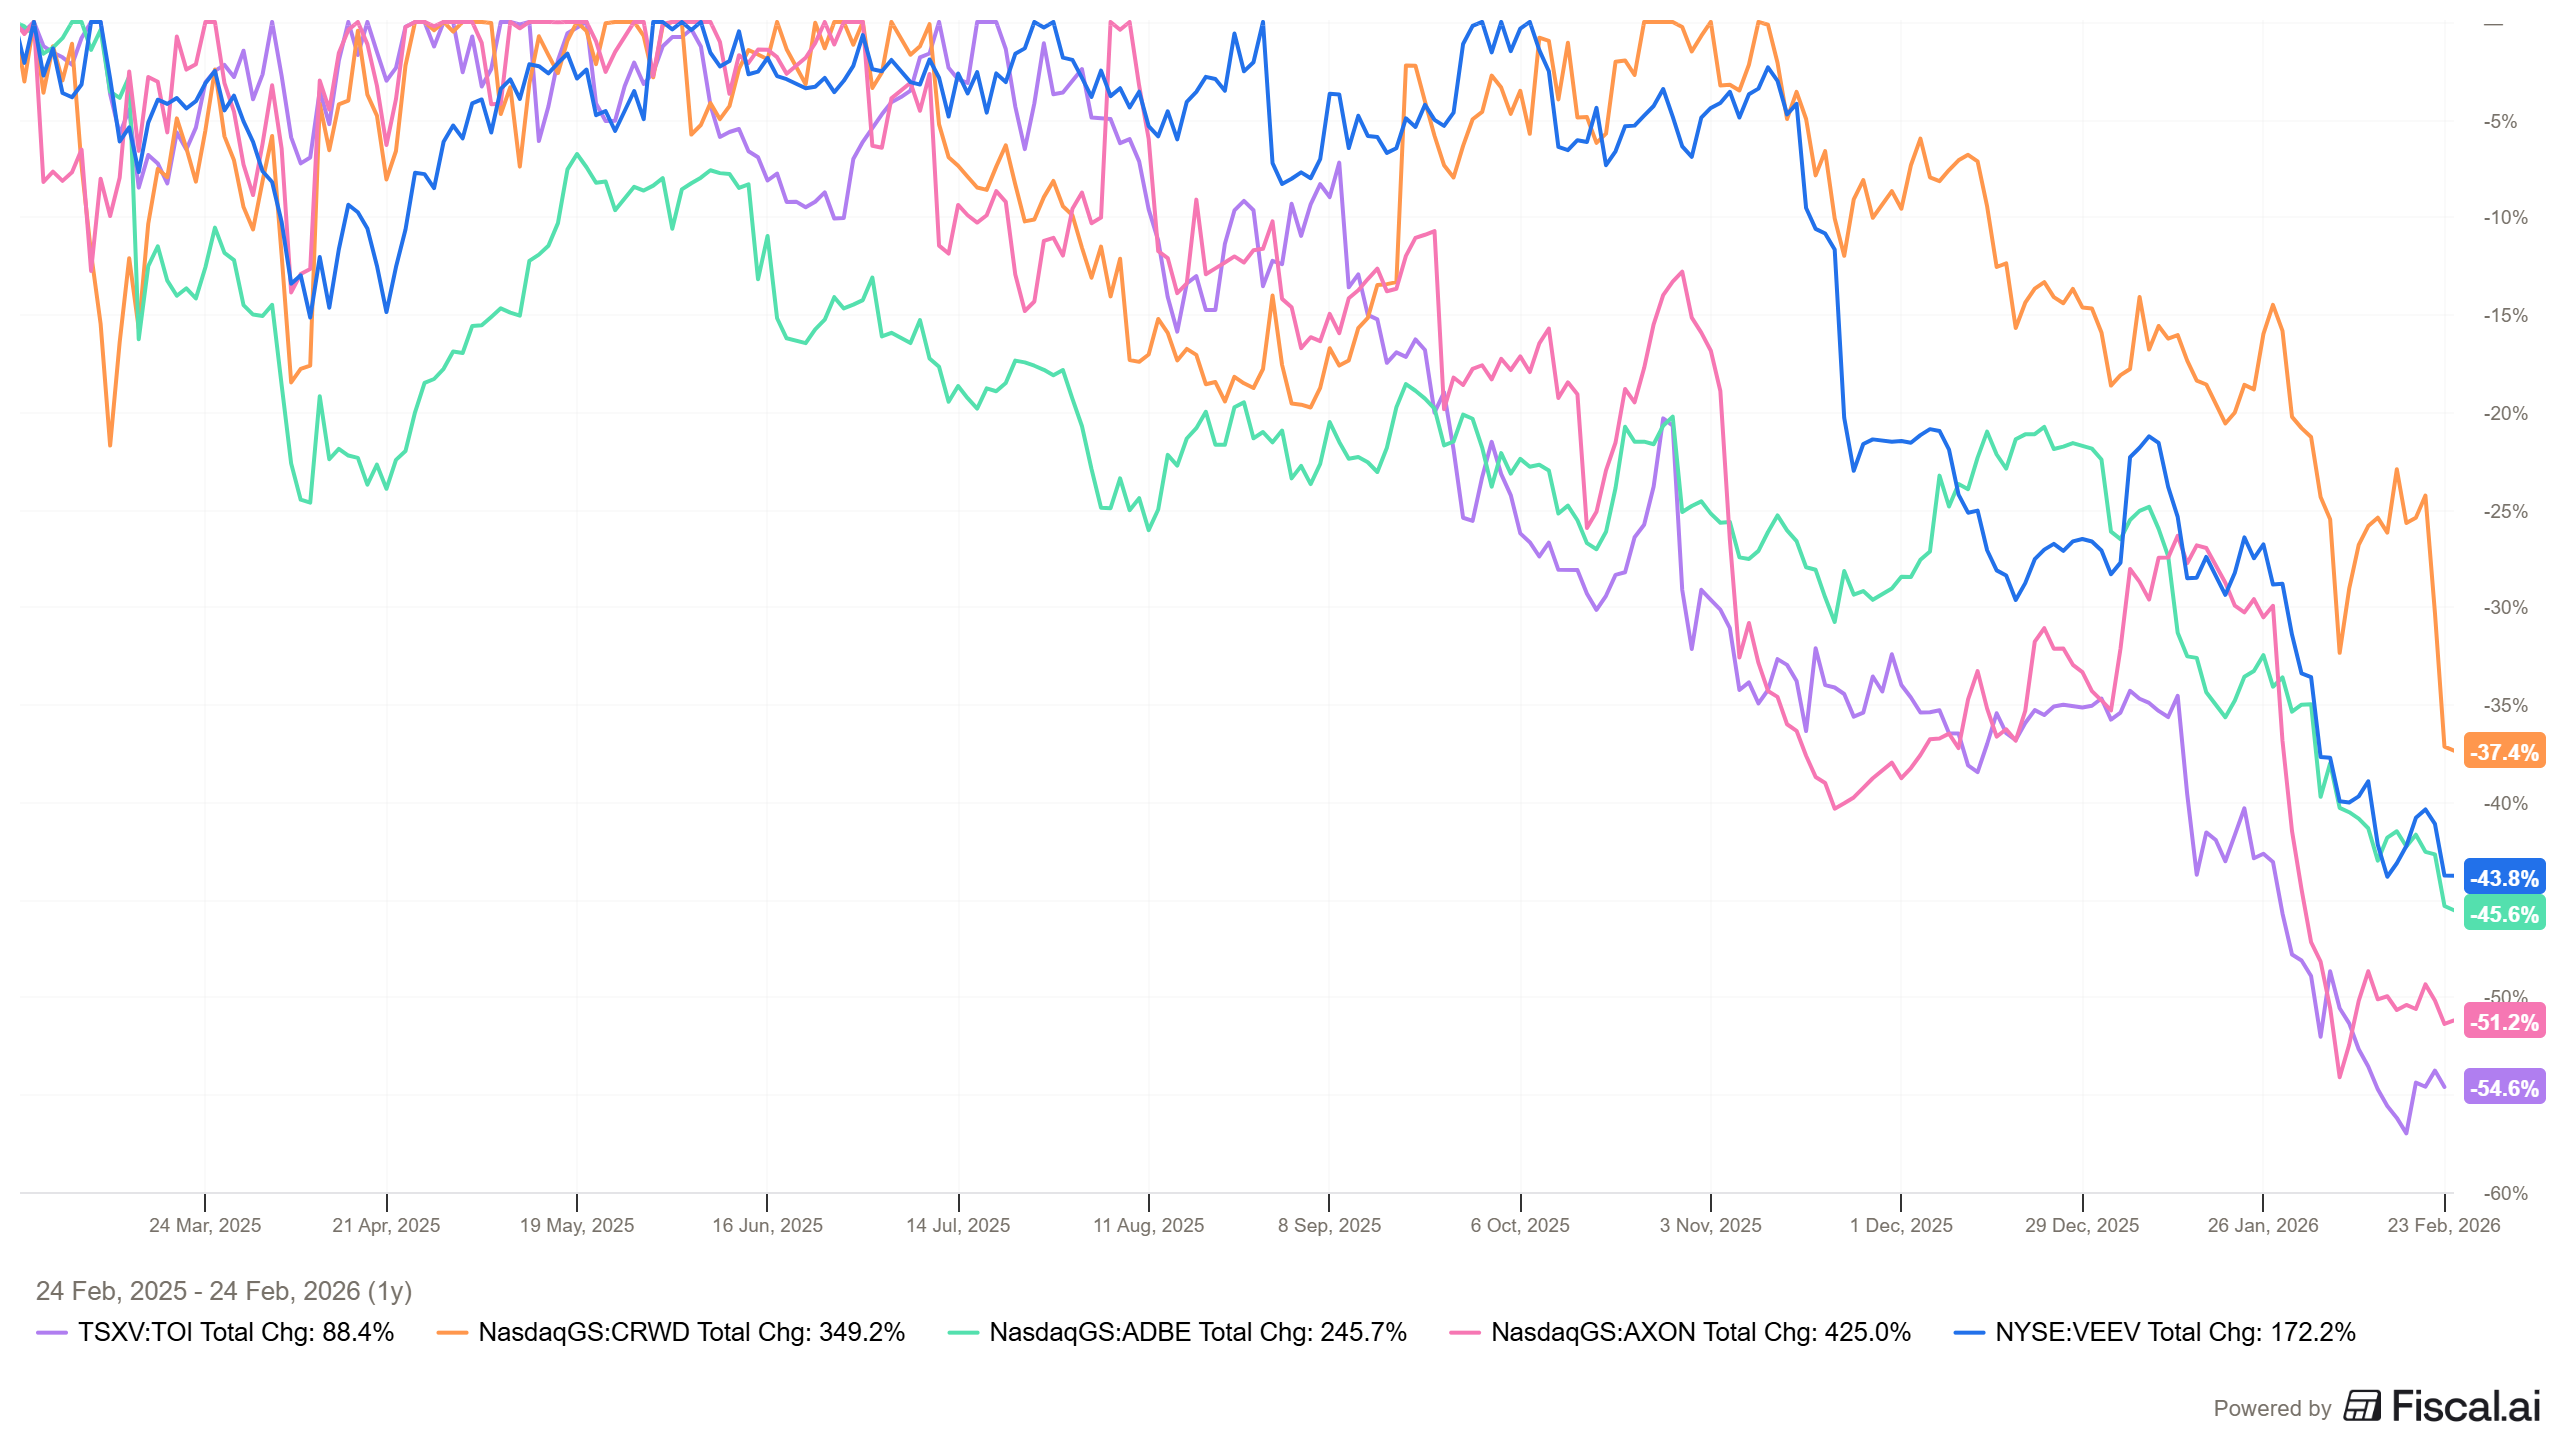
Wolters Kluwer – Still a business Terry thinks AI won’t disrupt much, but he sees better value elsewhere in the post-”SaaSpocalypse” space, namely Sage and Veeva Systems, both offering higher growth and/or lower valuations.

Zoetis – Management hasn’t responded effectively to new generic competition, and can’t articulate a clear plan. Cheap, but growth is slowing and the competitive position is weakening.

None of these are bad sales on their own.

What’s striking is that Terry bought several of these names recently, which is part of why the reversal feels so abrupt.

It reminds me of Buffett’s willingness to admit a mistake and move on fast. I relate to this one personally. I hold onto losers far longer than I should too.

Follow our real-money Quality Growth Portfolio, every buy, sell, and position size, with same-day alerts:

Get 40% off forever


Terry bought faster growth & higher risk

This is where the real story is.

Terry is buying businesses he’s never owned before, in sectors he’s historically avoided.

Industrials

  • GE Vernova builds and services the gas turbines and grid equipment that power roughly a third of the world’s electricity. The moat comes from scale and switching costs: once its turbines are installed, customers are locked into decades of high-margin, inflation-protected service contracts, and unlike elevators, this equipment can’t be serviced by third parties. Growth is tied to upgrading aging power grids and to “behind-the-meter” generation for AI data centers, backed by a $163bn order book, 4x 2025 revenue. GE Vernova also leads small modular nuclear reactors in the Western world, with its first commercial deployment expected in Canada by 2030. ROIC is ~20% and rising fast, FCF yield 2.6%. The stock is up 659.5% in a little over two years.

  • Legrand makes the unglamorous physical infrastructure inside buildings: wiring, sockets, busways. Its edge is an entrenched distribution network and electrician loyalty, professionals who won’t risk their reputation on unfamiliar components. It holds close to 20% global market share in wiring devices. Growth comes from energy-efficient smart buildings and data center power distribution, a market expected to triple in the US. ROIC is in the low 20s, FCF yield 4.4%, trading at 28.1x trailing / 22.4x forward earnings with 10.1% expected growth. Not a fast grower, but the data center exposure is likely the draw.

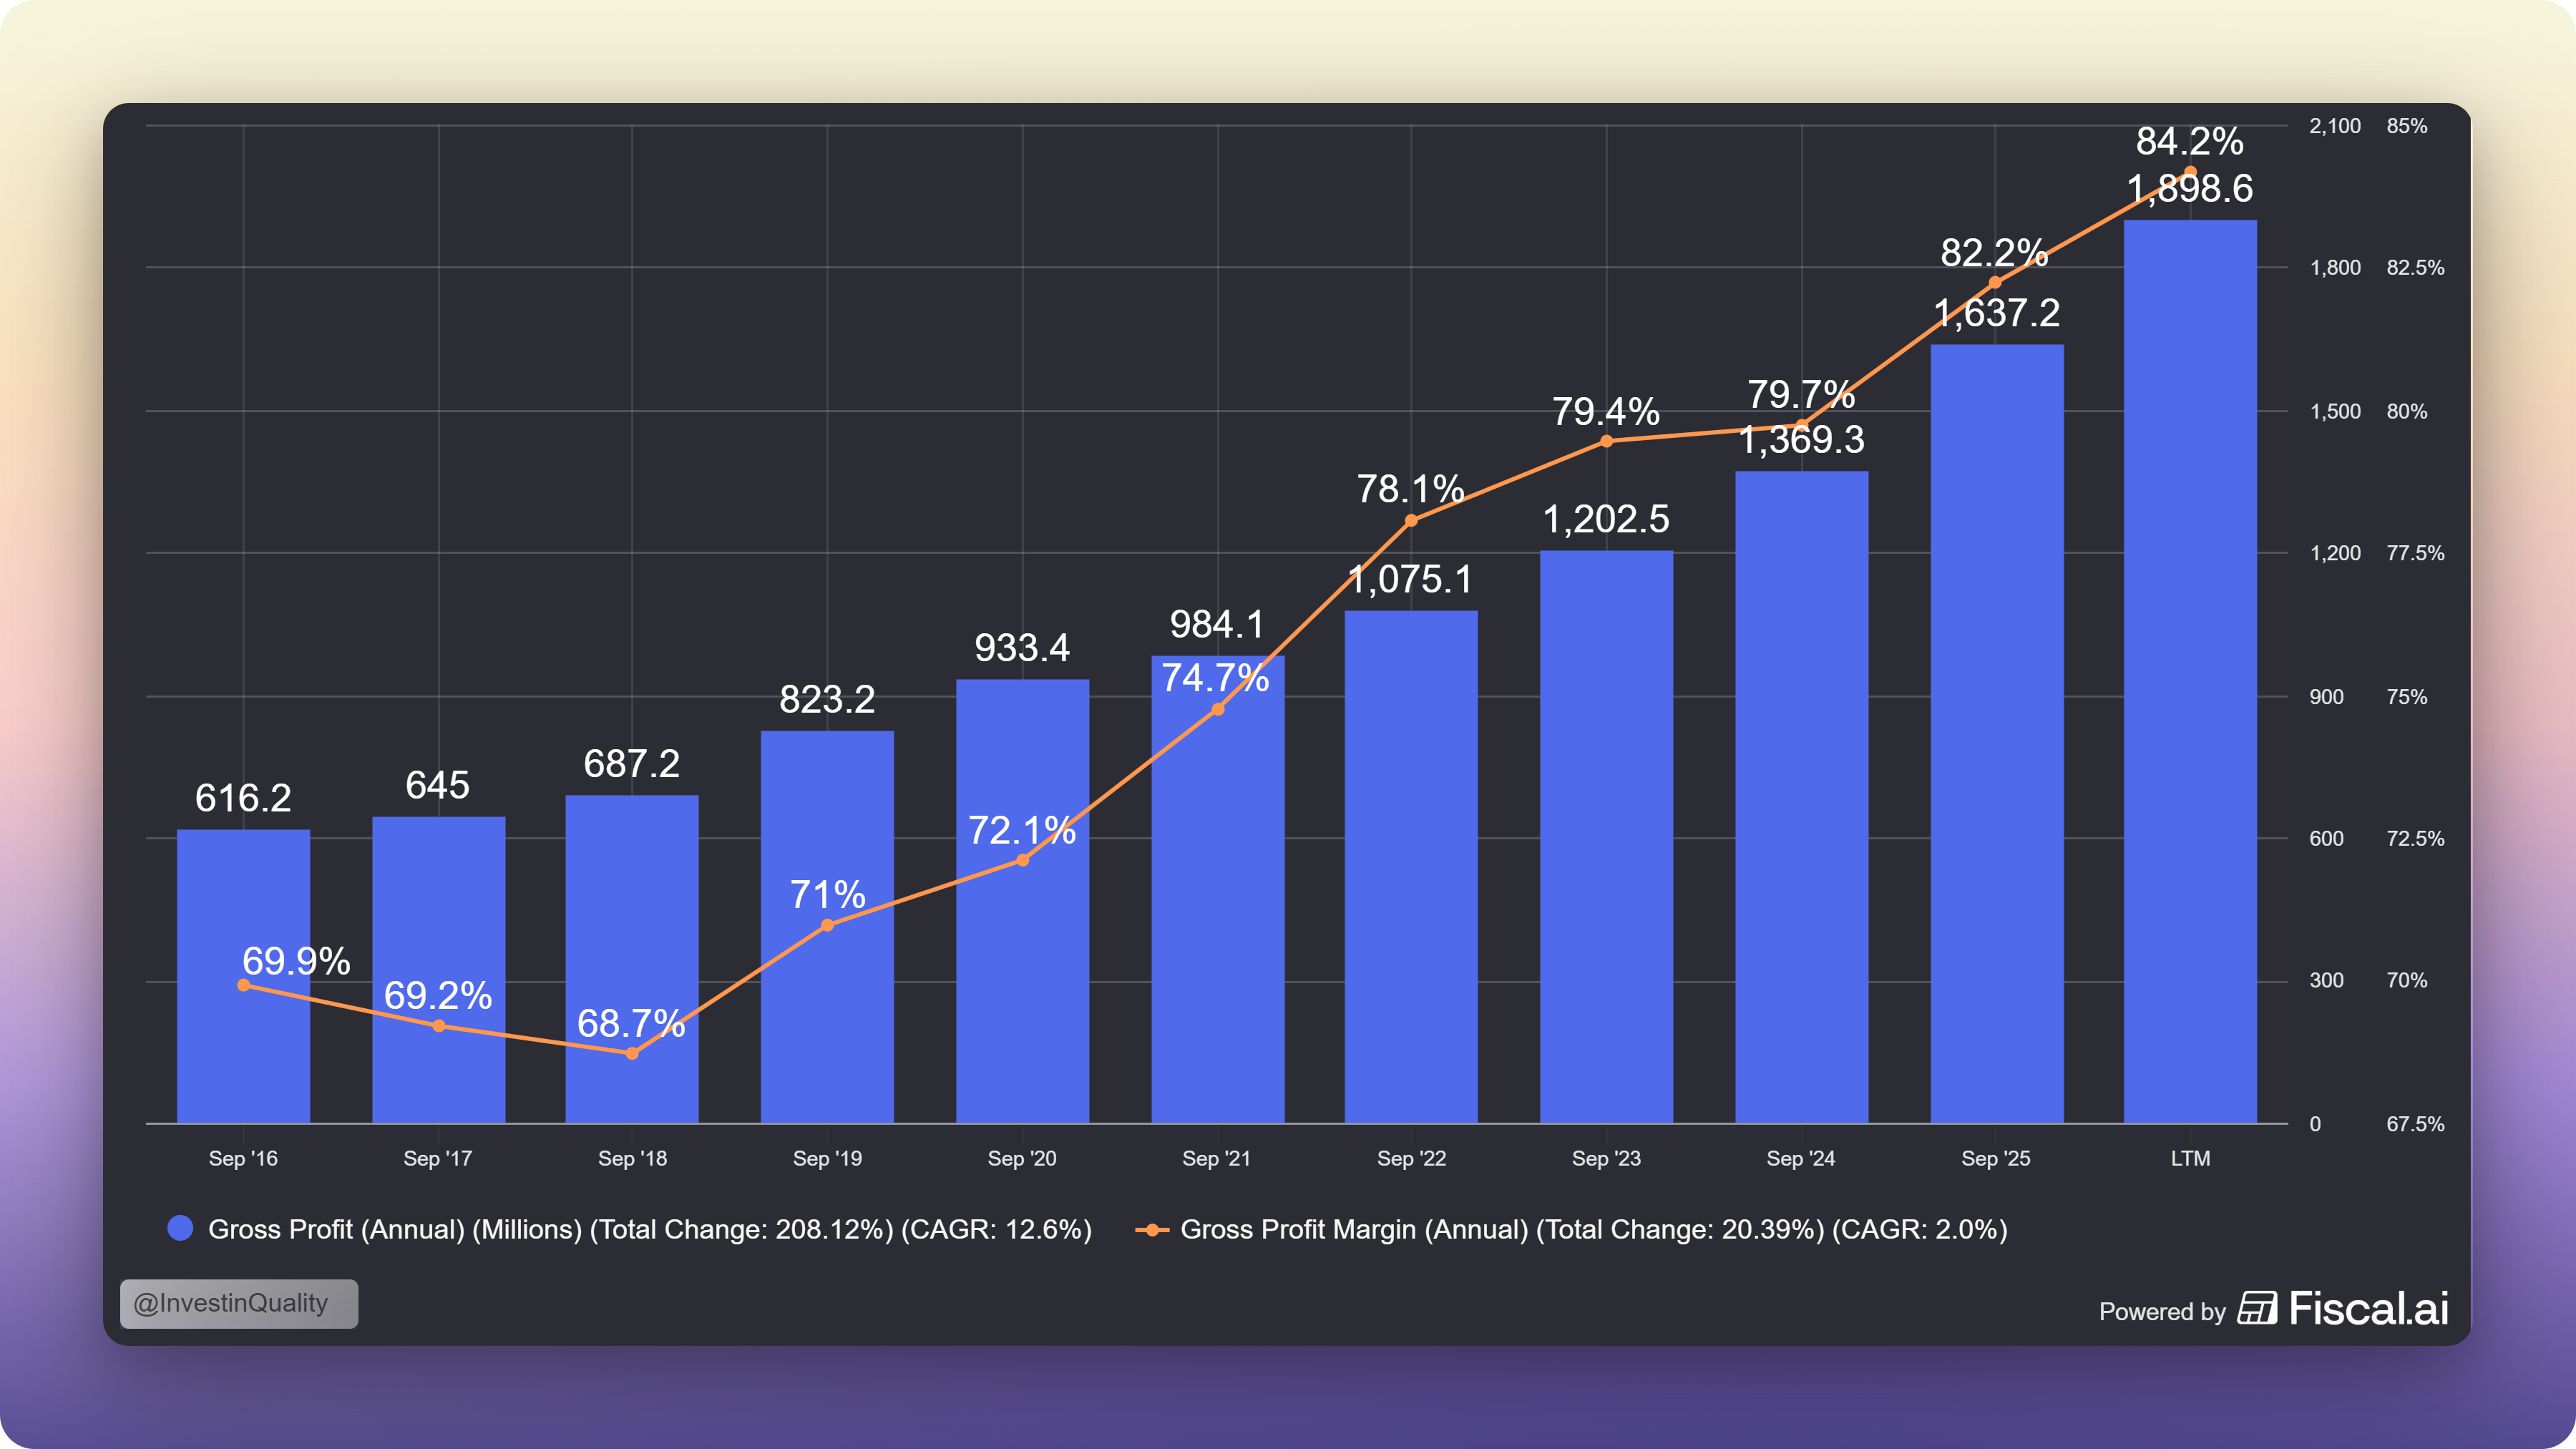
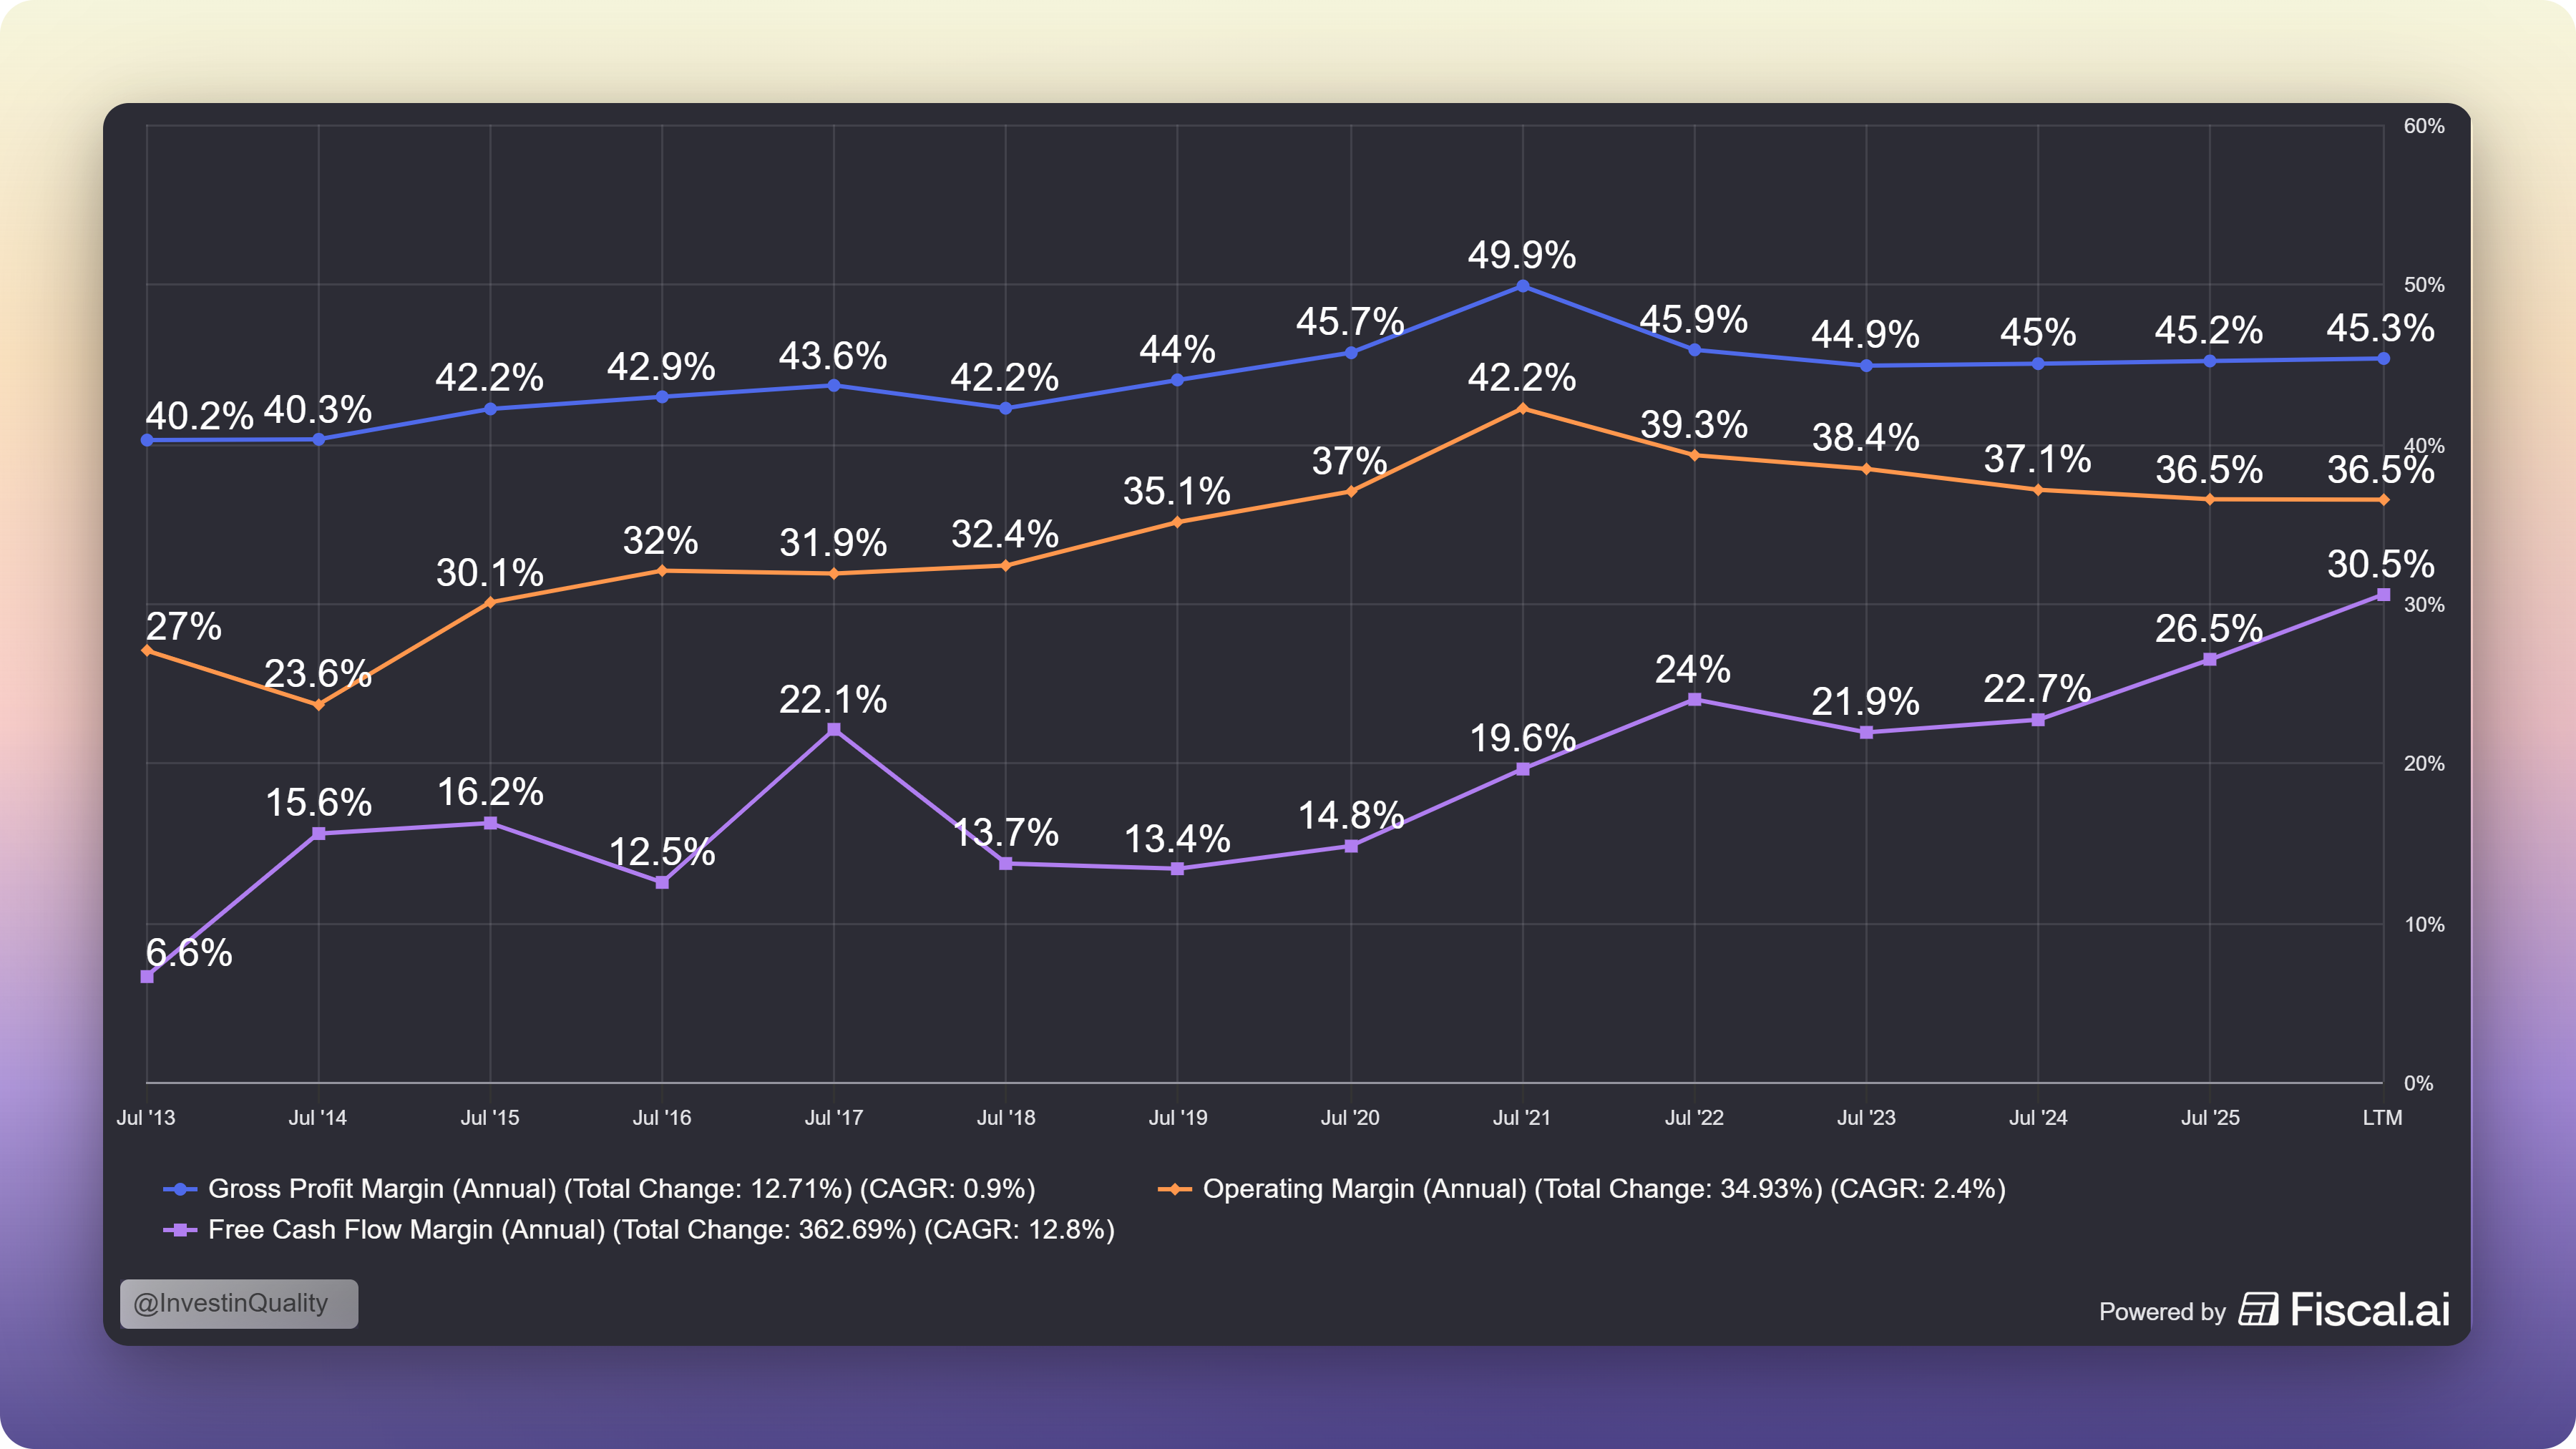
  • Nextpower makes the tracking systems and software that let utility-scale solar panels follow the sun, boosting energy yield 20–30% over fixed panels. The moat combines a low-fixed-cost outsourced manufacturing model with proprietary software that’s hard to switch away from once installed. It acquired battery maker Prevalon Energy for $365m in May 2026 to expand into data centers. ROIC is ~50%, FCF yield 3.2%, five-year revenue CAGR of 27.6%. Gross margins expanded from 10% in 2022 to 32.6% LTM, and ROIC from 9.2% to 31.5% over the same period.

Terry has historically stuck to consumer products, healthcare, and technology, so three industrials purchases in one shareholder letter is a real departure, even accounting for the data center angle on Legrand.

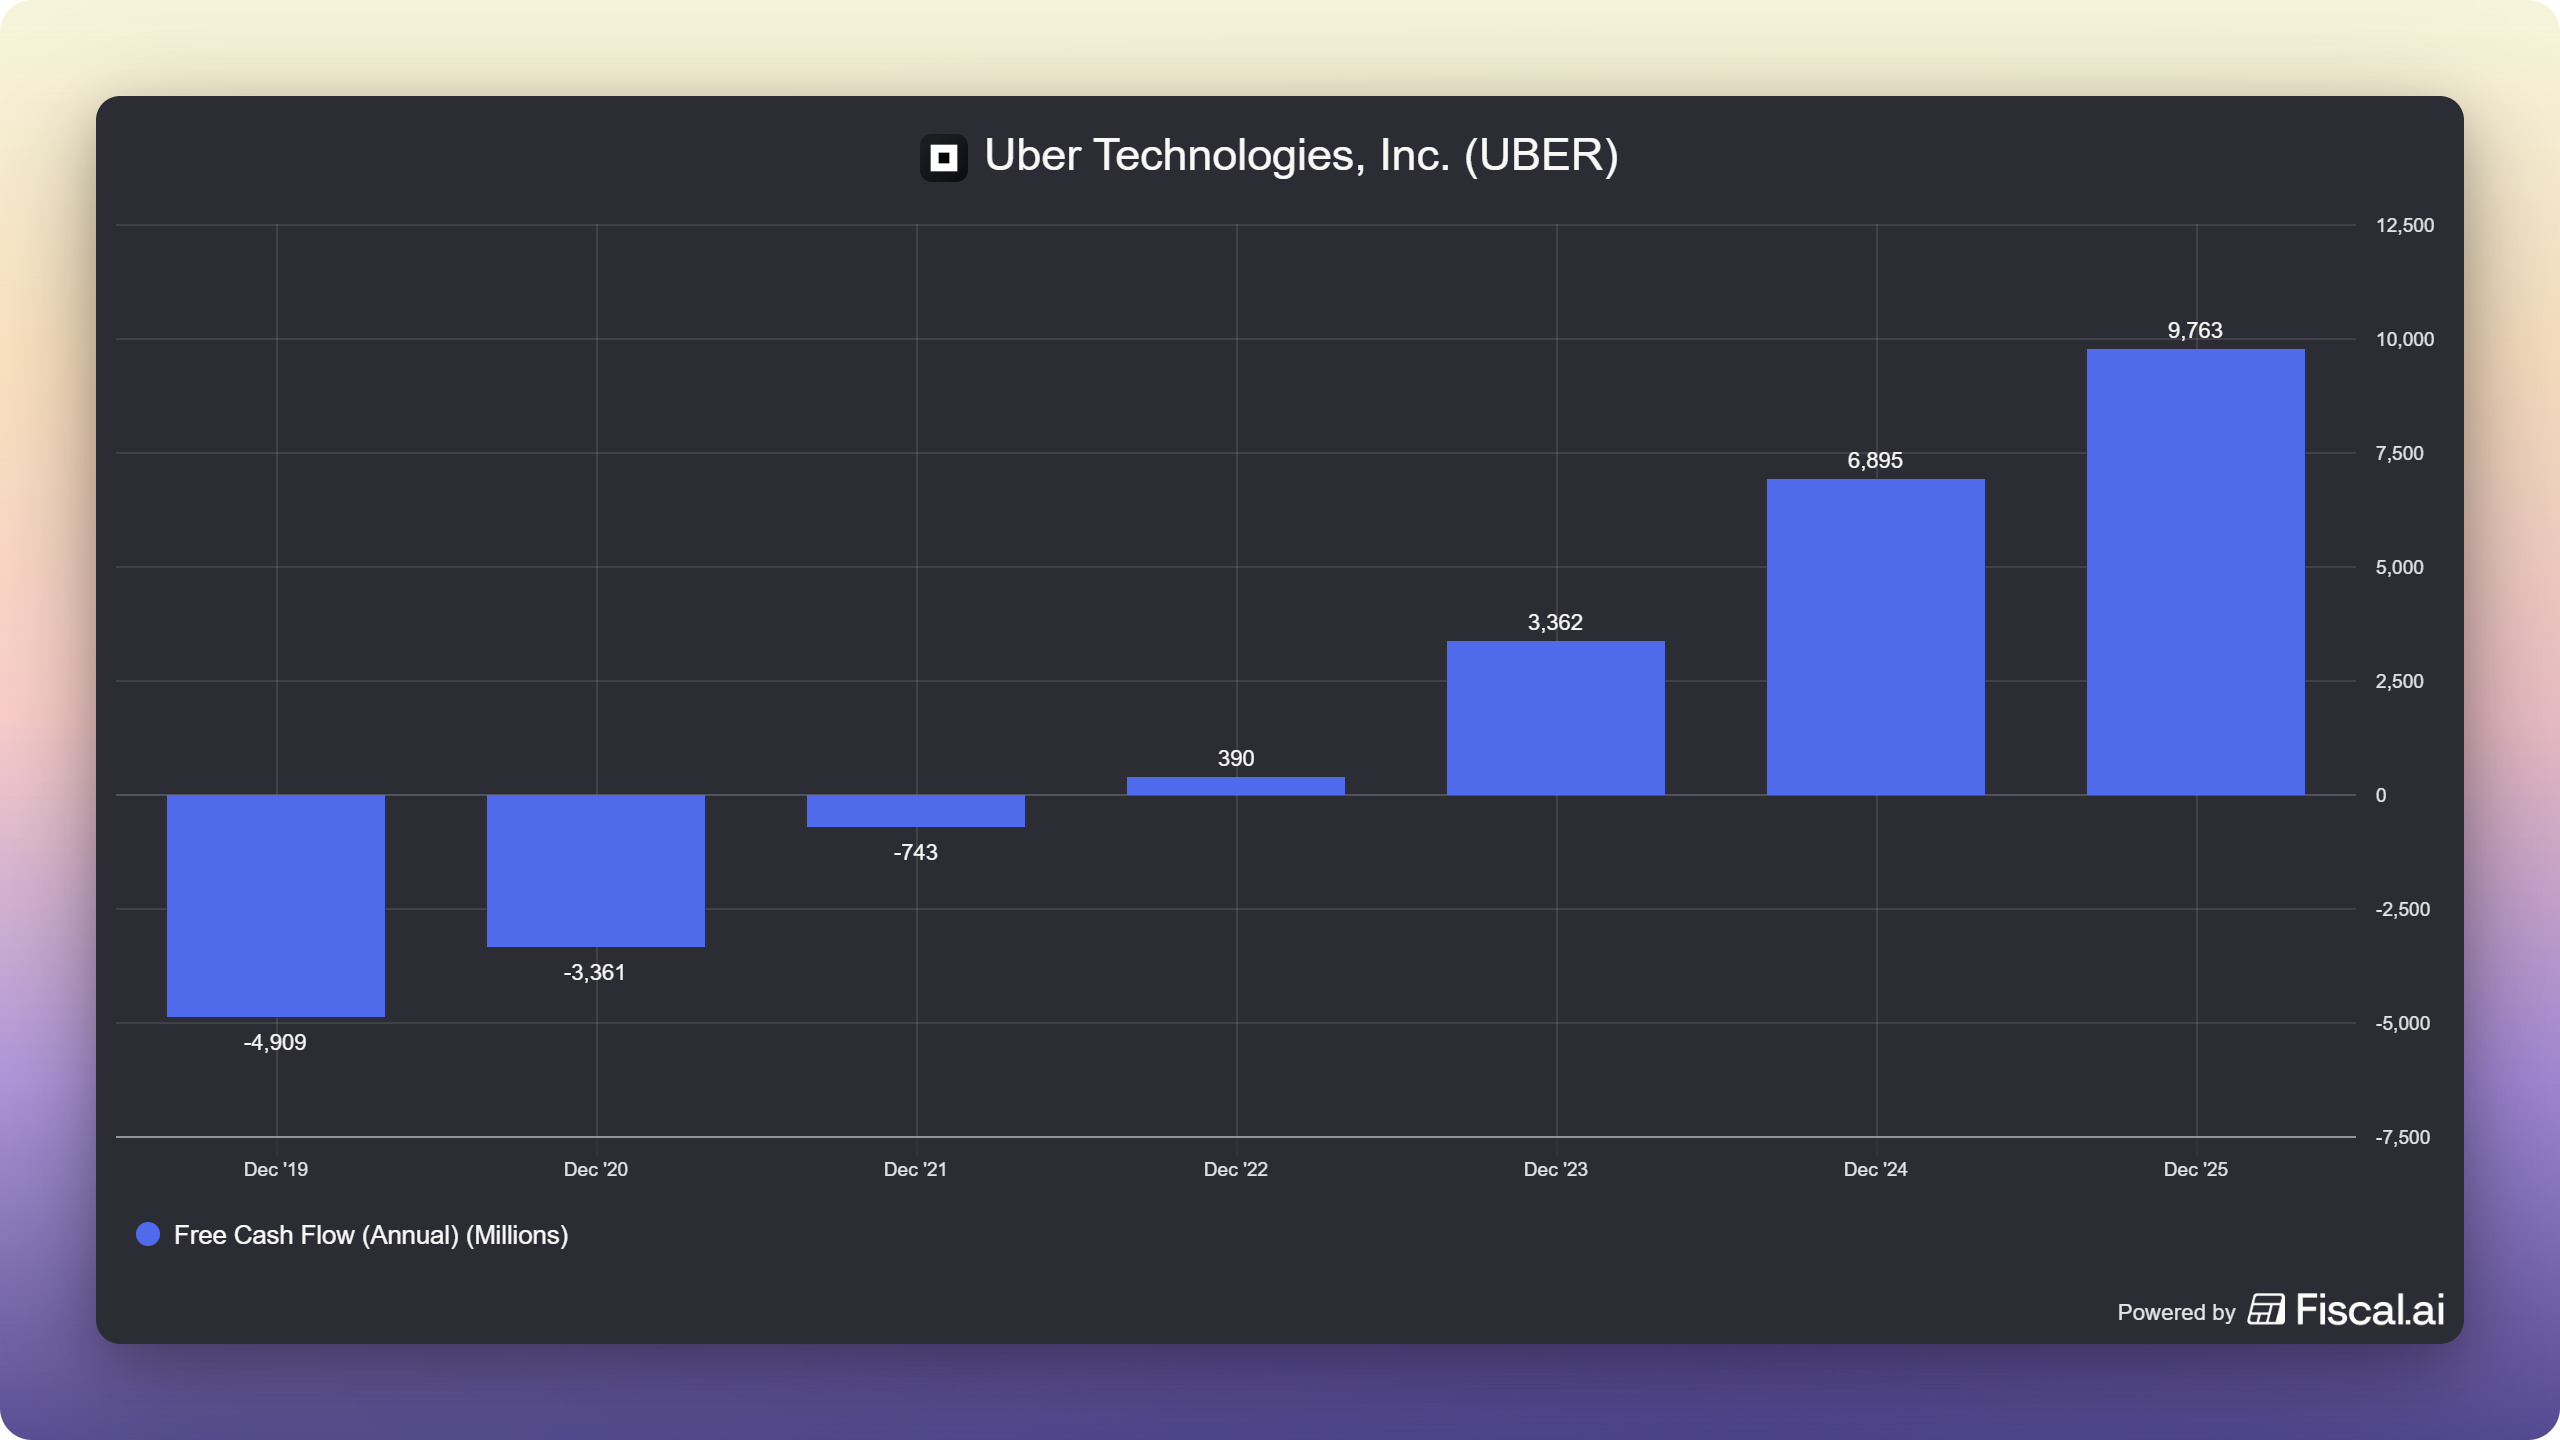
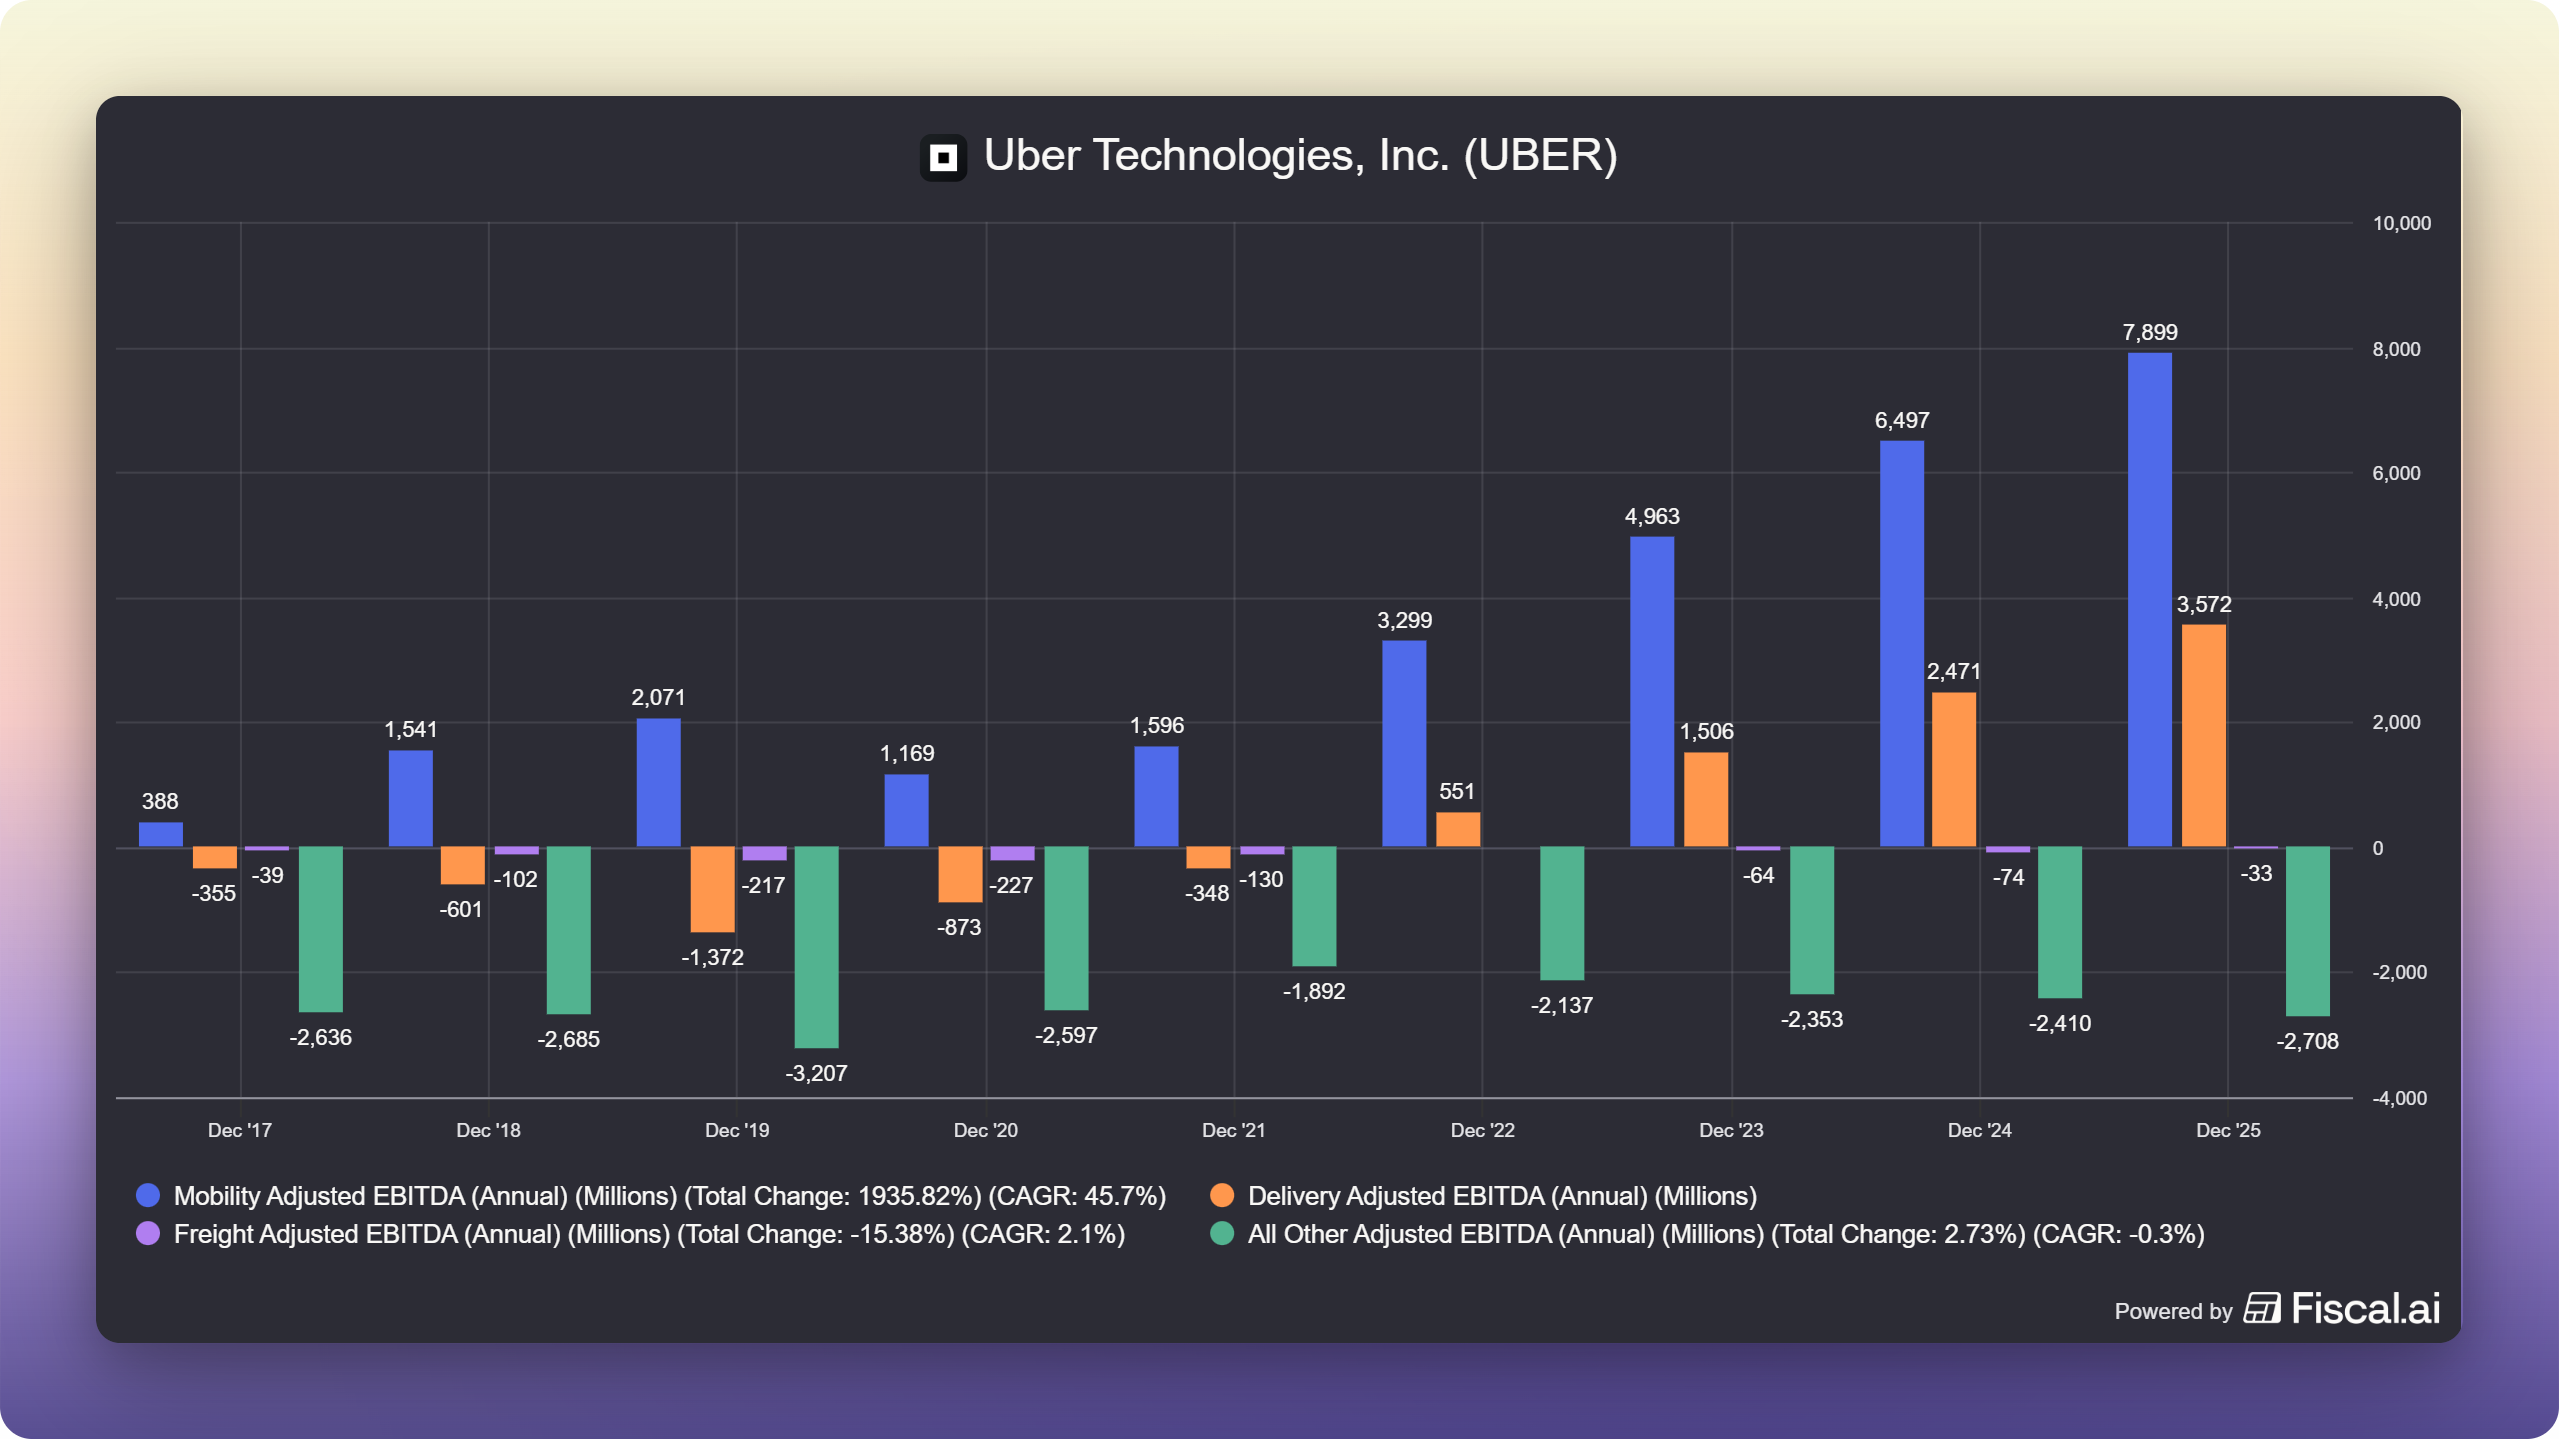
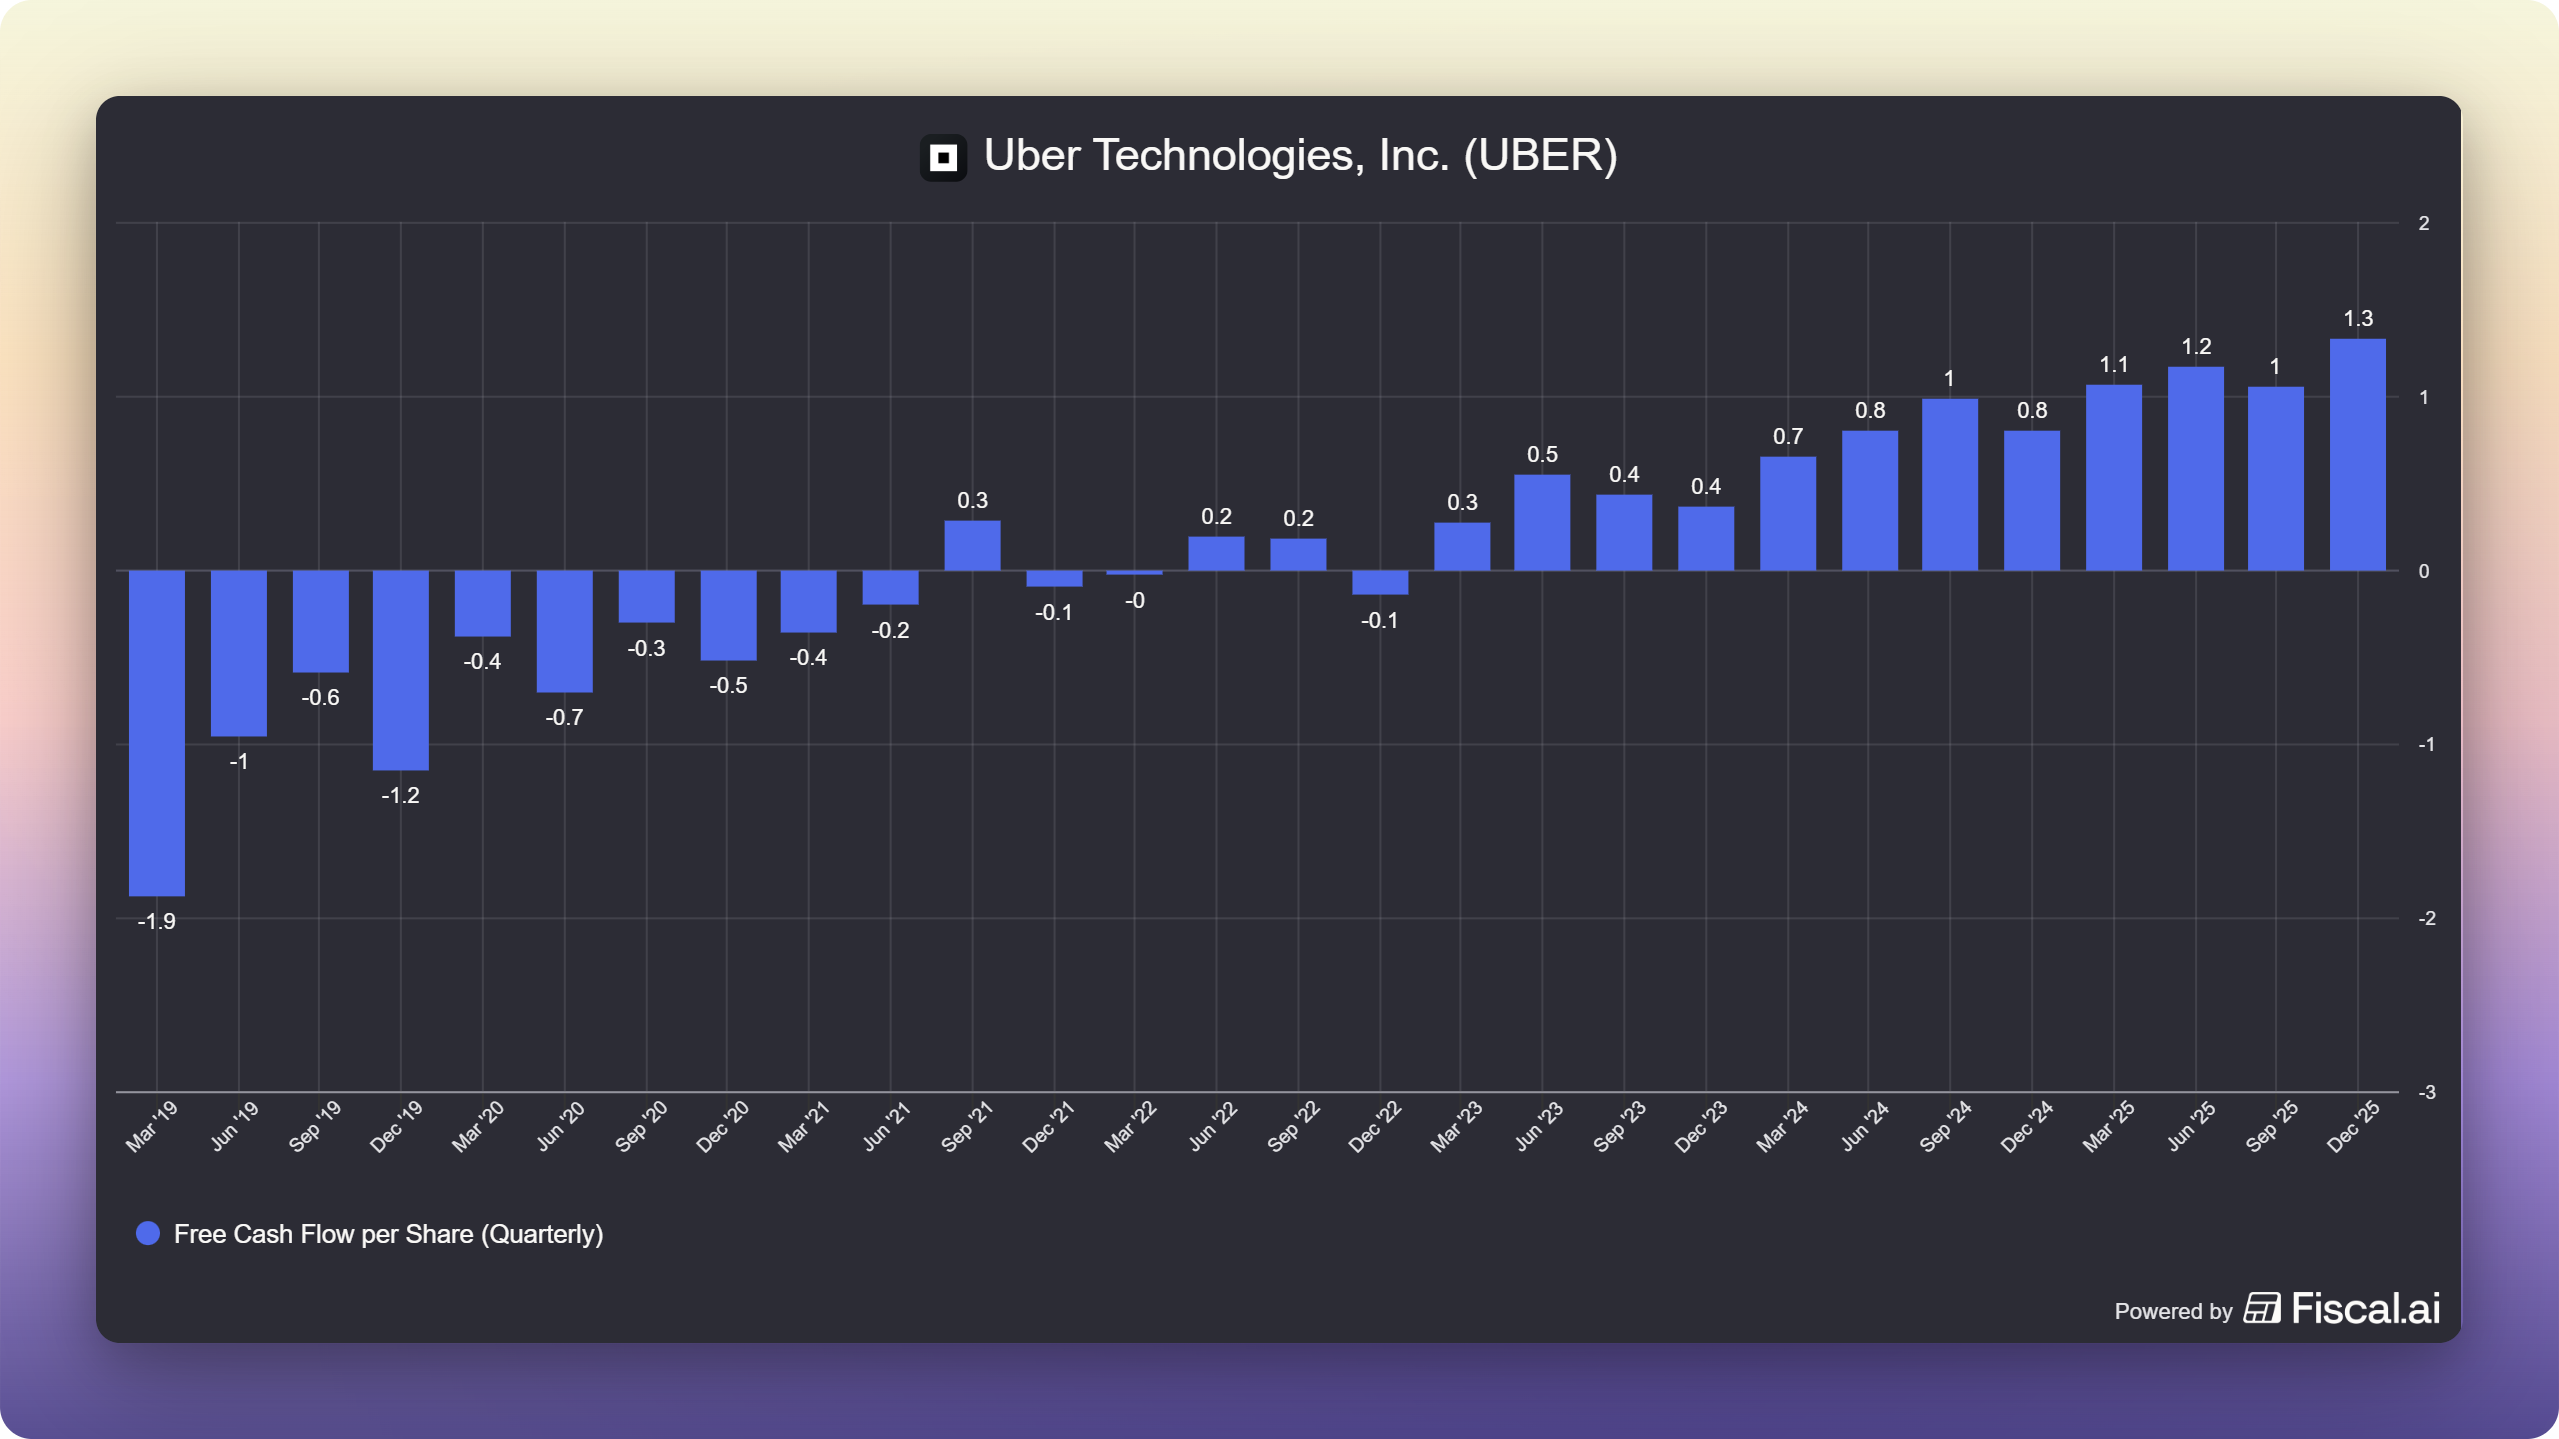
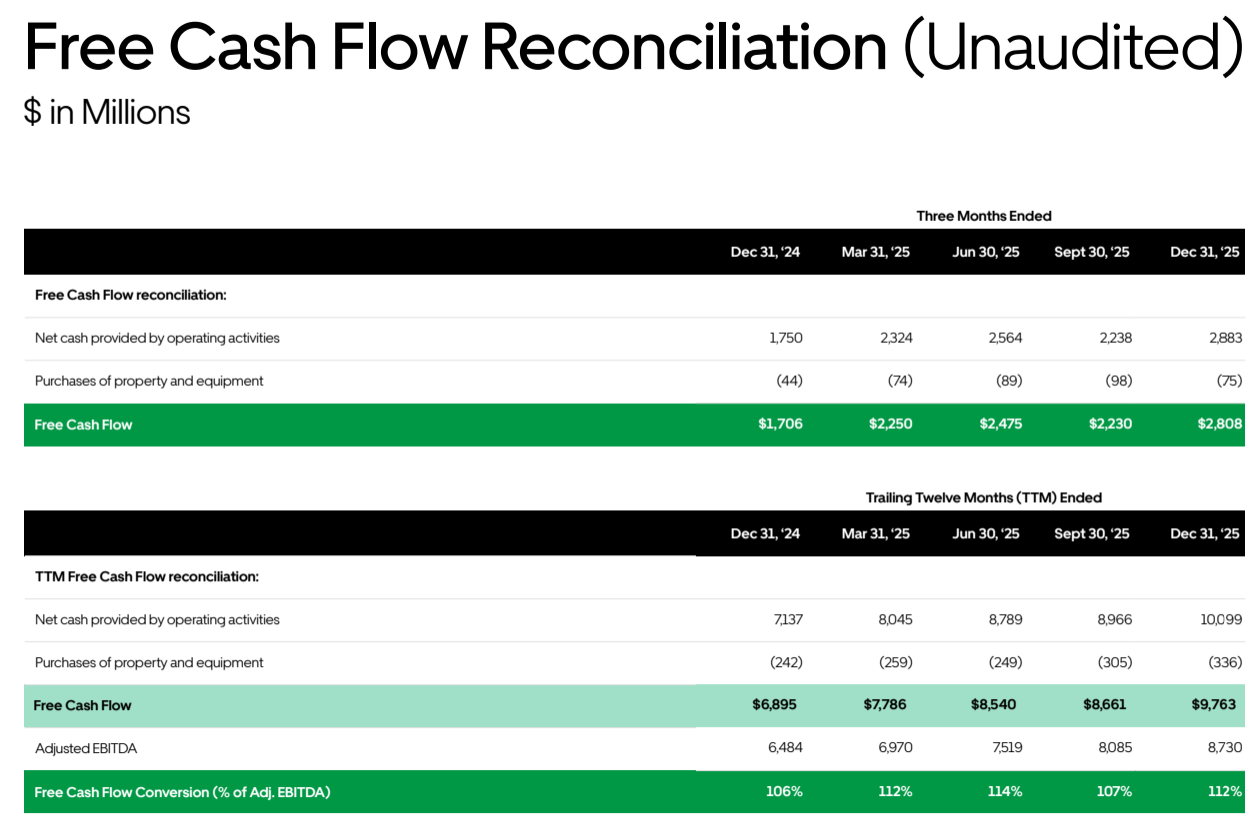
  • Uber connects riders and drivers through a two-sided network effect that gets stronger and harder to disrupt as it scales. Most of its early competitors, Karhoo, Sidecar, Juno, Fasten, Hailo, are gone. Cash from operations went from -$4.3bn in 2019 to -$445m in 2021 (its last negative year) to $3.6bn in 2023 and over $10bn in 2025. Uber now coordinates roughly 42 million trips and delivery orders a day. Future growth includes grocery and package delivery, plus eventual integration of autonomous vehicles, where Uber’s distribution and licensing likely make it a partner rather than a threat to players like Tesla and Waymo. ROIC is in the mid-20s, FCF yield 7.4%.

I like this one a lot. We wrote a deep dive on Uber a few months back with almost this exact thesis, so either Terry reads Invest in Quality, or great businesses just look the same to anyone doing the work.

Financials

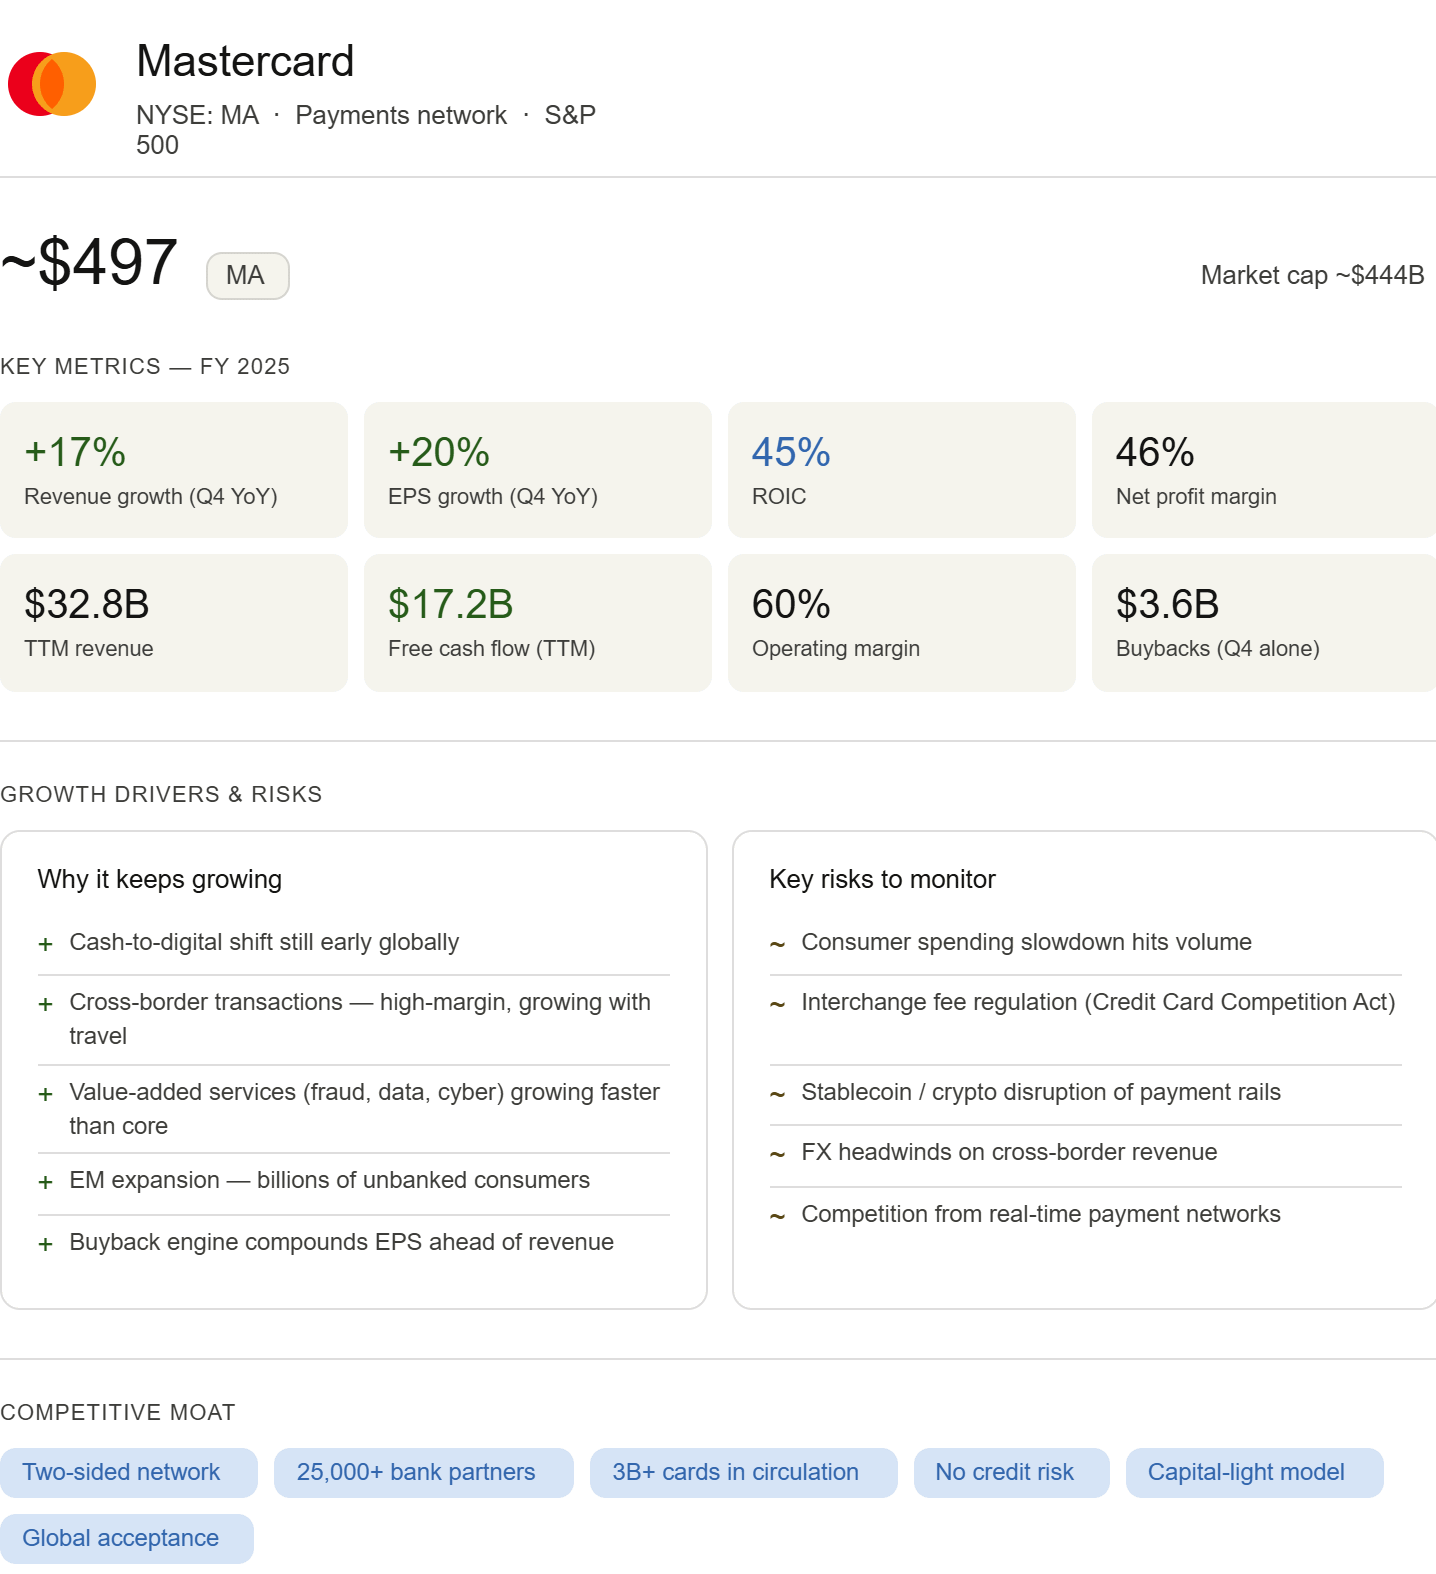
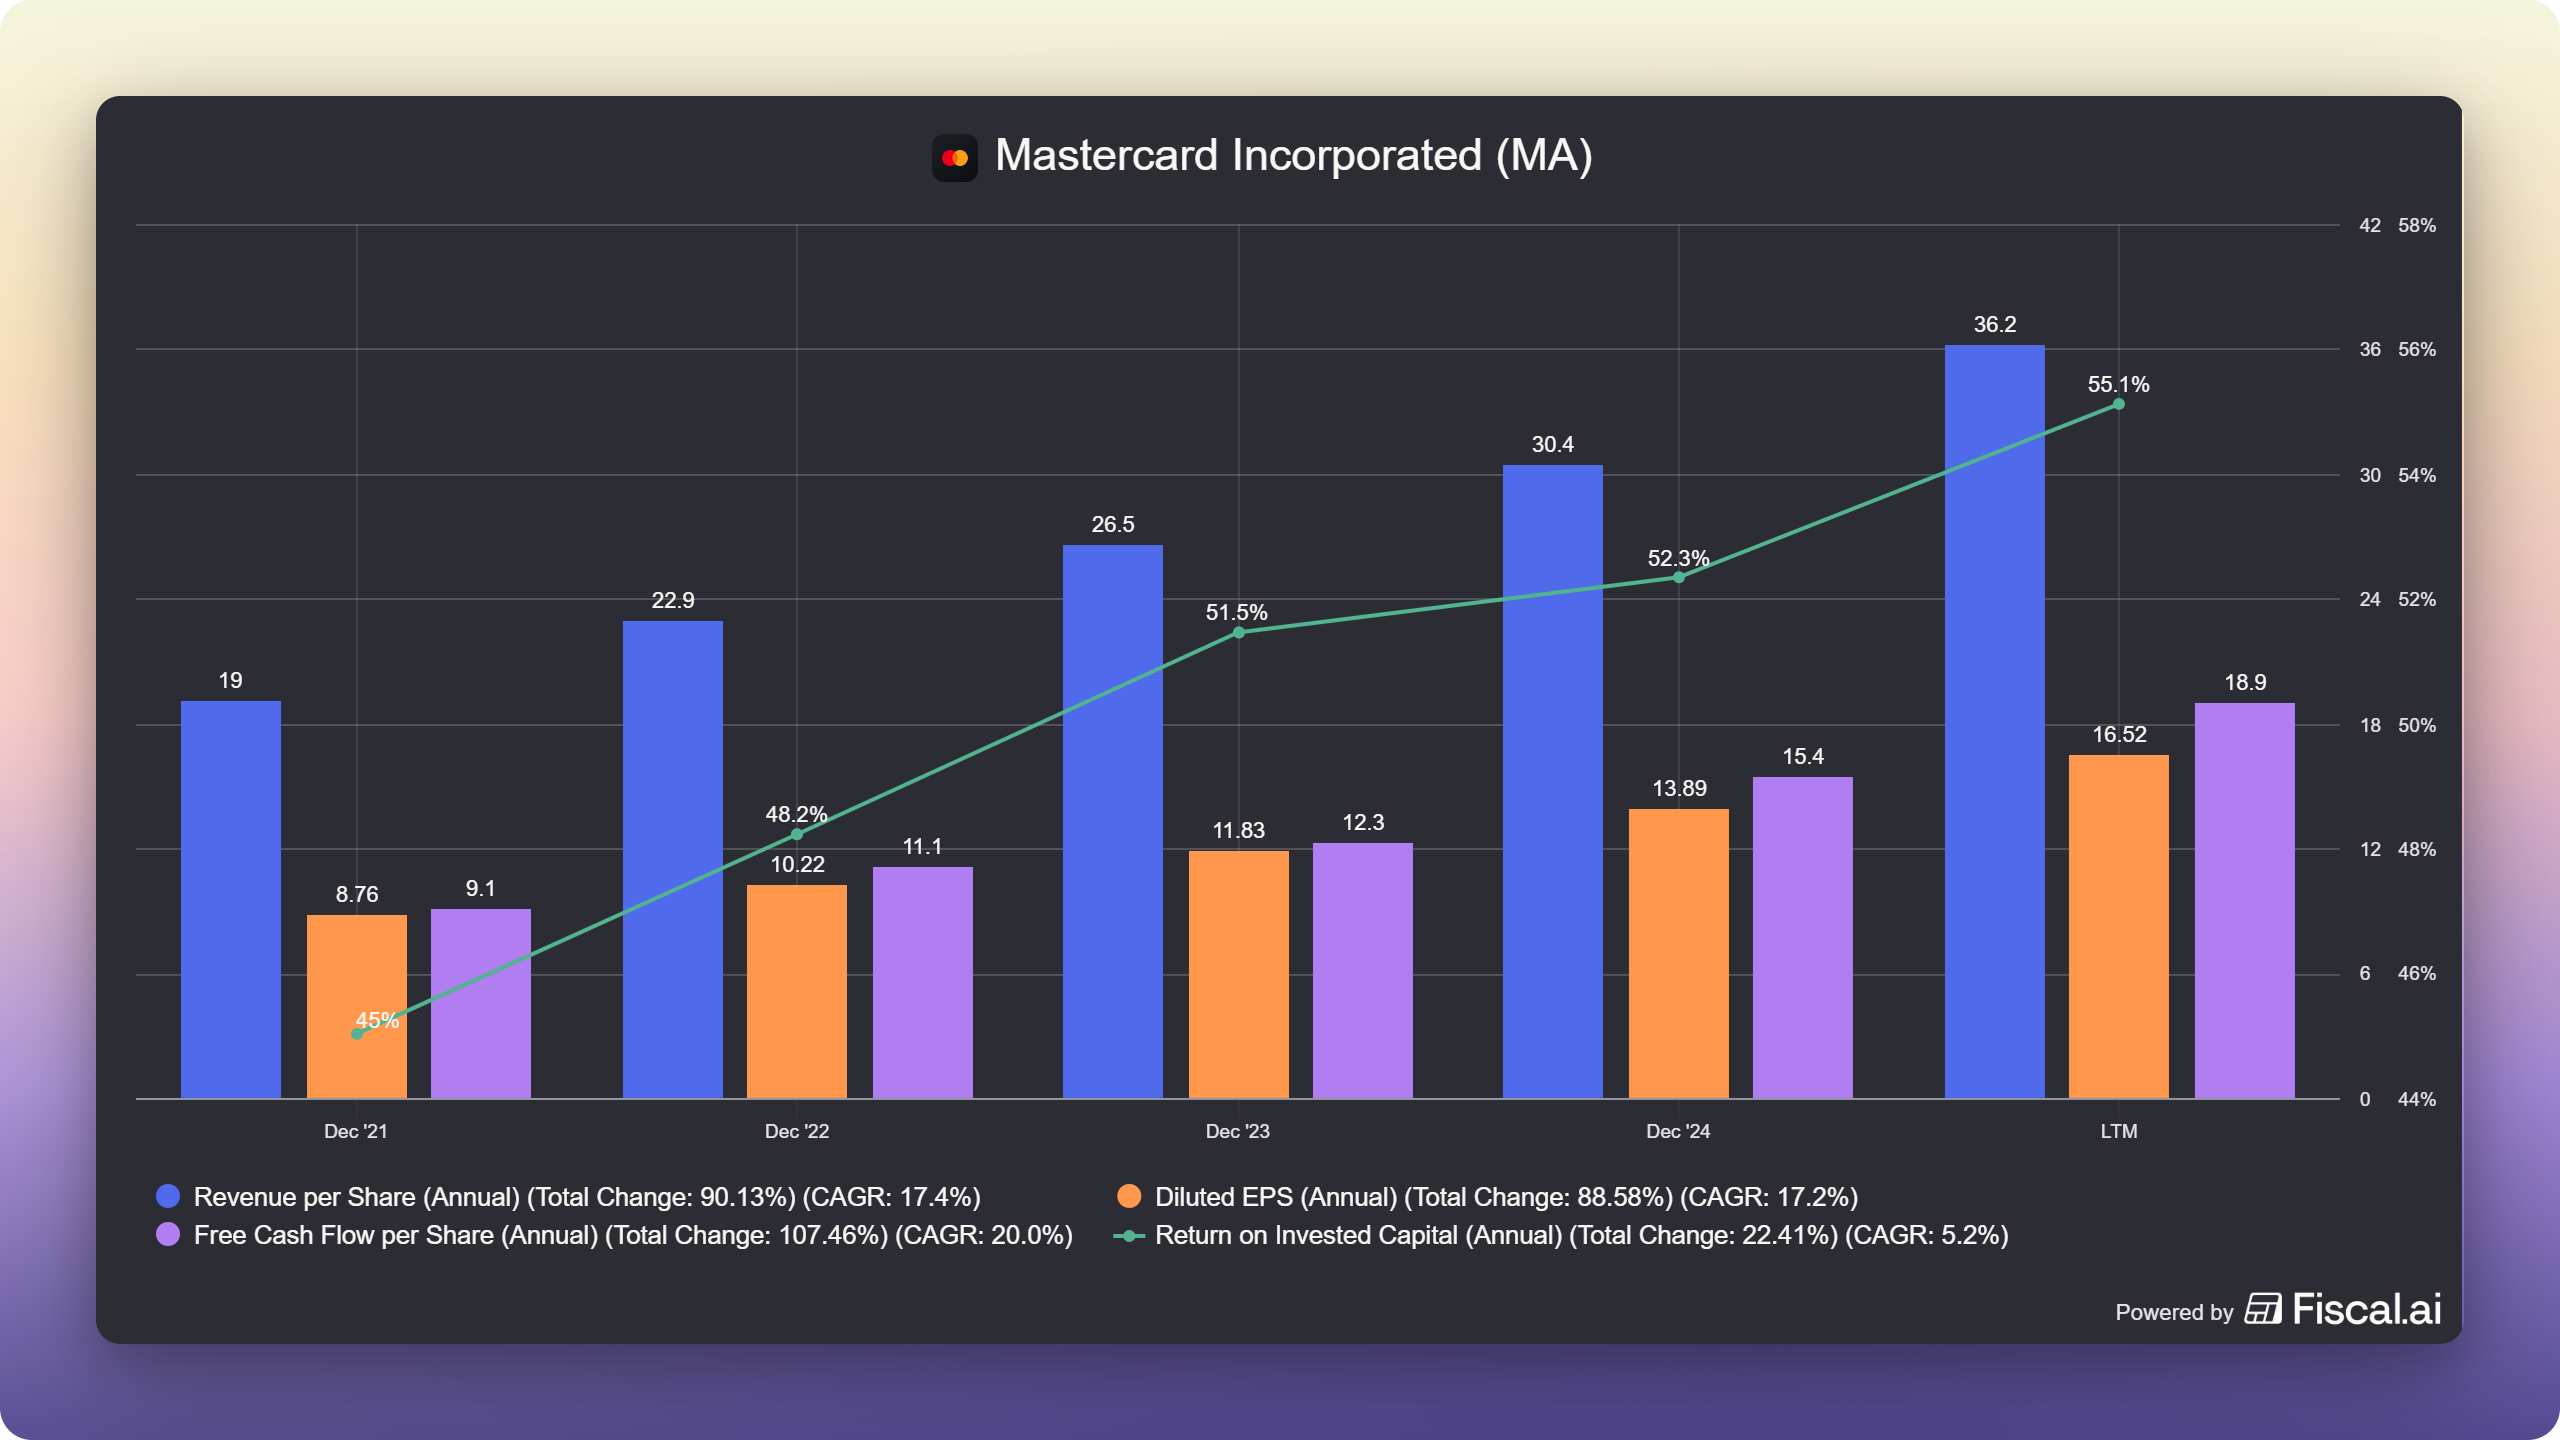
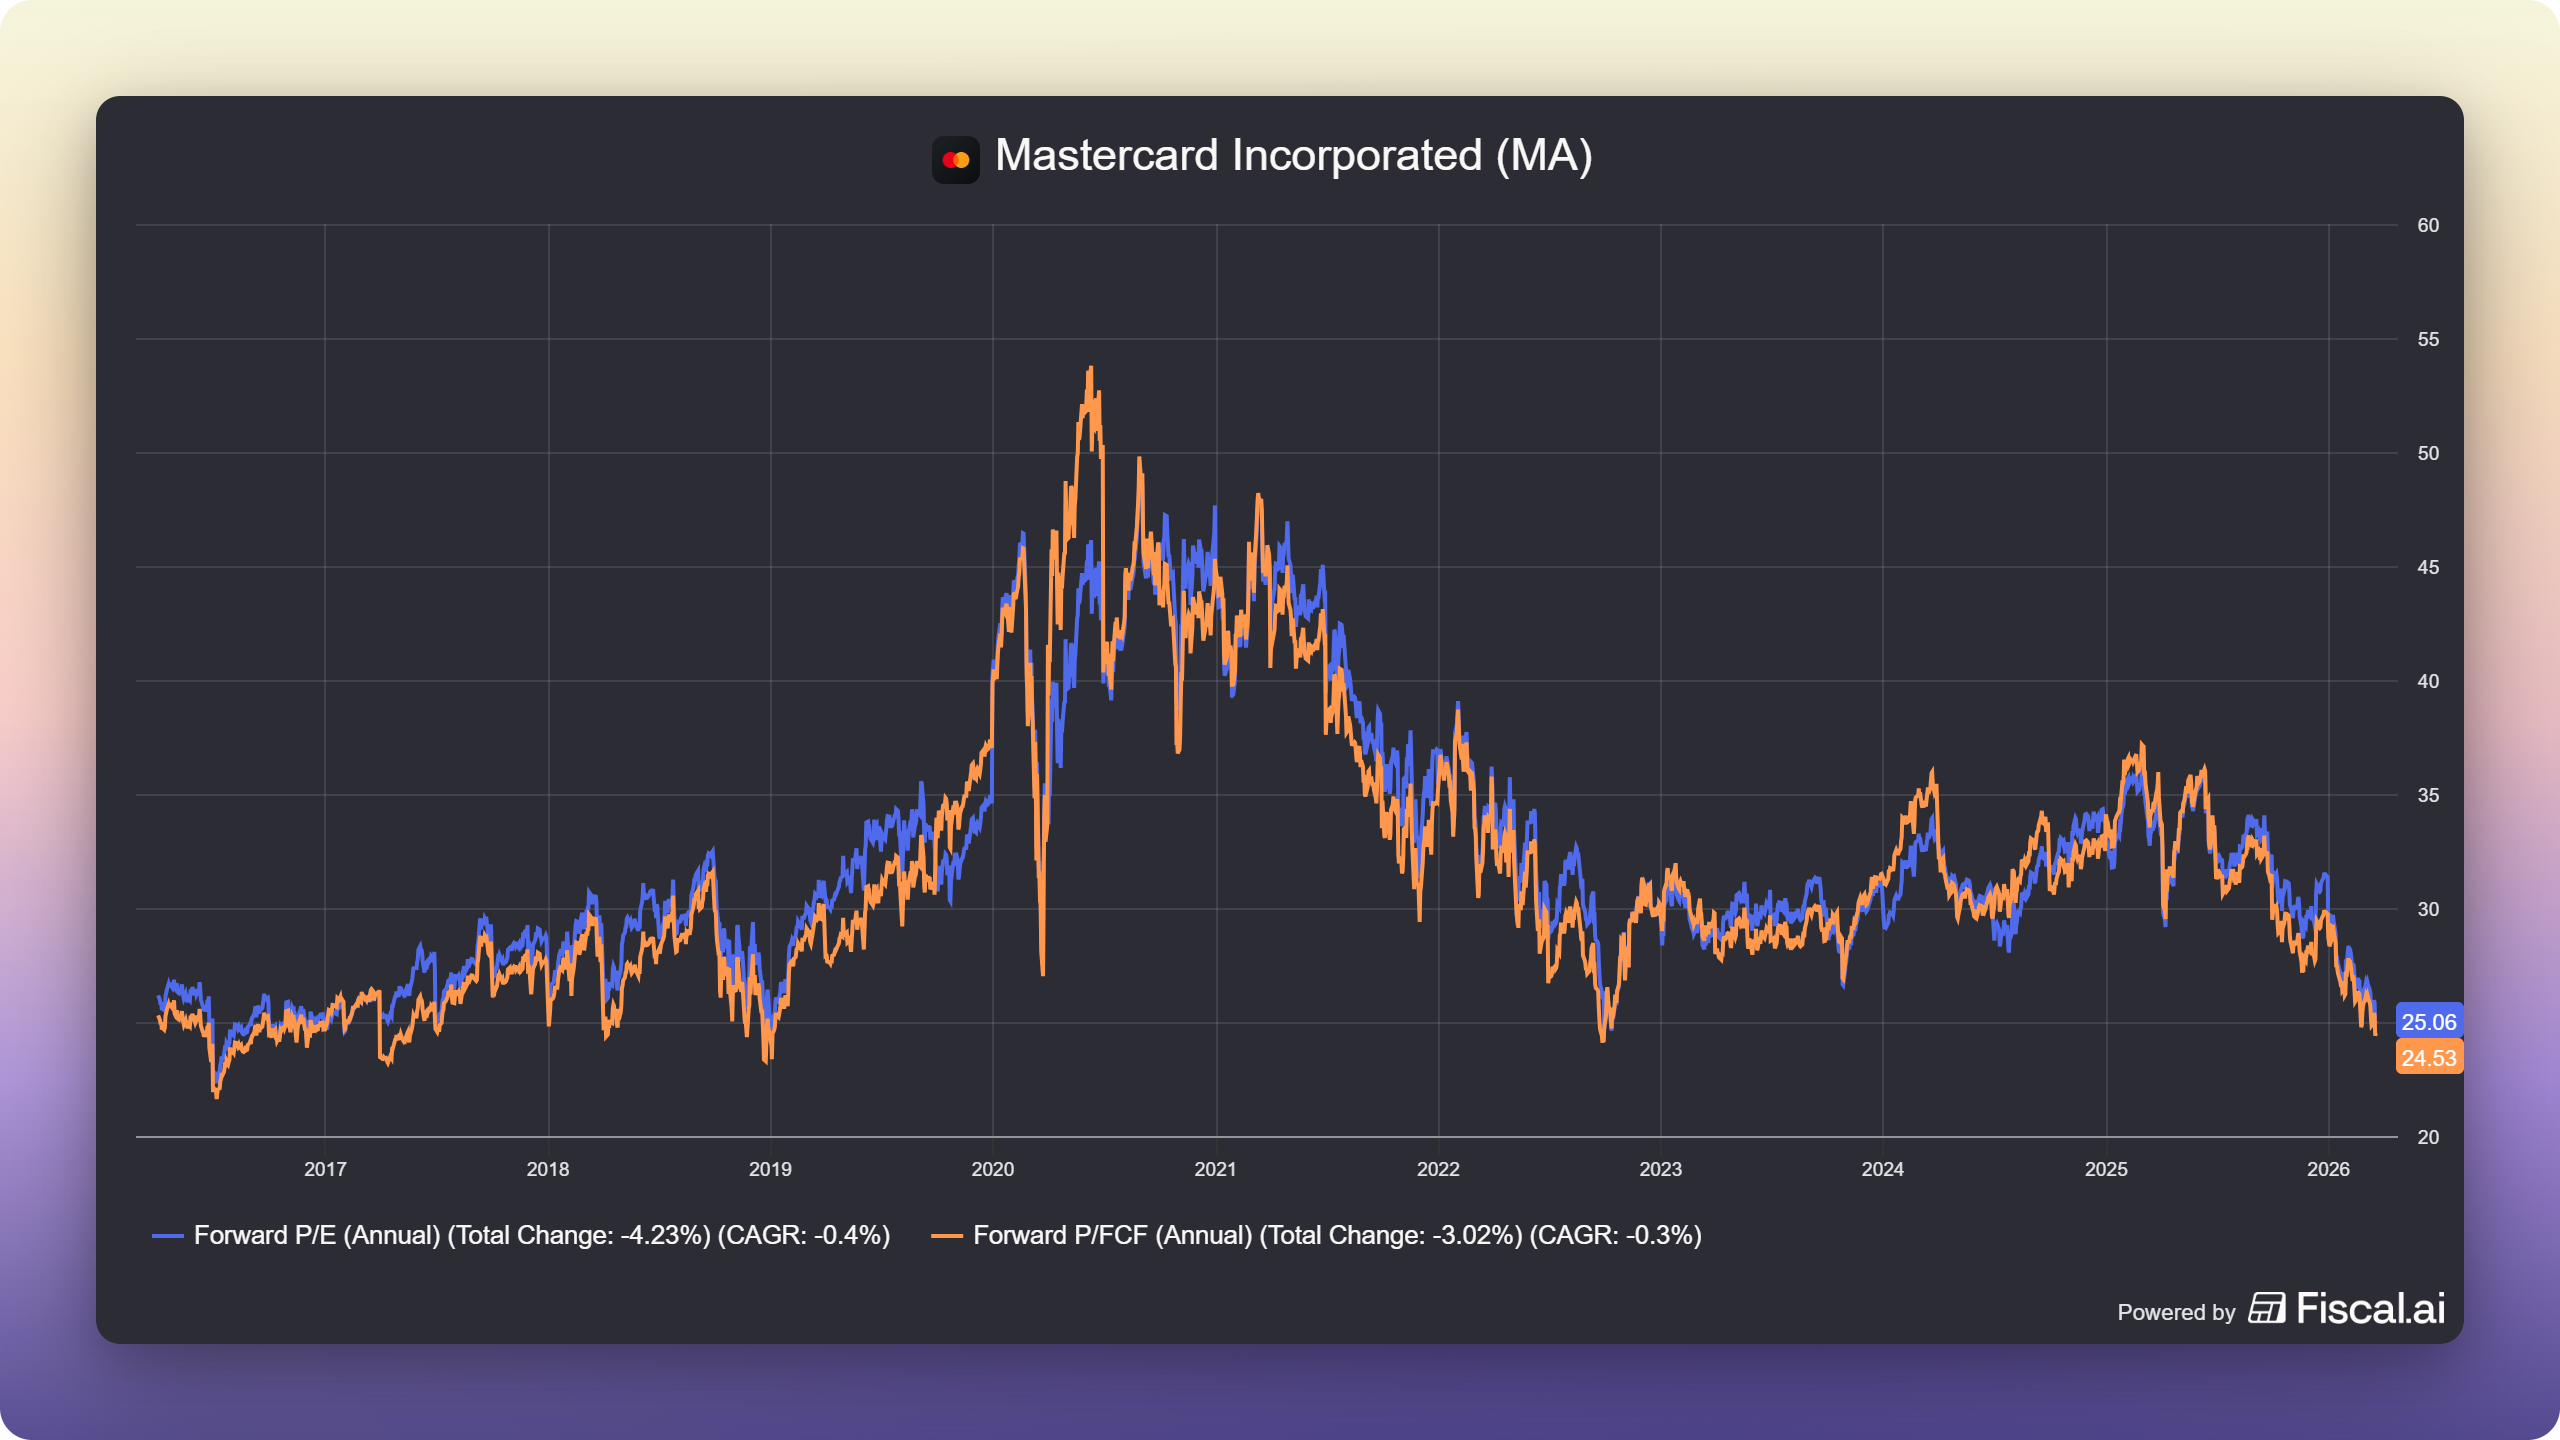
  • Mastercard: a payments network with a textbook network effect, more users force more merchant acceptance, which makes replicating it nearly impossible for a new entrant. Roughly 1.4bn adults globally remain unbanked, and 46% of global transactions are still cash, with B2B payments representing 85% of total payment value, still largely untapped. Fundsmith now owns both Visa and Mastercard, giving it over 6% payments exposure without concentrating single-stock risk. ROIC exceeds 75%, FCF yield 4.5%, and the stock is trading at its best valuation in a long time.

Health care

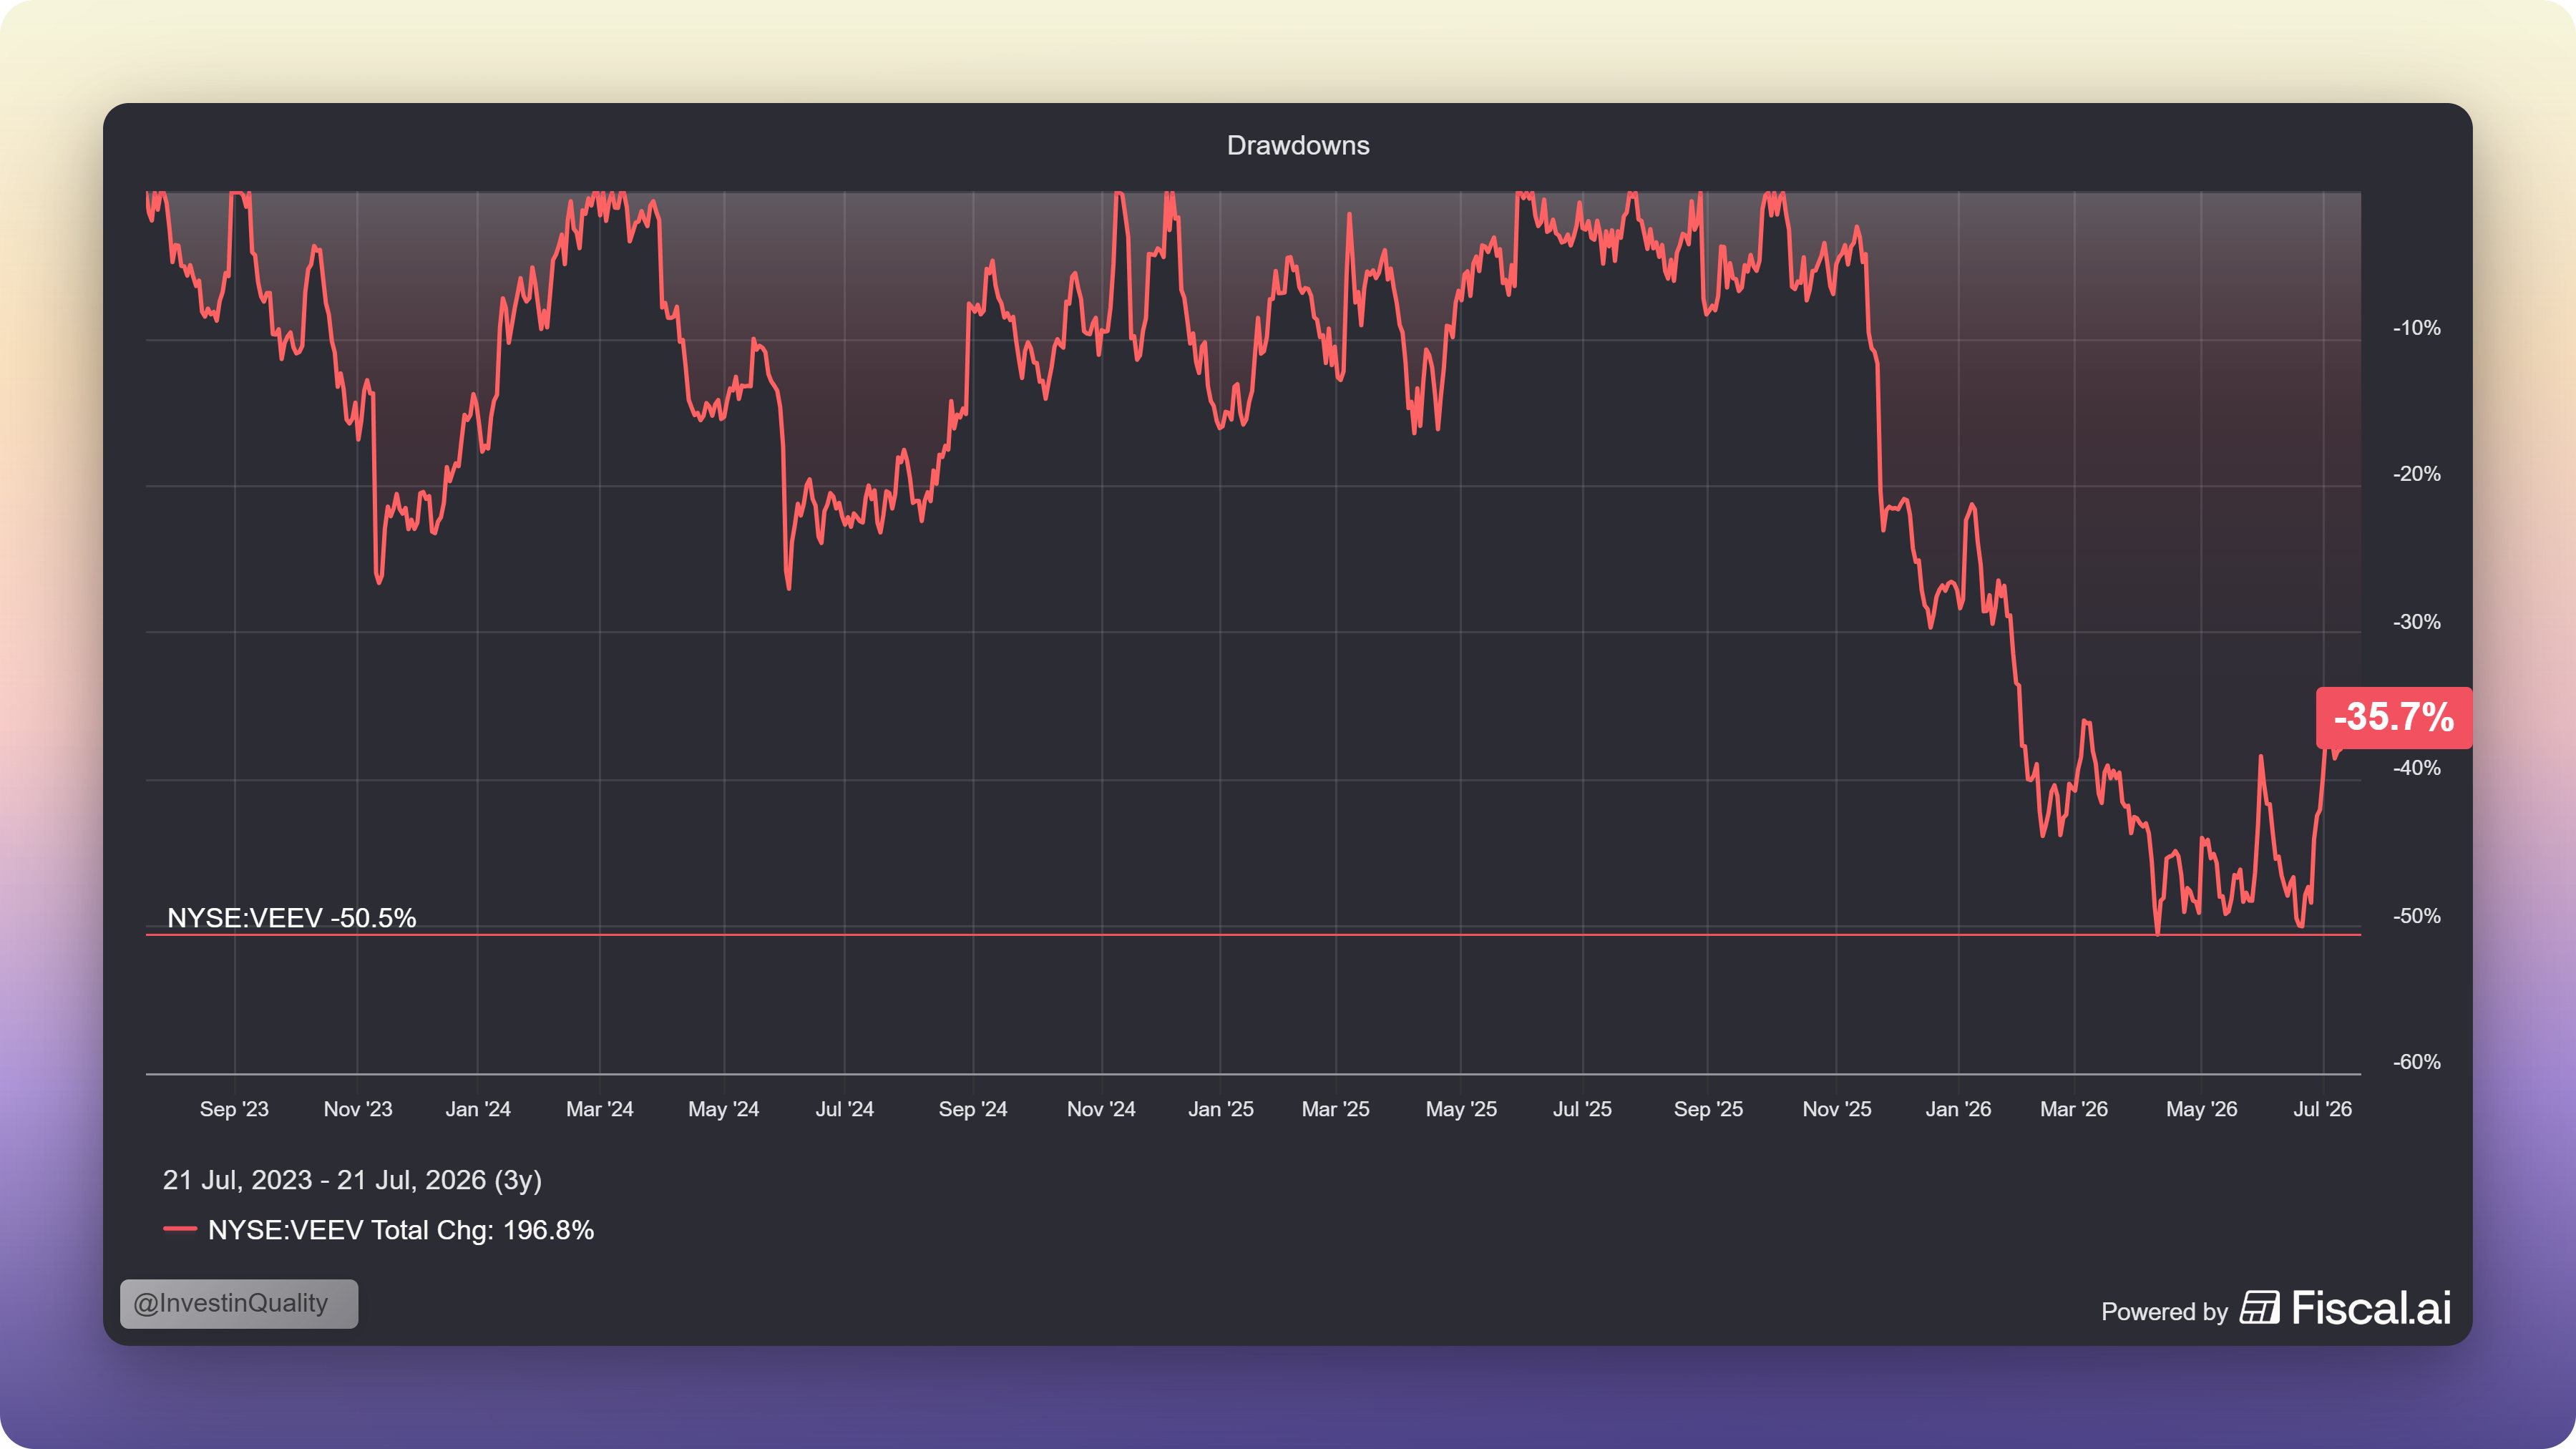
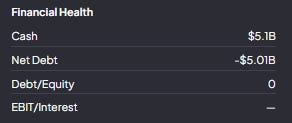
  • Veeva Systems builds cloud software that tracks a drug’s entire lifecycle, from clinical trials through manufacturing and sales, for the pharma and life sciences industry. Its moat is extremely high switching costs: once a drug company builds Veeva into its regulatory and trial infrastructure, ripping it out risks halting trials or manufacturing entirely. Veeva holds roughly 80% market share in pharma CRM software. Headline ROIC is ~15%, but that’s dragged down by a large cash balance; excluding cash it’s well over 100%. FCF yield is 5.7%. The stock is down 45.3% from its highs on “AI will eat software” fears, but Veeva sits in a highly regulated market where getting the software wrong is far more costly than any savings from switching, which limits AI disruption risk. Net debt is -$7.2bn and expected EPS growth is 21.5%. This looks like a legitimate rebound candidate.

Technology

  • AppLovin provides the AI ad-matching engine (AXON) behind mobile app advertising, the unskippable ad between levels in a game like Candy Crush. AXON’s network effect makes it hard for either advertisers or app developers to leave once they’re matched effectively, and it can likely grow revenue 20% annually just from improving targeting. AppLovin serves over 1bn daily active users and generates more ad revenue than Snap, Pinterest, Reddit, and X combined. Unlike Alphabet or Meta, which charge per impression or click, AppLovin takes a cut of the transaction itself, so it earns more from high-value purchases than from a $5 game download. ROIC exceeds 100%, FCF yield 3.6%, gross margins 88.4%, five-year average ROIC 32.3%, trading at 35.6x trailing / 23.9x forward earnings with ~30% expected EPS growth. The moat here is narrower than Terry’s usual holdings, but the fundamentals are excellent.

  • Sage: swapped in for Intuit, Sage competes directly in accounting software with less reliance on stock-based comp, a lower valuation, and none of Intuit’s history of value-destroying acquisitions. ROIC 18%, FCF yield 6.0%, 15.4x forward PE, 13.6% expected EPS growth. A fair-value business bought for good reasons.

  • TSMC manufactures roughly 90% of the world’s most advanced semiconductors, the ones inside chips designed by Apple, Broadcom, and Nvidia. Its moat is a technological lead protected by a capital barrier: it costs roughly $20bn to build one advanced fab. ROIC 33%, FCF yield 2.7%, 19.4x forward PE, ~30% expected EPS growth. What’s notable isn’t the business quality, it’s that Terry is now willing to underwrite Taiwan geopolitical risk, something he’s historically avoided entirely.

Consumer discretionary

  • The TJX Companies, parent of TJ Maxx and Marshalls, runs an agile off-price supply chain built on decades-long relationships with premium brands, buying excess inventory at steep discounts through a network of 1,400+ buyers sourcing from 21,000 vendors. Growth comes from store expansion and share gains from department stores. ROIC 33%, FCF yield 3.1%, but at a 30.2x trailing / 29.4x forward PE against only ~8.6% expected growth, this one looks like a step back toward the expensive-and-slow pattern Terry is supposedly moving away from.

  • Yum! Brands, parent of KFC, Taco Bell, and Pizza Hut (which it’s finally divesting after it dragged on results), opens a new restaurant somewhere in the world roughly every two hours, every day of the year. Growth depends on continued franchise expansion in emerging markets and better digital ordering, with near-term upside in a currently underperforming US KFC business and Taco Bell’s international expansion. ROIC 50%, FCF yield 4.0%, 23.8x trailing / 21.6x forward PE, 11.7% expected growth. Solid, capital-light, high-ROIC business. Not a screaming buy, but a reasonable one.

Communication services

  • Netflix, the pioneer of subscription streaming, funds a $17bn+ annual content budget that smaller rivals can’t match without losing money, and now accounts for nearly 8% of all US television screen time, more than any single broadcast network. Its ad-supported tier has 250 million monthly active users (45% US-based), and cracking down on password sharing added 41 million subscribers after 2024. It’s also pushing into live sports, including NFL games on Christmas Day and high-profile boxing events. Rivals like Hulu, Discovery+, Tubi, and HBO Max have largely failed or lost share, strengthening Netflix’s position and creating room to win back lapsed subscribers. ROIC exceeds 30%, FCF yield 3.8%, trading at 21.7x trailing / 20x forward earnings with 20.9% expected growth, despite the stock compounding at only 6% CAGR over the past five years.

This is one of the stronger purchases in the letter. Clear market leadership, obvious growth drivers, real pricing power, and a valuation that hasn’t run away from the fundamentals.

Get 40% off forever

Has Terry lost his mind?

I don’t think so, and here’s my honest read on why he’s doing this now.

Terry has repeatedly called both index investing and momentum investing a bubble.

Now he’s tilting into the exact style he was criticizing months ago. That looks bad on the surface. But Fundsmith’s assets under management have fallen from a peak of £29 billion to roughly £12.2 billion, a 58% decline, largely lost to index funds, his biggest competitor.

When you’re bleeding AUM and your investing style isn’t rewarded by the market, you either stick to your guns and keep shrinking, or you adapt.

Unlike Buffett at Berkshire, Terry doesn’t manage permanent capital.

Underperformance triggers real redemptions, and Fundsmith is a business as much as a fund. When AUM falls, the business suffers.

I keep coming back to Ray Dalio’s line:

“Embrace reality and deal with it.”

Blaming index funds and momentum investors for his underperformance would have been sticking his head in the sand.

Instead, Terry sold expensive, slow-growing stalwarts and bought faster-growing businesses with both fundamental and price momentum.

That’s dealing with reality, even if it comes years later than it should have.

Shareholder returns ultimately break down into two things: multiple expansion and earnings growth.

To maximize your odds, you want to buy at a reasonable multiple with real earnings growth ahead of you.

What Terry has done here is tilt that equation back in his favor, at the cost of taking on more risk than Fundsmith investors are used to.

The key takeaway

Terry Smith isn’t abandoning quality investing, he’s fixing the mistake that undermined it: holding expensive, slow-growing “quality” stalwarts for too long.

Whether this was the strategy he’d have chosen without the AUM pressure is a fair question, but the direction, cheaper entry points plus faster growth, is the right instinct.

I’m more interested in Fundsmith today than I’ve been in years, and I’ll be watching how this plays out over the next five.

Ready to take the next step? Here’s how I can help you grow your investing journey:

  1. Go Premium — Unlock exclusive content and follow our market-beating Quality Growth portfolio. Learn more here.

  2. Essentials of Quality Growth — Join over 300 investors who have built winning portfolios with this step-by-step guide to identifying top-quality compounders. Get the guide.

  3. Free Valuation Cheat Sheet — Discover a simple, reliable way to value businesses and set your margin of safety. Download now.

  4. Free Guide: How to Identify a Compounder — Learn the key traits of companies worth holding for the long term. Access it here.

  5. Free Guide: How to Analyze Financial Statements — Master reading balance sheets, income statements, and cash flows. Start learning.

  6. Get Featured — Promote yourself to over 24,000 active stock market investors with a 42% open rate. Reach out: investinassets20@gmail.com

☐ ☆ ✇ Invest in Quality

Why I'm Bullish on Amazon 🛍️

By: Invest In Assets 📈

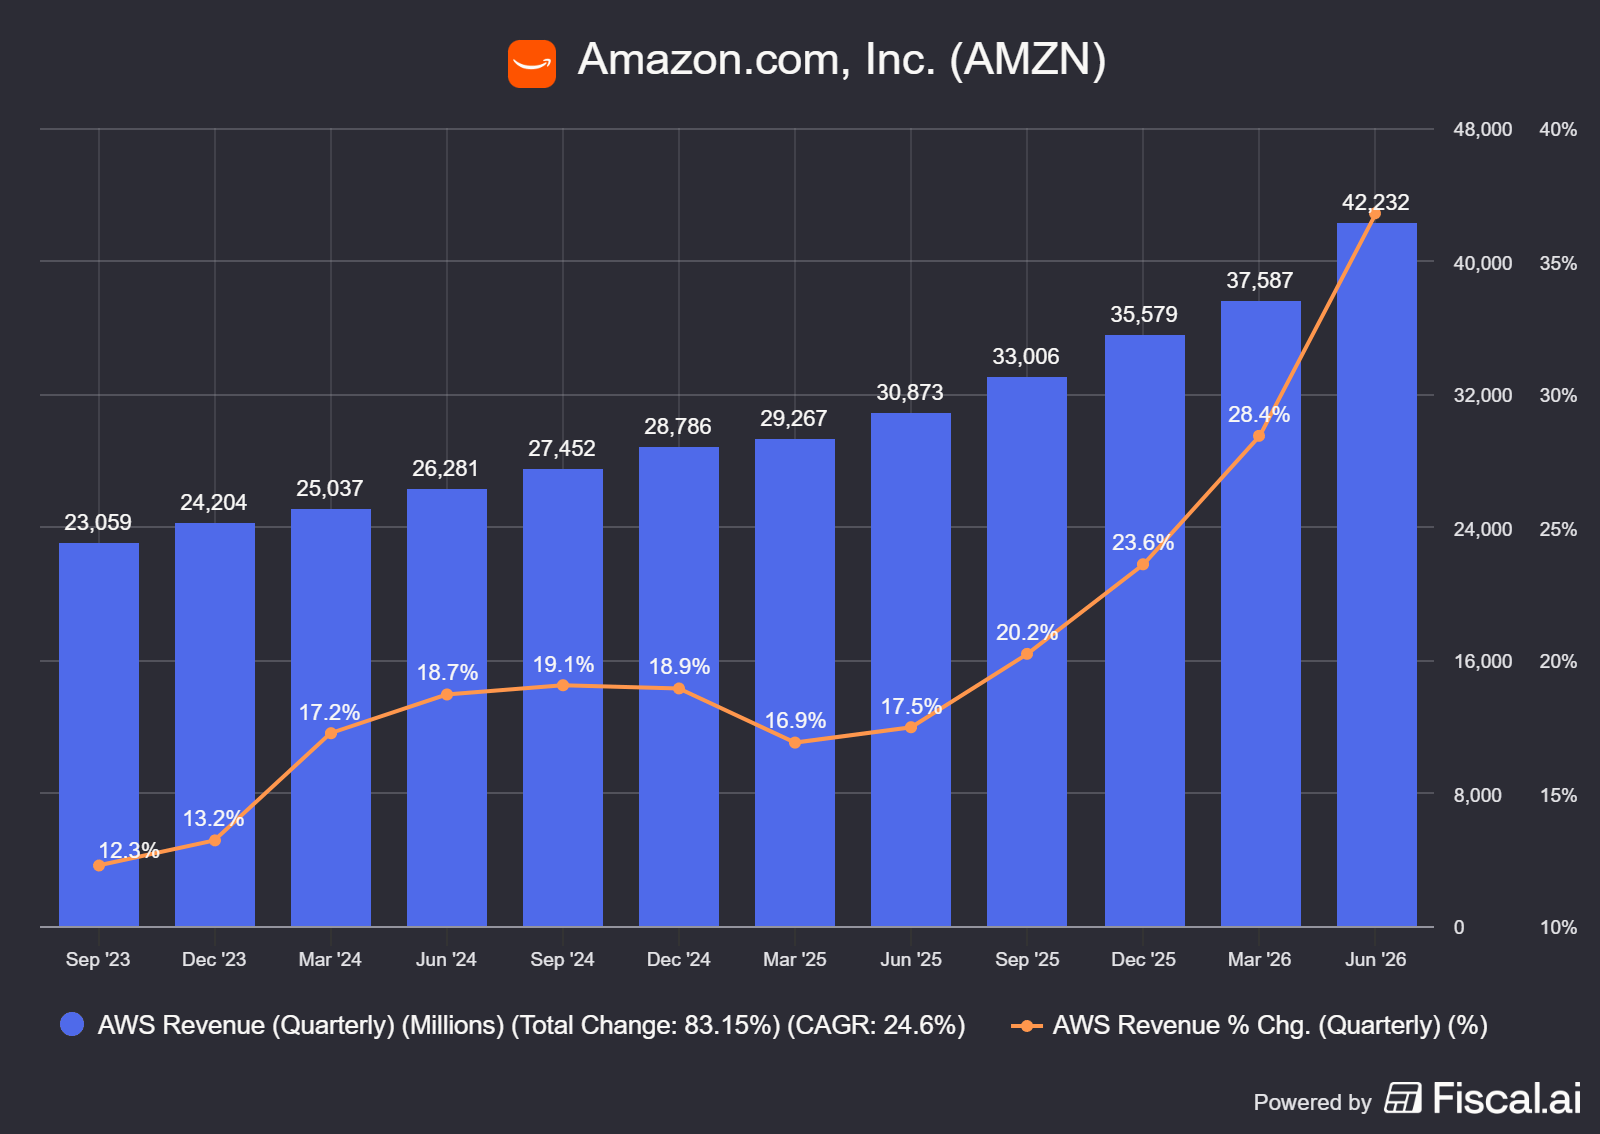
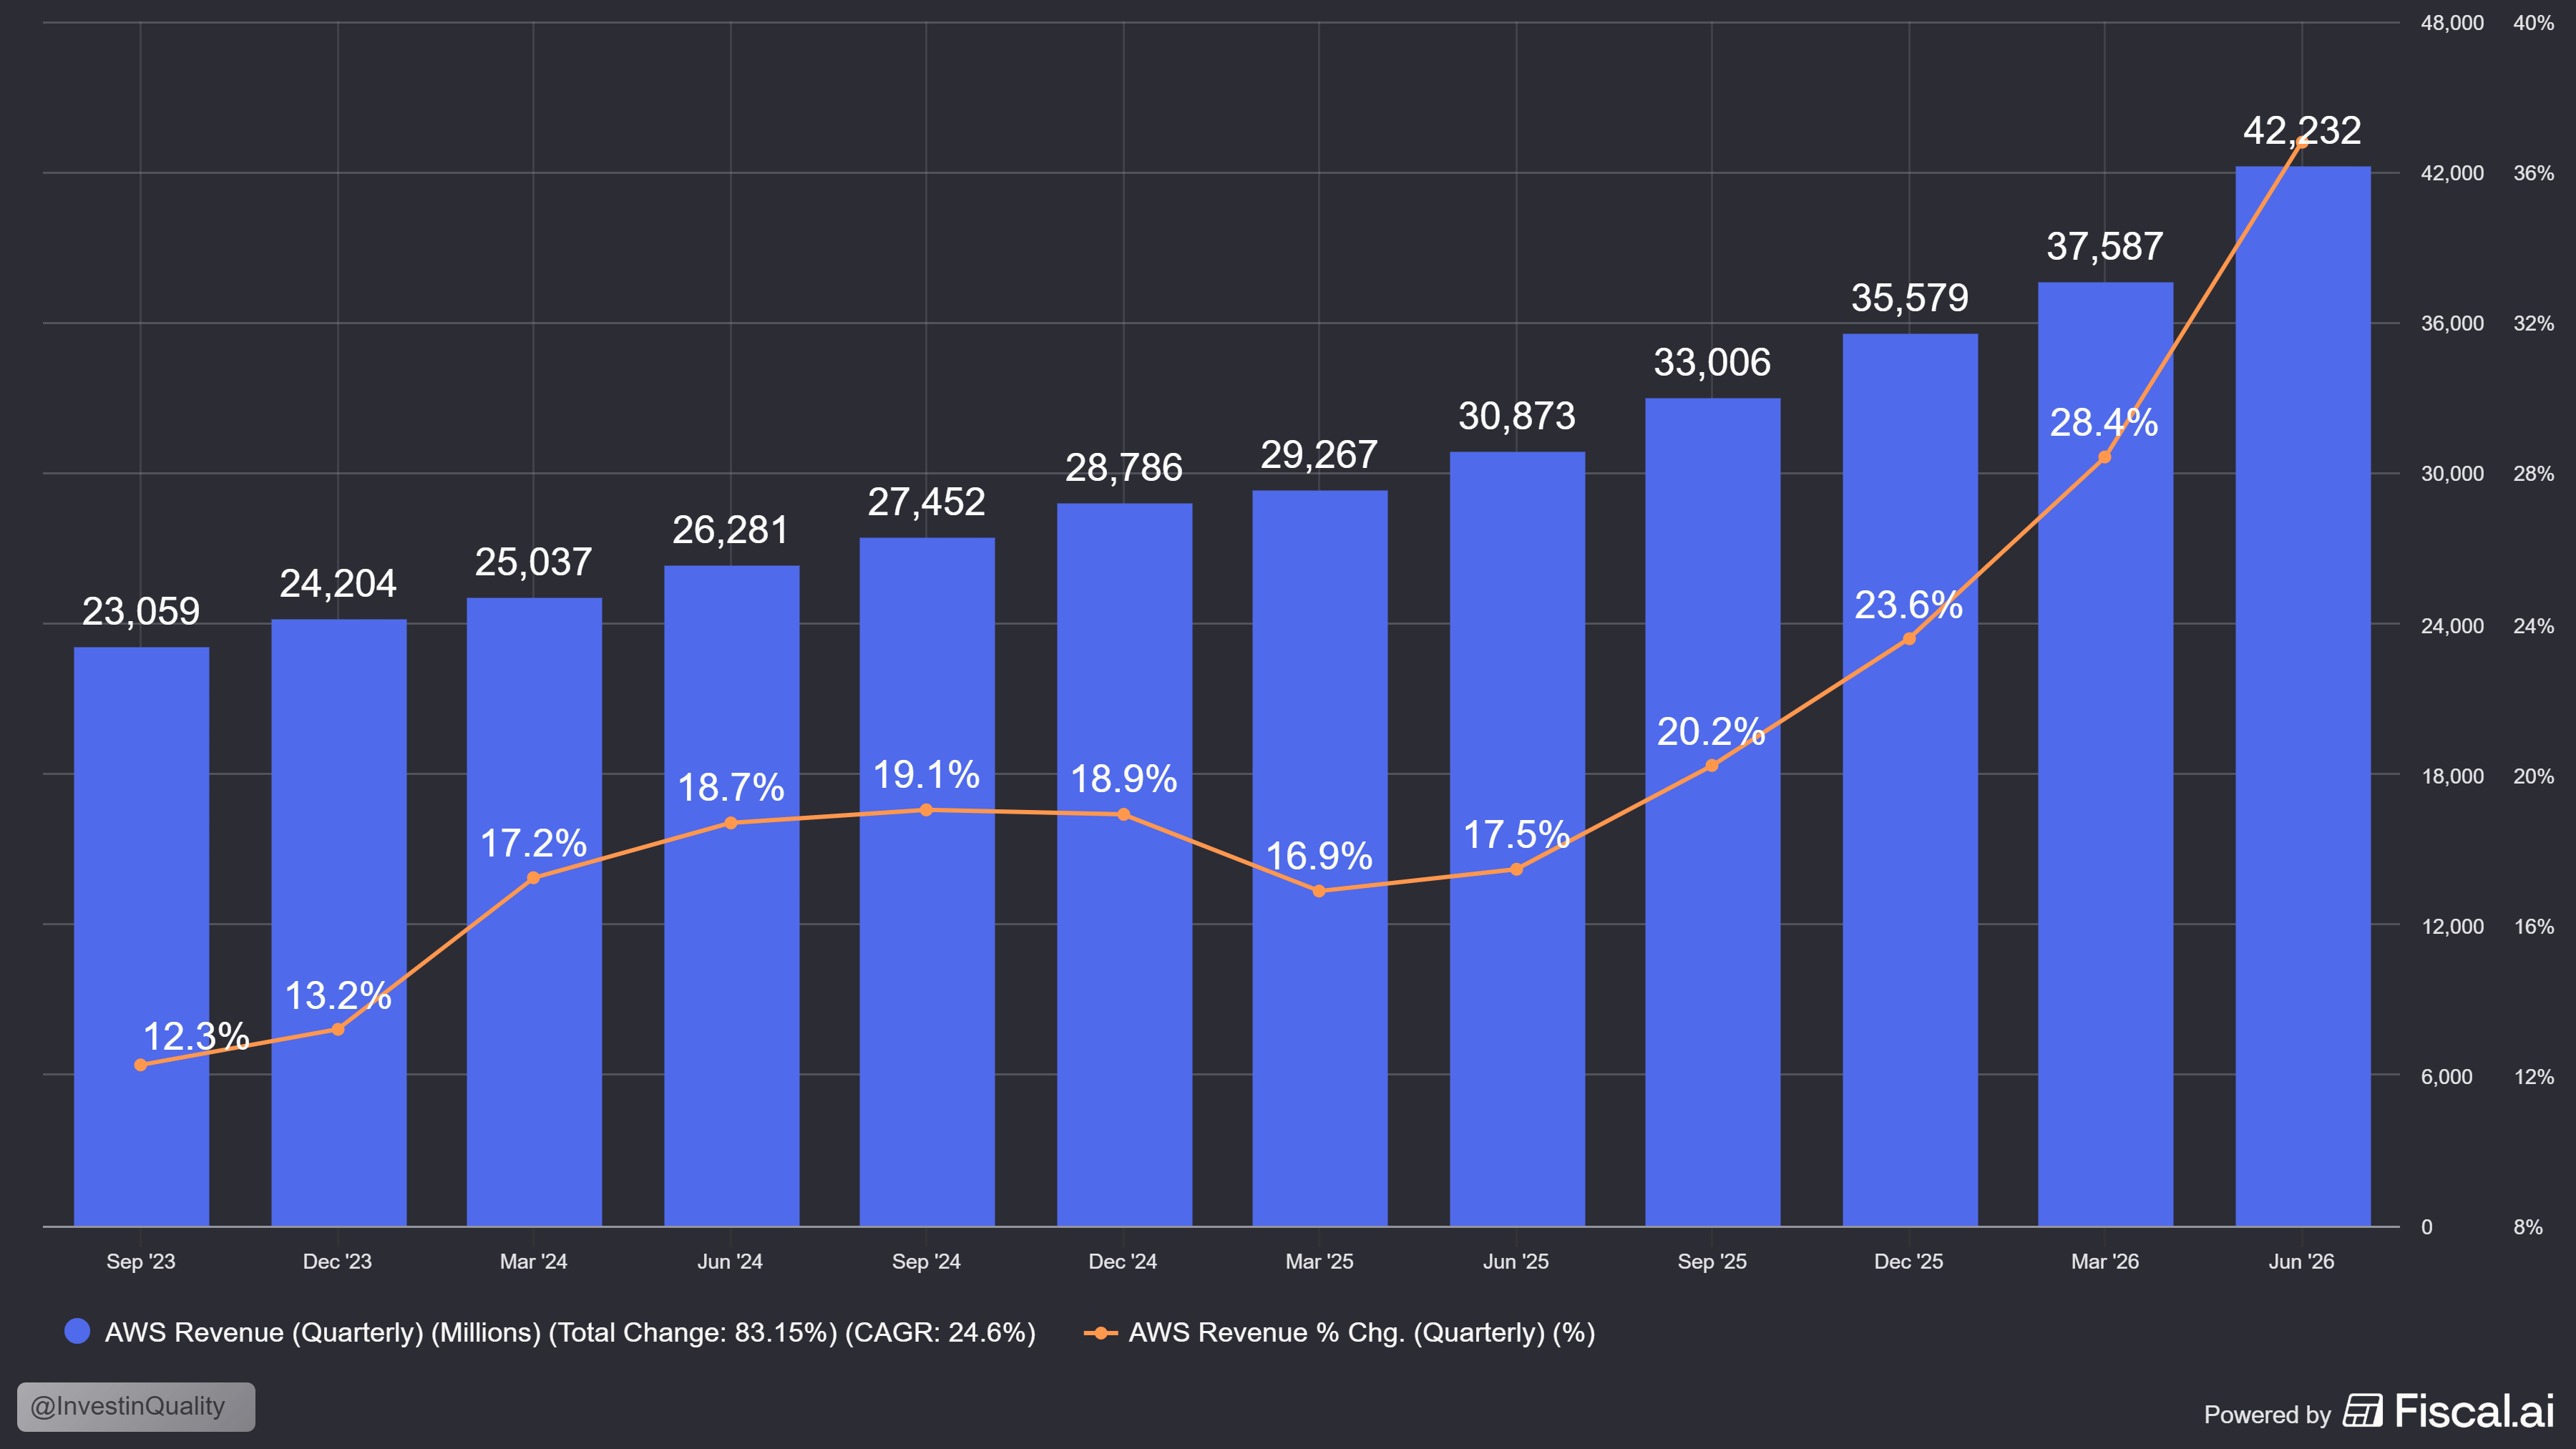
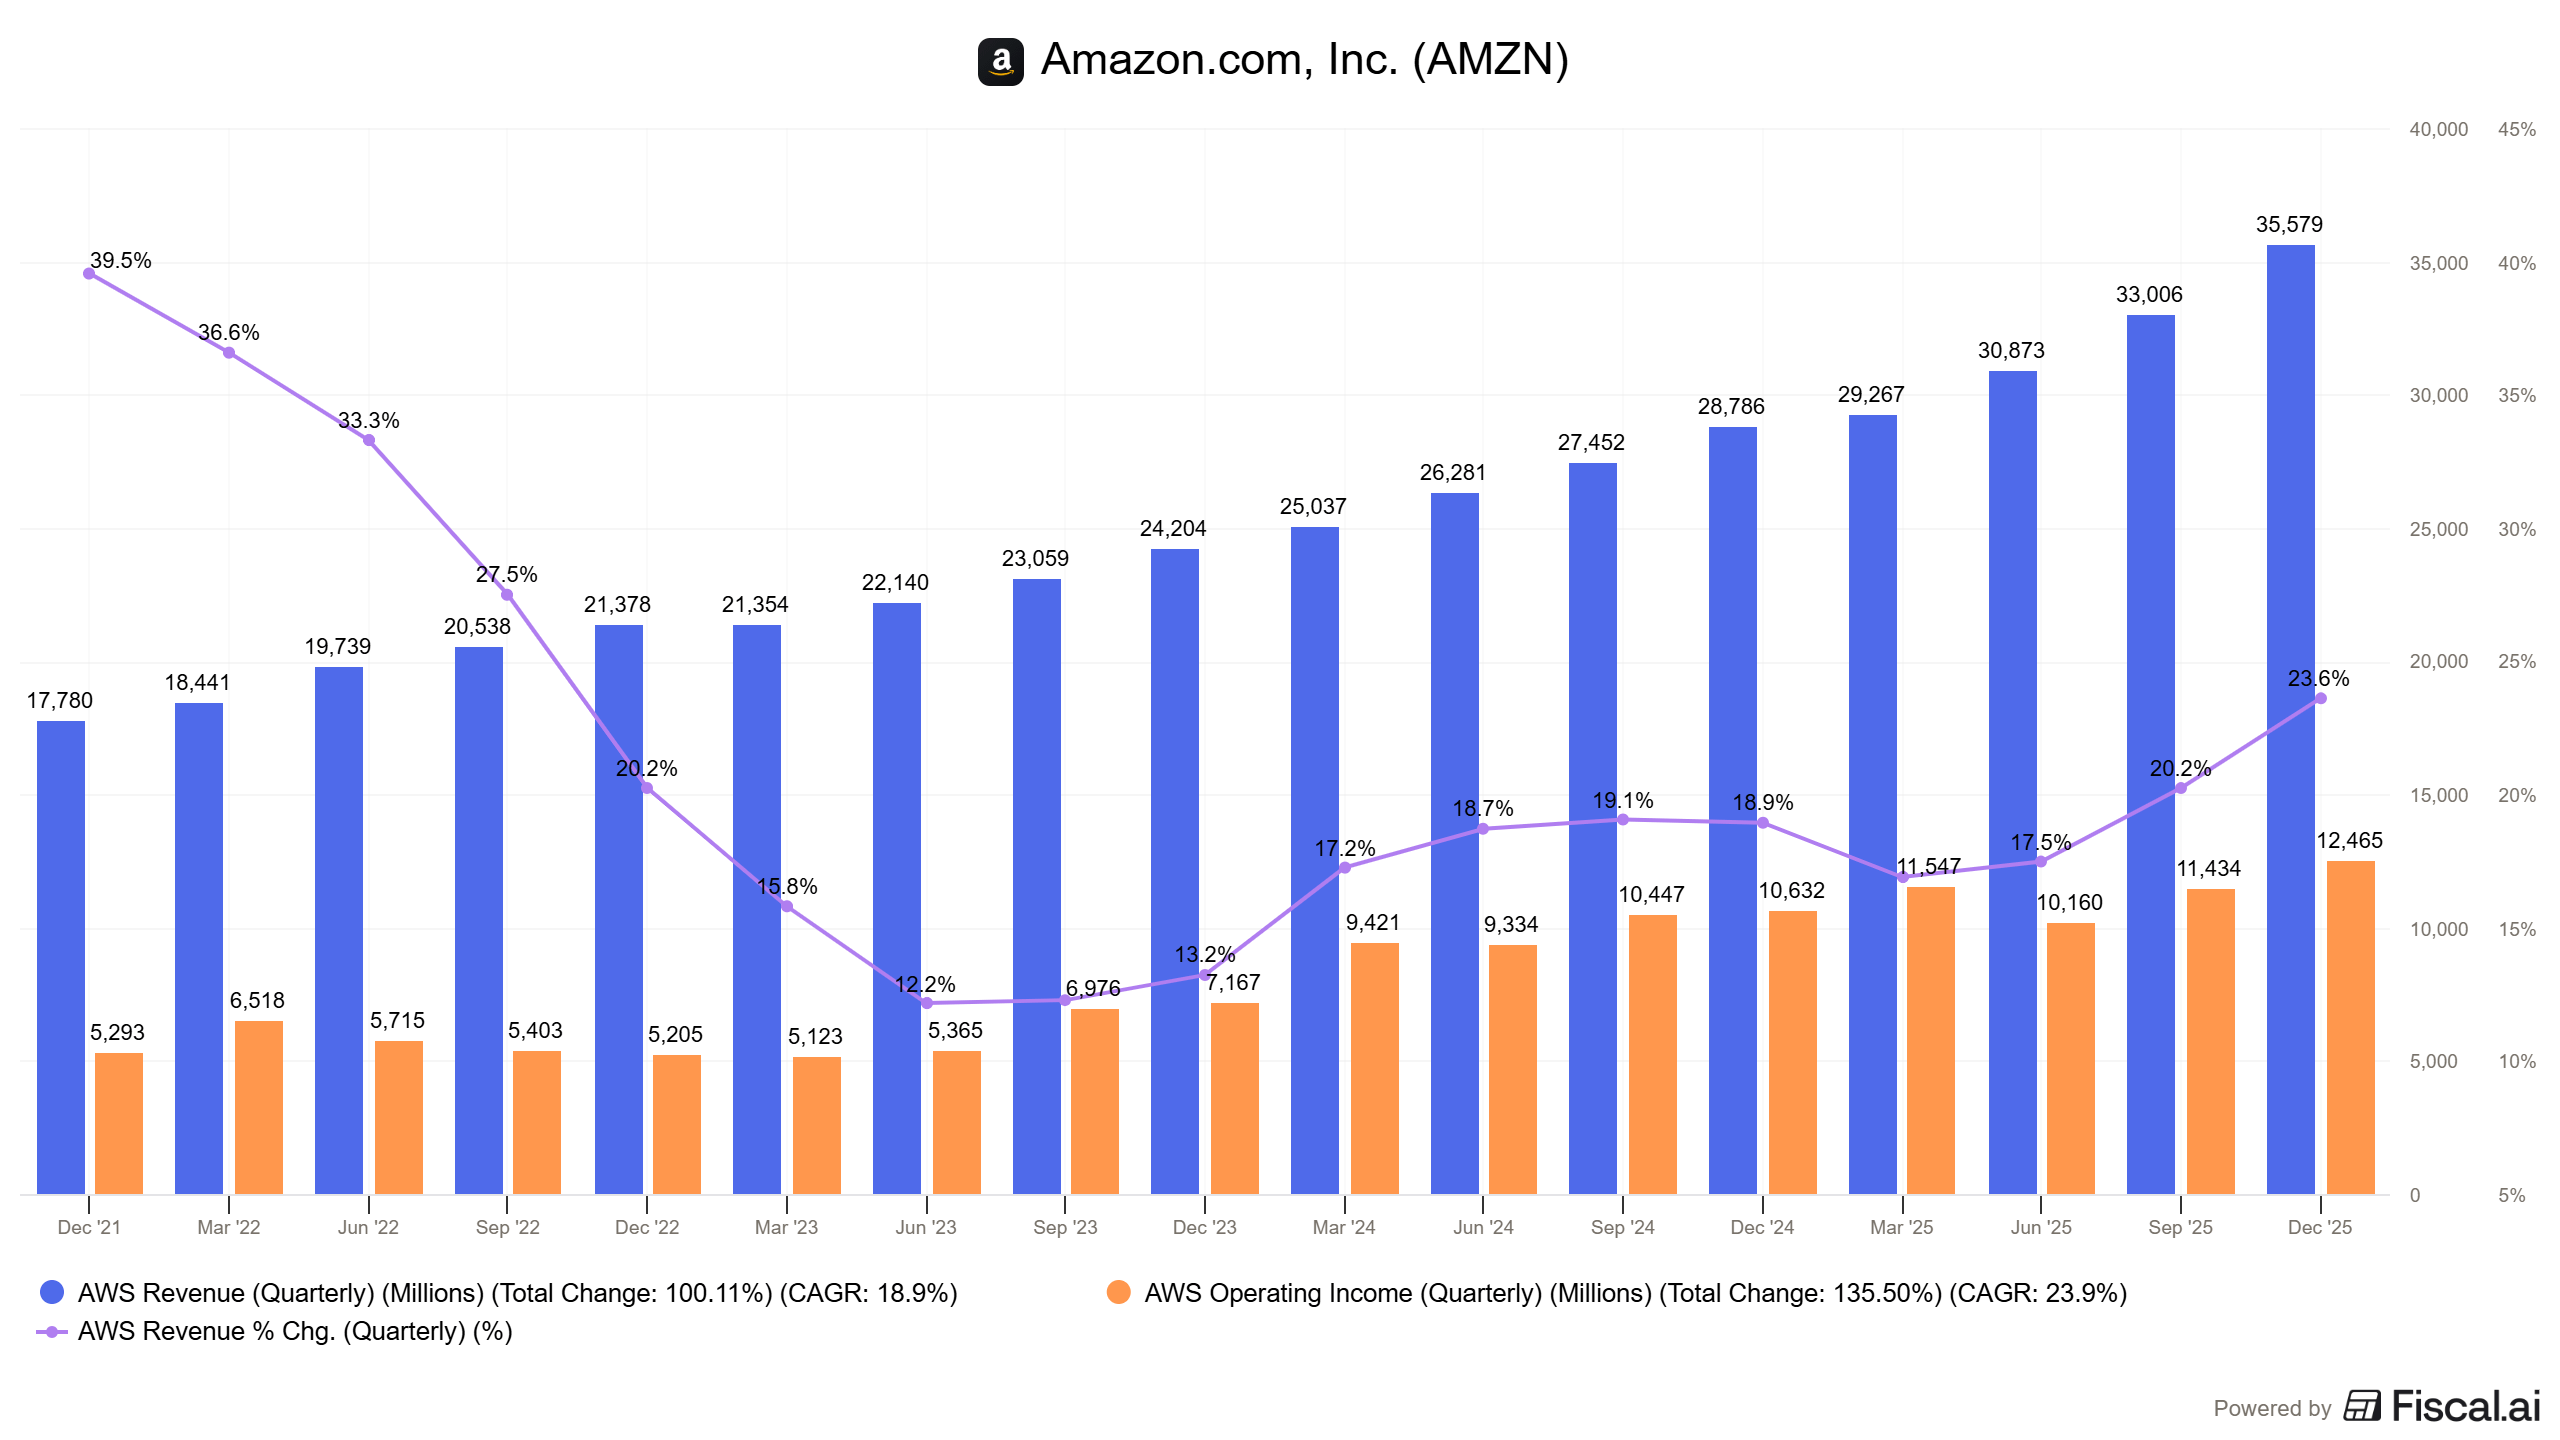
Amazon Web Services is now a $169 billion annualized revenue business.

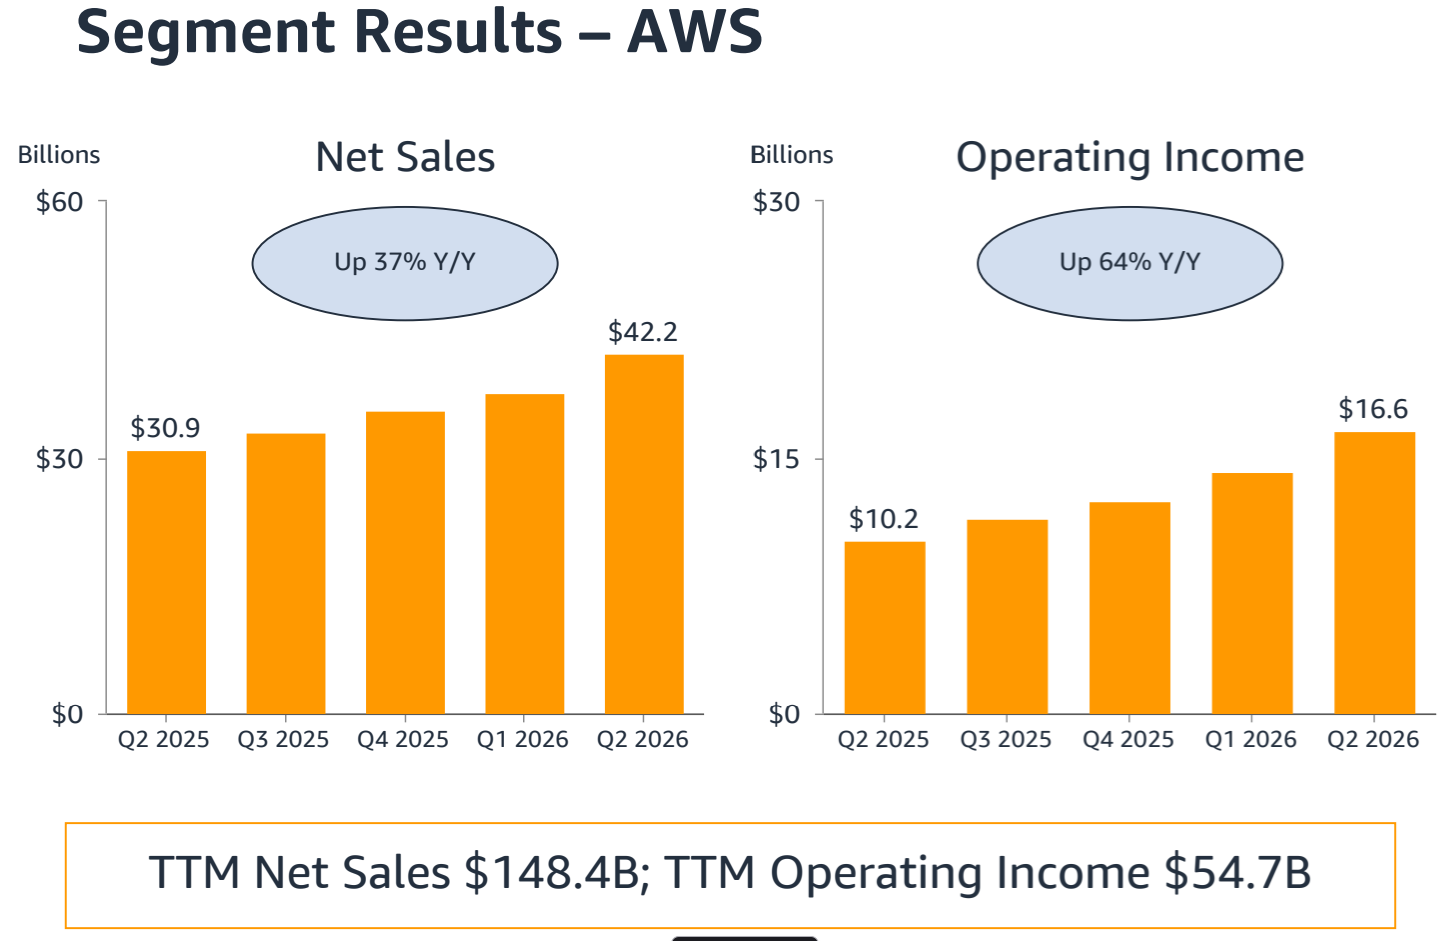
In Q2, it grew 36.7% year over year with an operating margin of 39.3%.

That is the fastest growth AWS has posted in 18 quarters, back when the business was less than half its current size.

The reacceleration of AWS is a work of art. It defies the ‘law of large numbers’:

Growth rarely accelerates at this kind of scale.

Conventional economic theory says that as a business gets larger, its growth rate slows. Eventually, it slows down to the market average.

Bigger denominators make bigger percentage gains harder to repeat, every quarter, for every company that’s ever gotten large.

AWS just did the opposite for the fifth straight quarter in a row.

That is the main number in this report, and the reason why the market bid the stock up after hours.

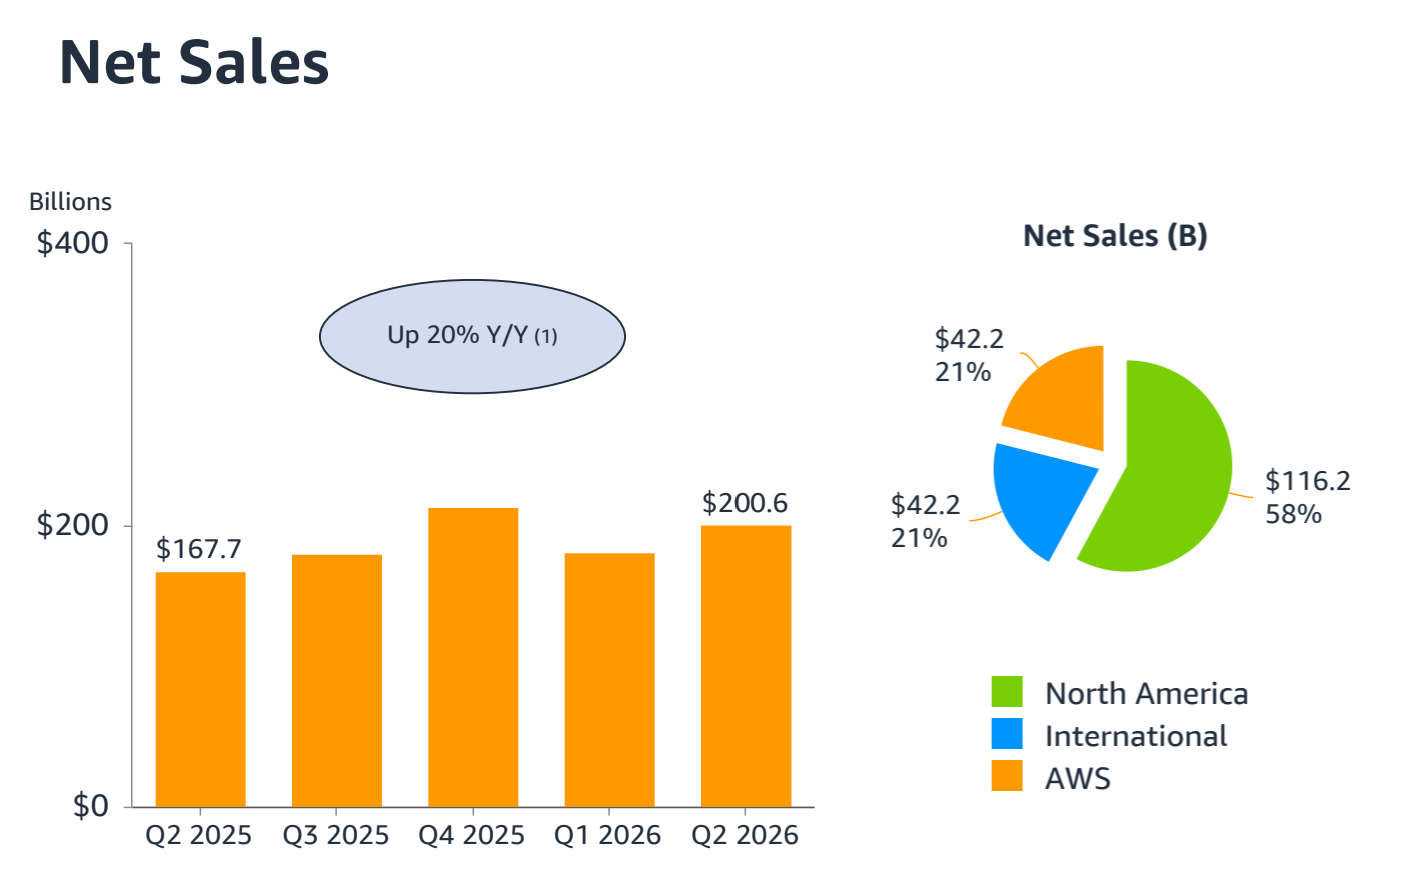
Another very impressive number for Amazon’s size is the +20% YoY Net Sales growth.

It’s been a while since Amazon posted numbers like this - and it is supported by the incredible growth in AWS, ads, and Amazon’s chip business.

Get 40% off forever

Why acceleration at this size is rare

Put $169 billion with a 39.3% operating margin in context.

If AWS were a standalone company, it would rank 24th on the Fortune 500.

It produces EBIT of ~$66 billion annually, growing at an unprecedented rate.

Businesses that size don’t usually speed up; they mature and slow down.

Management becomes defensive and wants to protect the business.

AWS skipped this chapter completely and added $4.6 billion QoQ, its largest sequential jump ever.

The backlog is exploding

AWS’ backlog is the second reason why the market loved this report.

A backlog of $496 billion, growing at a triple-digit rate year over year according to Andy Jassy:

“Our backlog stands at $496 billion, growing triple digits year-over-year”

Analysts on the call noted that this figure is now roughly 2.5 times its level in Q3 2025.

The backlog is forward-looking.

It’s what customers have already signed up for, not what management hopes happens next.

Revenue growth lags backlog growth, which means the acceleration we just saw isn’t the ceiling. It’s closer to a floor for what’s already locked in.

Two more data points back up the durability of the Amazon case:

  • Graviton, Amazon’s custom CPU chip, is used by 98% of AWS’s top 1,000 EC2 customers. This only increase the switching-cost moat of Amazon - which is under communicated.

  • Trainium and Graviton combined now generate over $25 billion in annualized revenue, growing at triple-digit rates. Anthropic and OpenAI, the two largest AI labs in the world, have both made multi-year, multi-gigawatt commitments to Trainium specifically.

When the two companies with the most compute-intensive, most demanding workloads on the planet commit multiple years of capacity to your chip, that is one hell of a signal.

Where the next leg of growth comes from

CEO Andy Jassy described AI demand right now as a barbell.

On one end, frontier AI labs are consuming enormous amounts of compute.

On the other, enterprises are getting real productivity gains from things like automated customer service and fraud detection.

The middle of that barbell, the bulk of existing enterprise production workloads, still isn’t using AI inference in a pervasive way.

Jassy expects that to be the largest segment eventually, by a wide margin. If he’s right, today’s acceleration is driven by the two thinner ends of the barbell, and the fat middle hasn’t shown up yet.

This is a multi-year growth argument for why growth rates can be sustainably high.

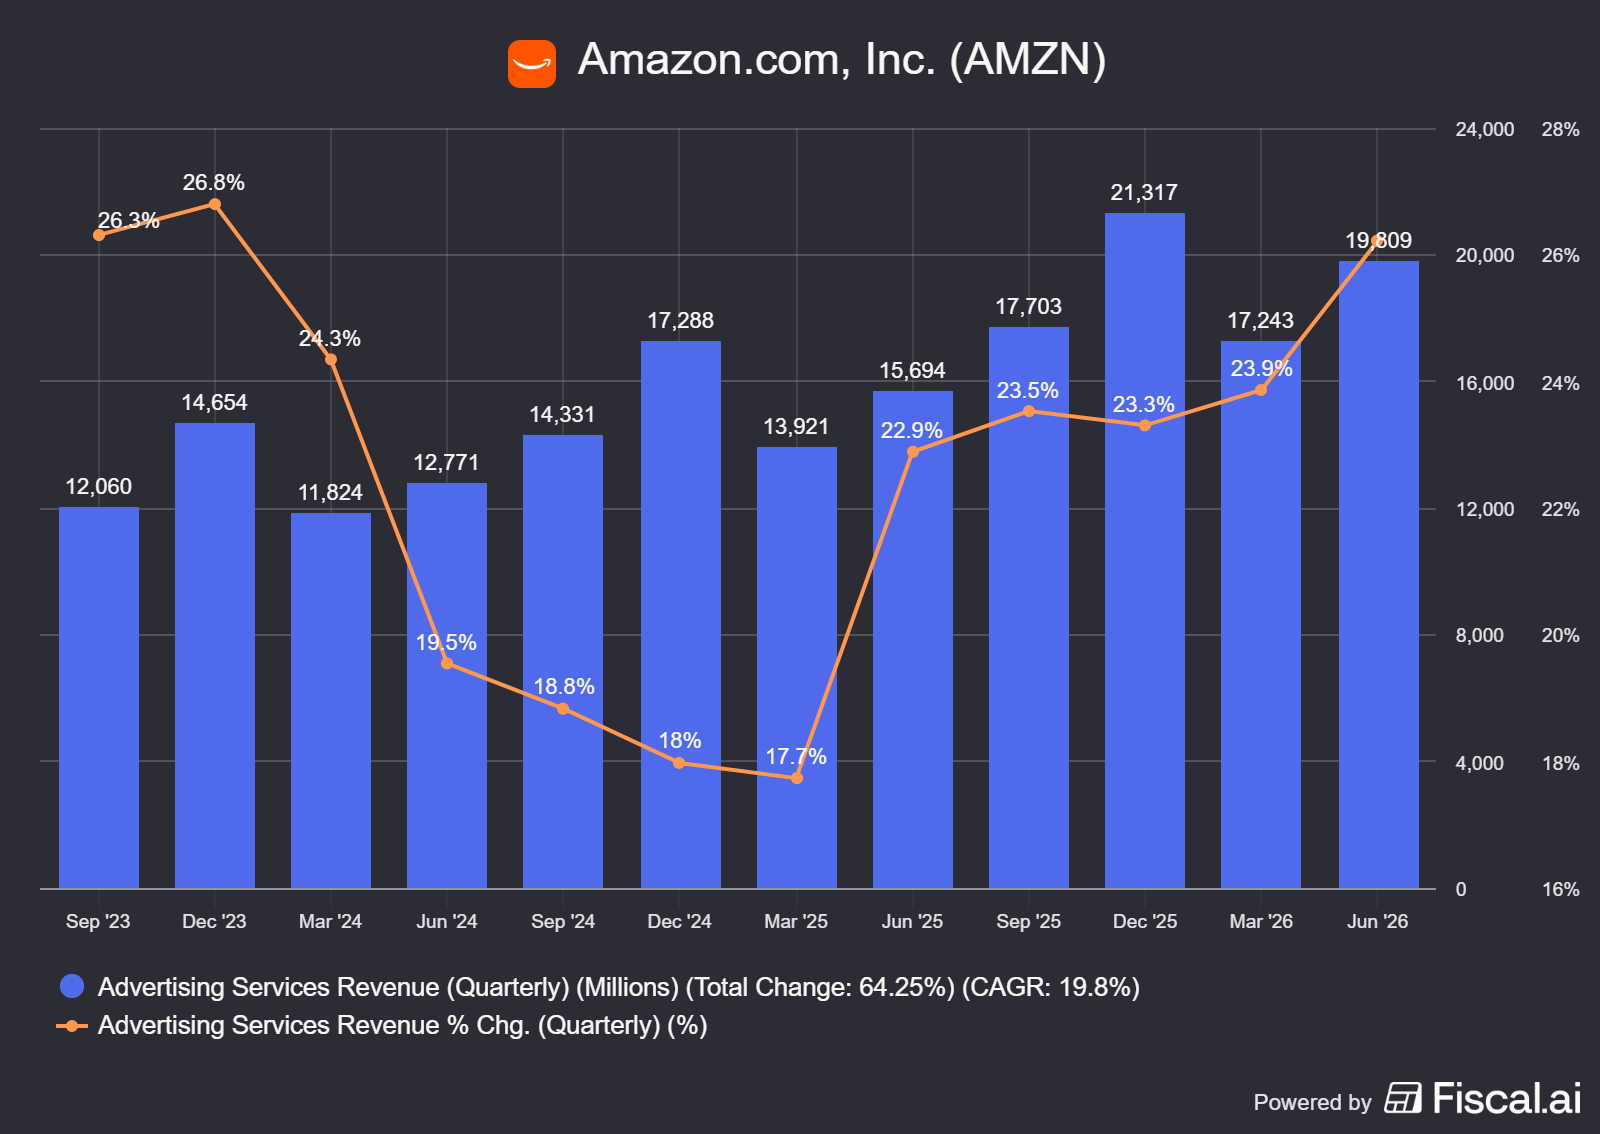
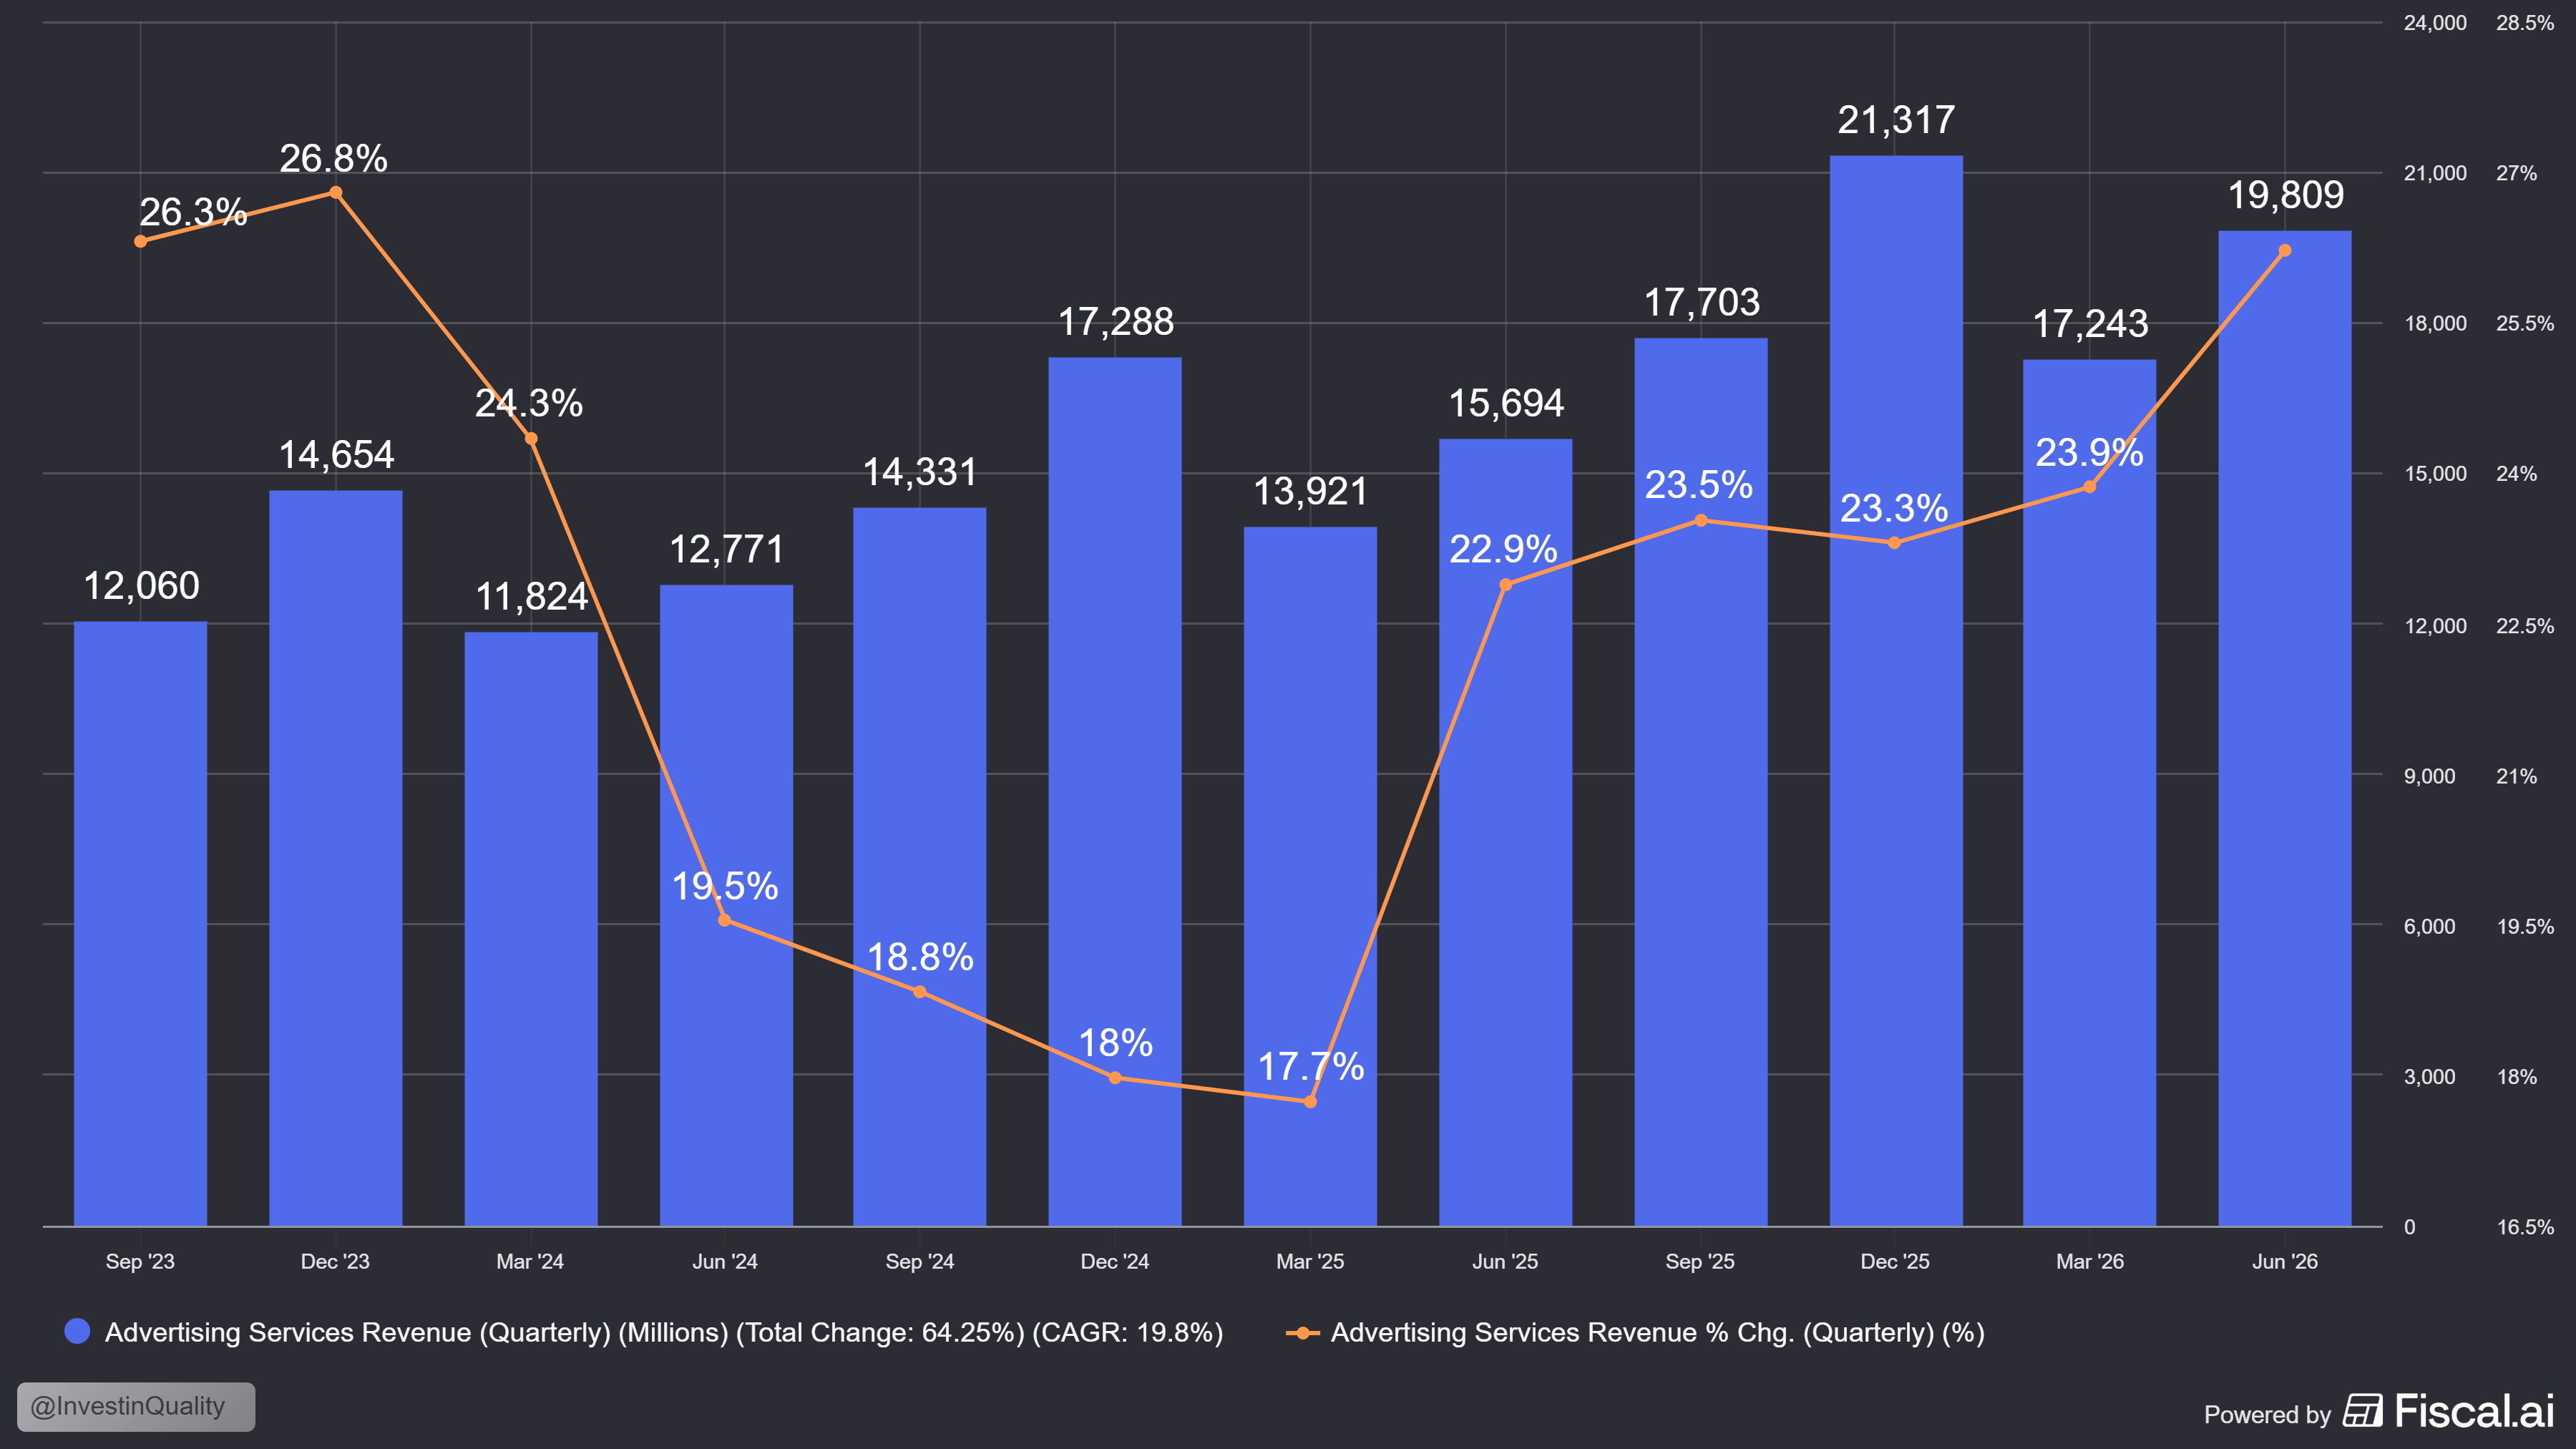
In addition, Amazon’s attractive ads business is also accelerating, having its best growth quarter since 2023 of 26.2% YoY growth:

This is also a ‘business within the business’ - Amazon ads is estimated to have operating margins in the +50% range, closing in on ~$80 billion in annual revenue, this is a serious business, and one few ever talk about.

Get 40% off forever

Now, about that free cash flow number

If you looked at the earnings report, you probably had a moment of concern about the free cash flows.

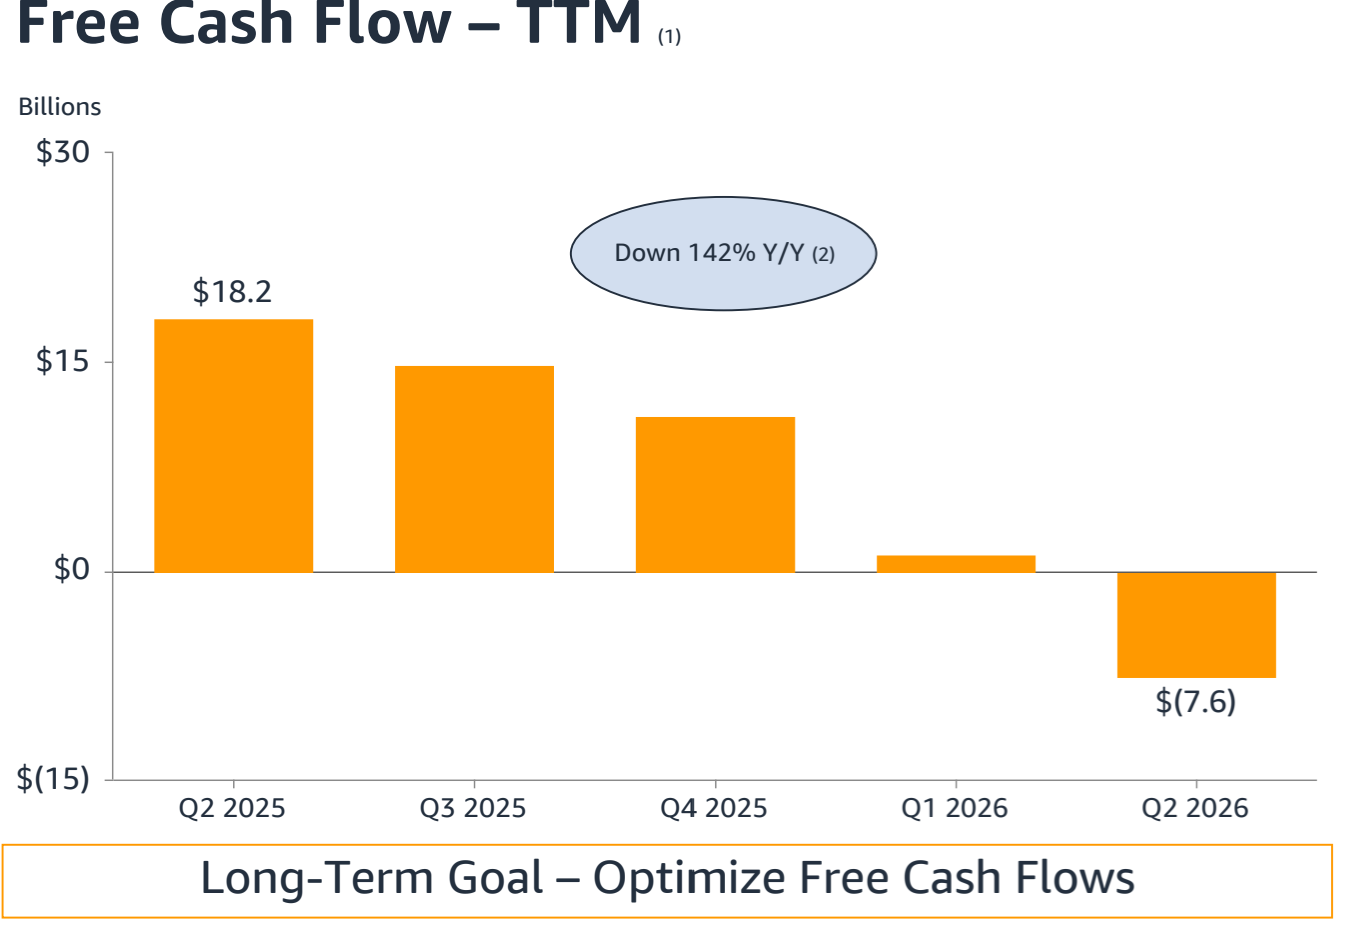
Trailing twelve-month free cash flow just went negative, at -$7.6 billion.

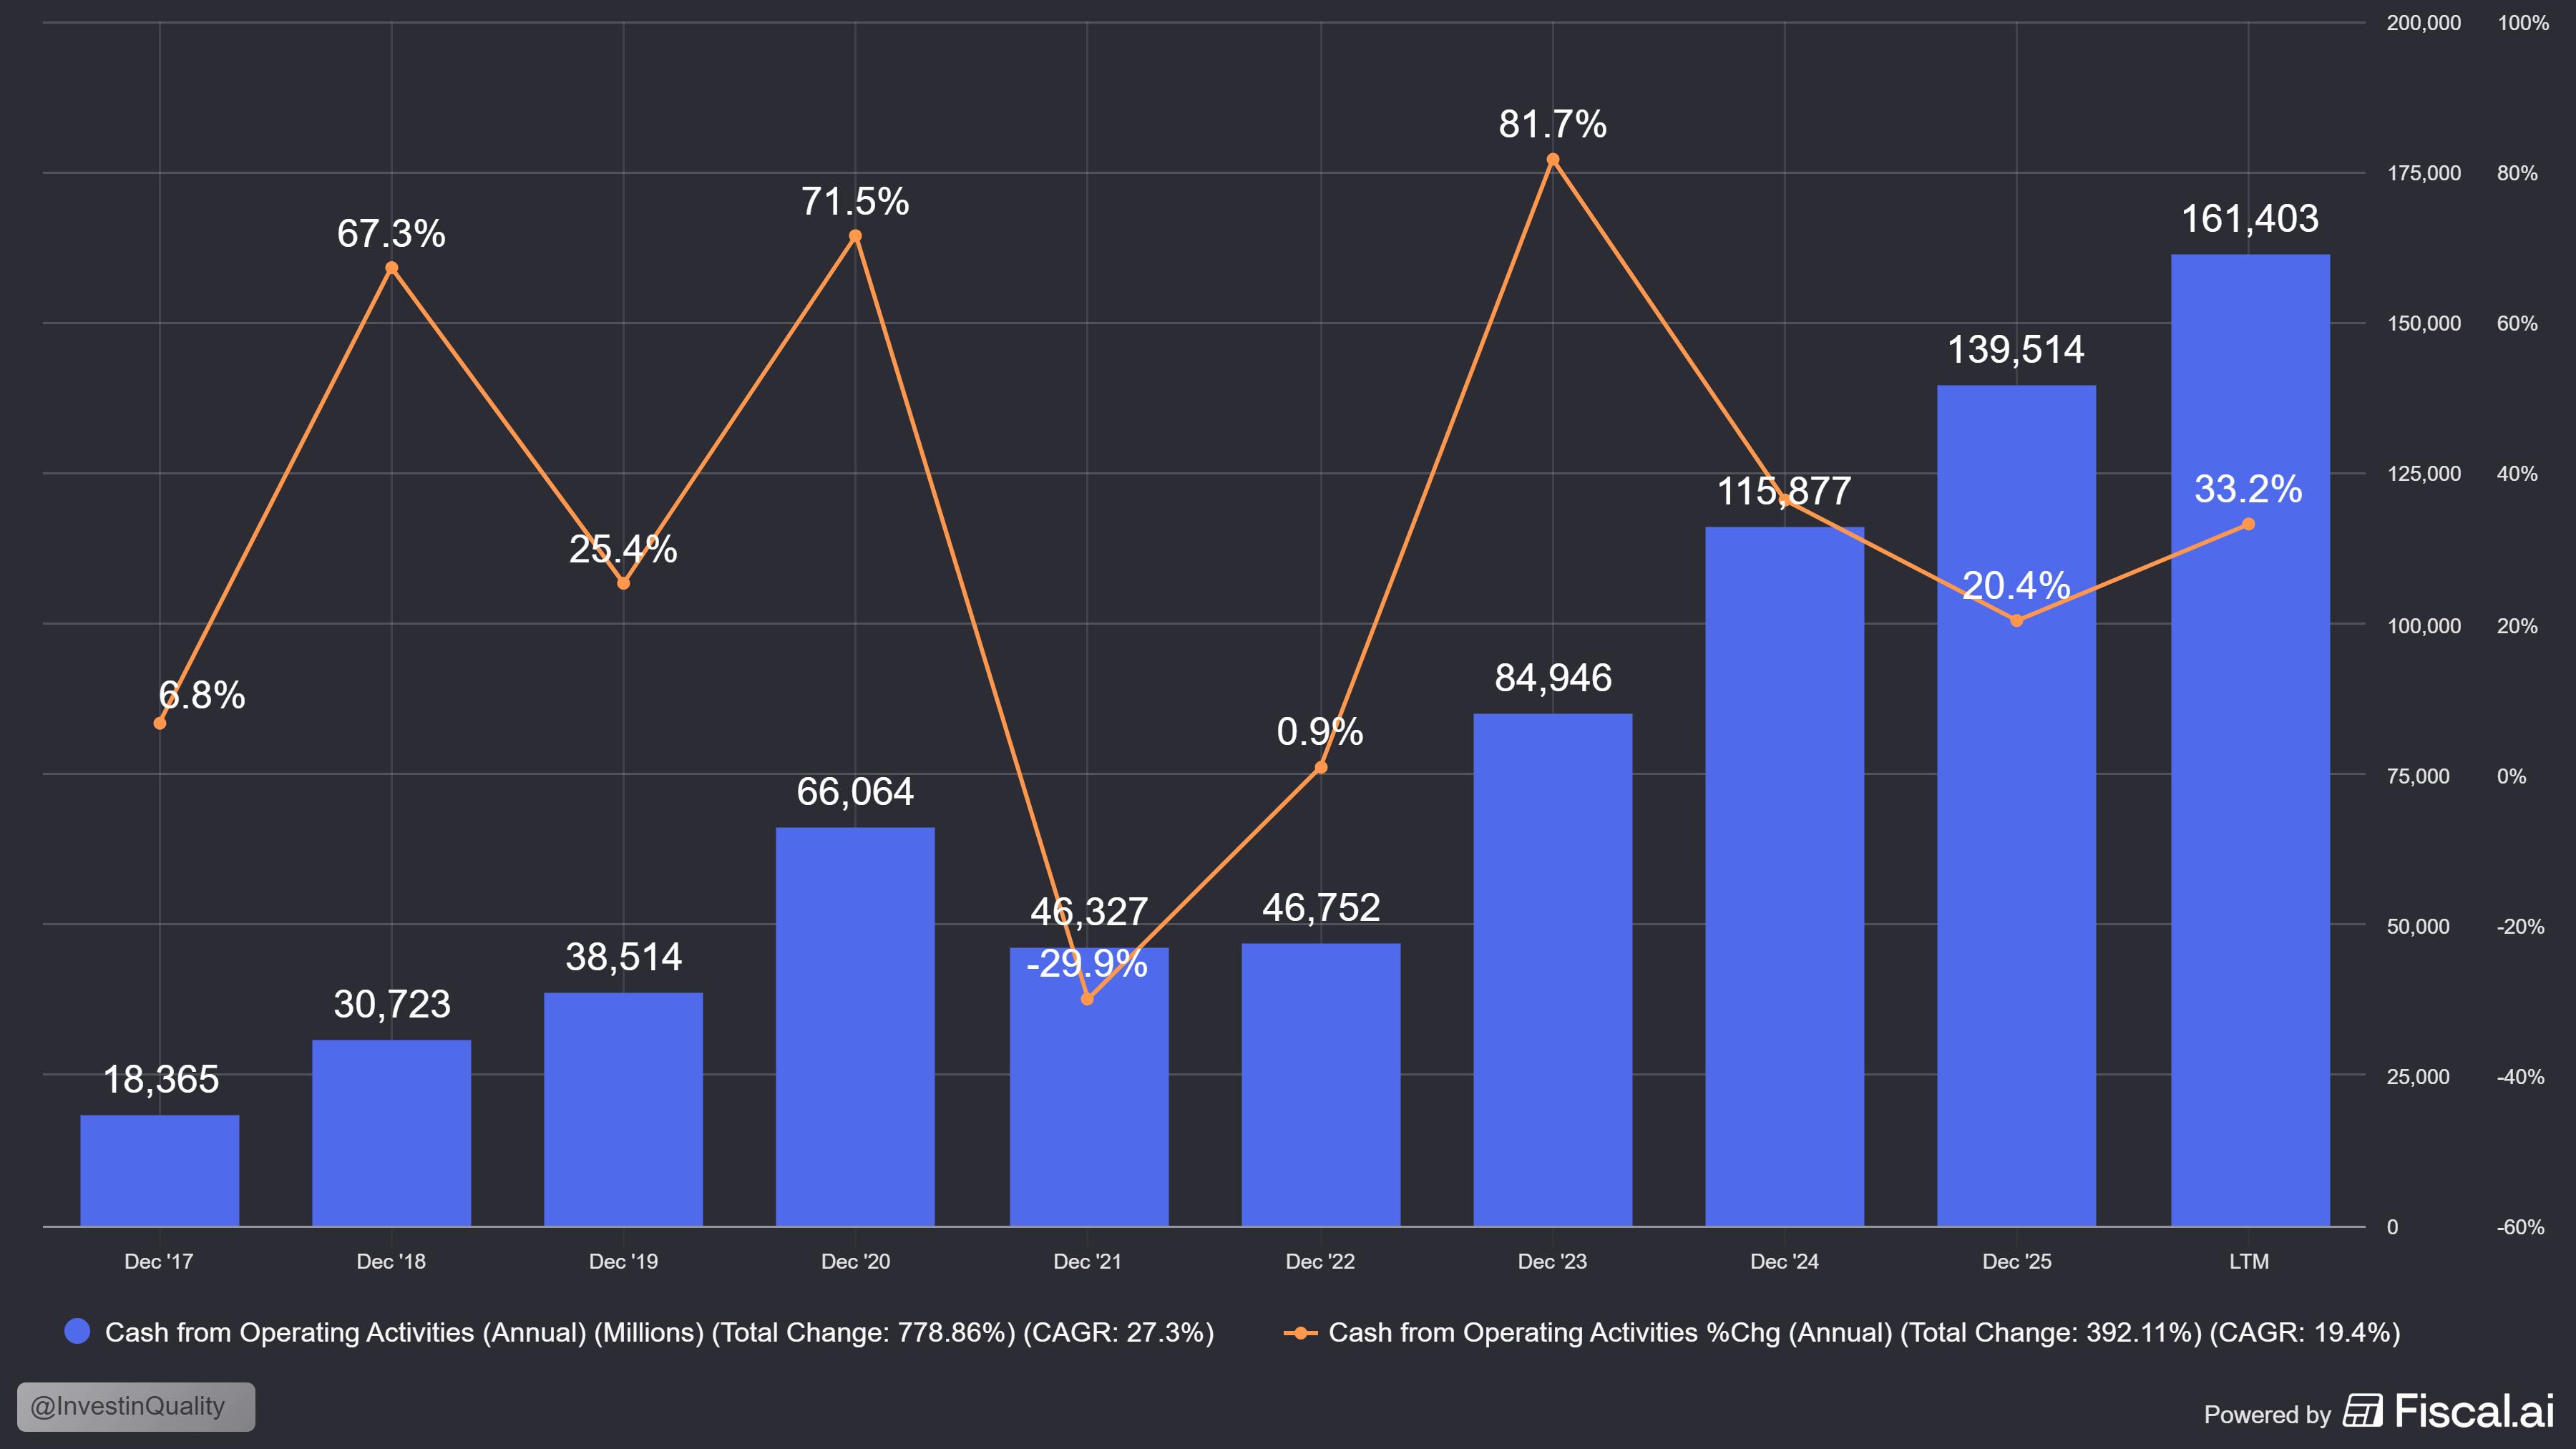
The key thing to note here is that ‘Operating cash flow’ actually rose +33% YoY.

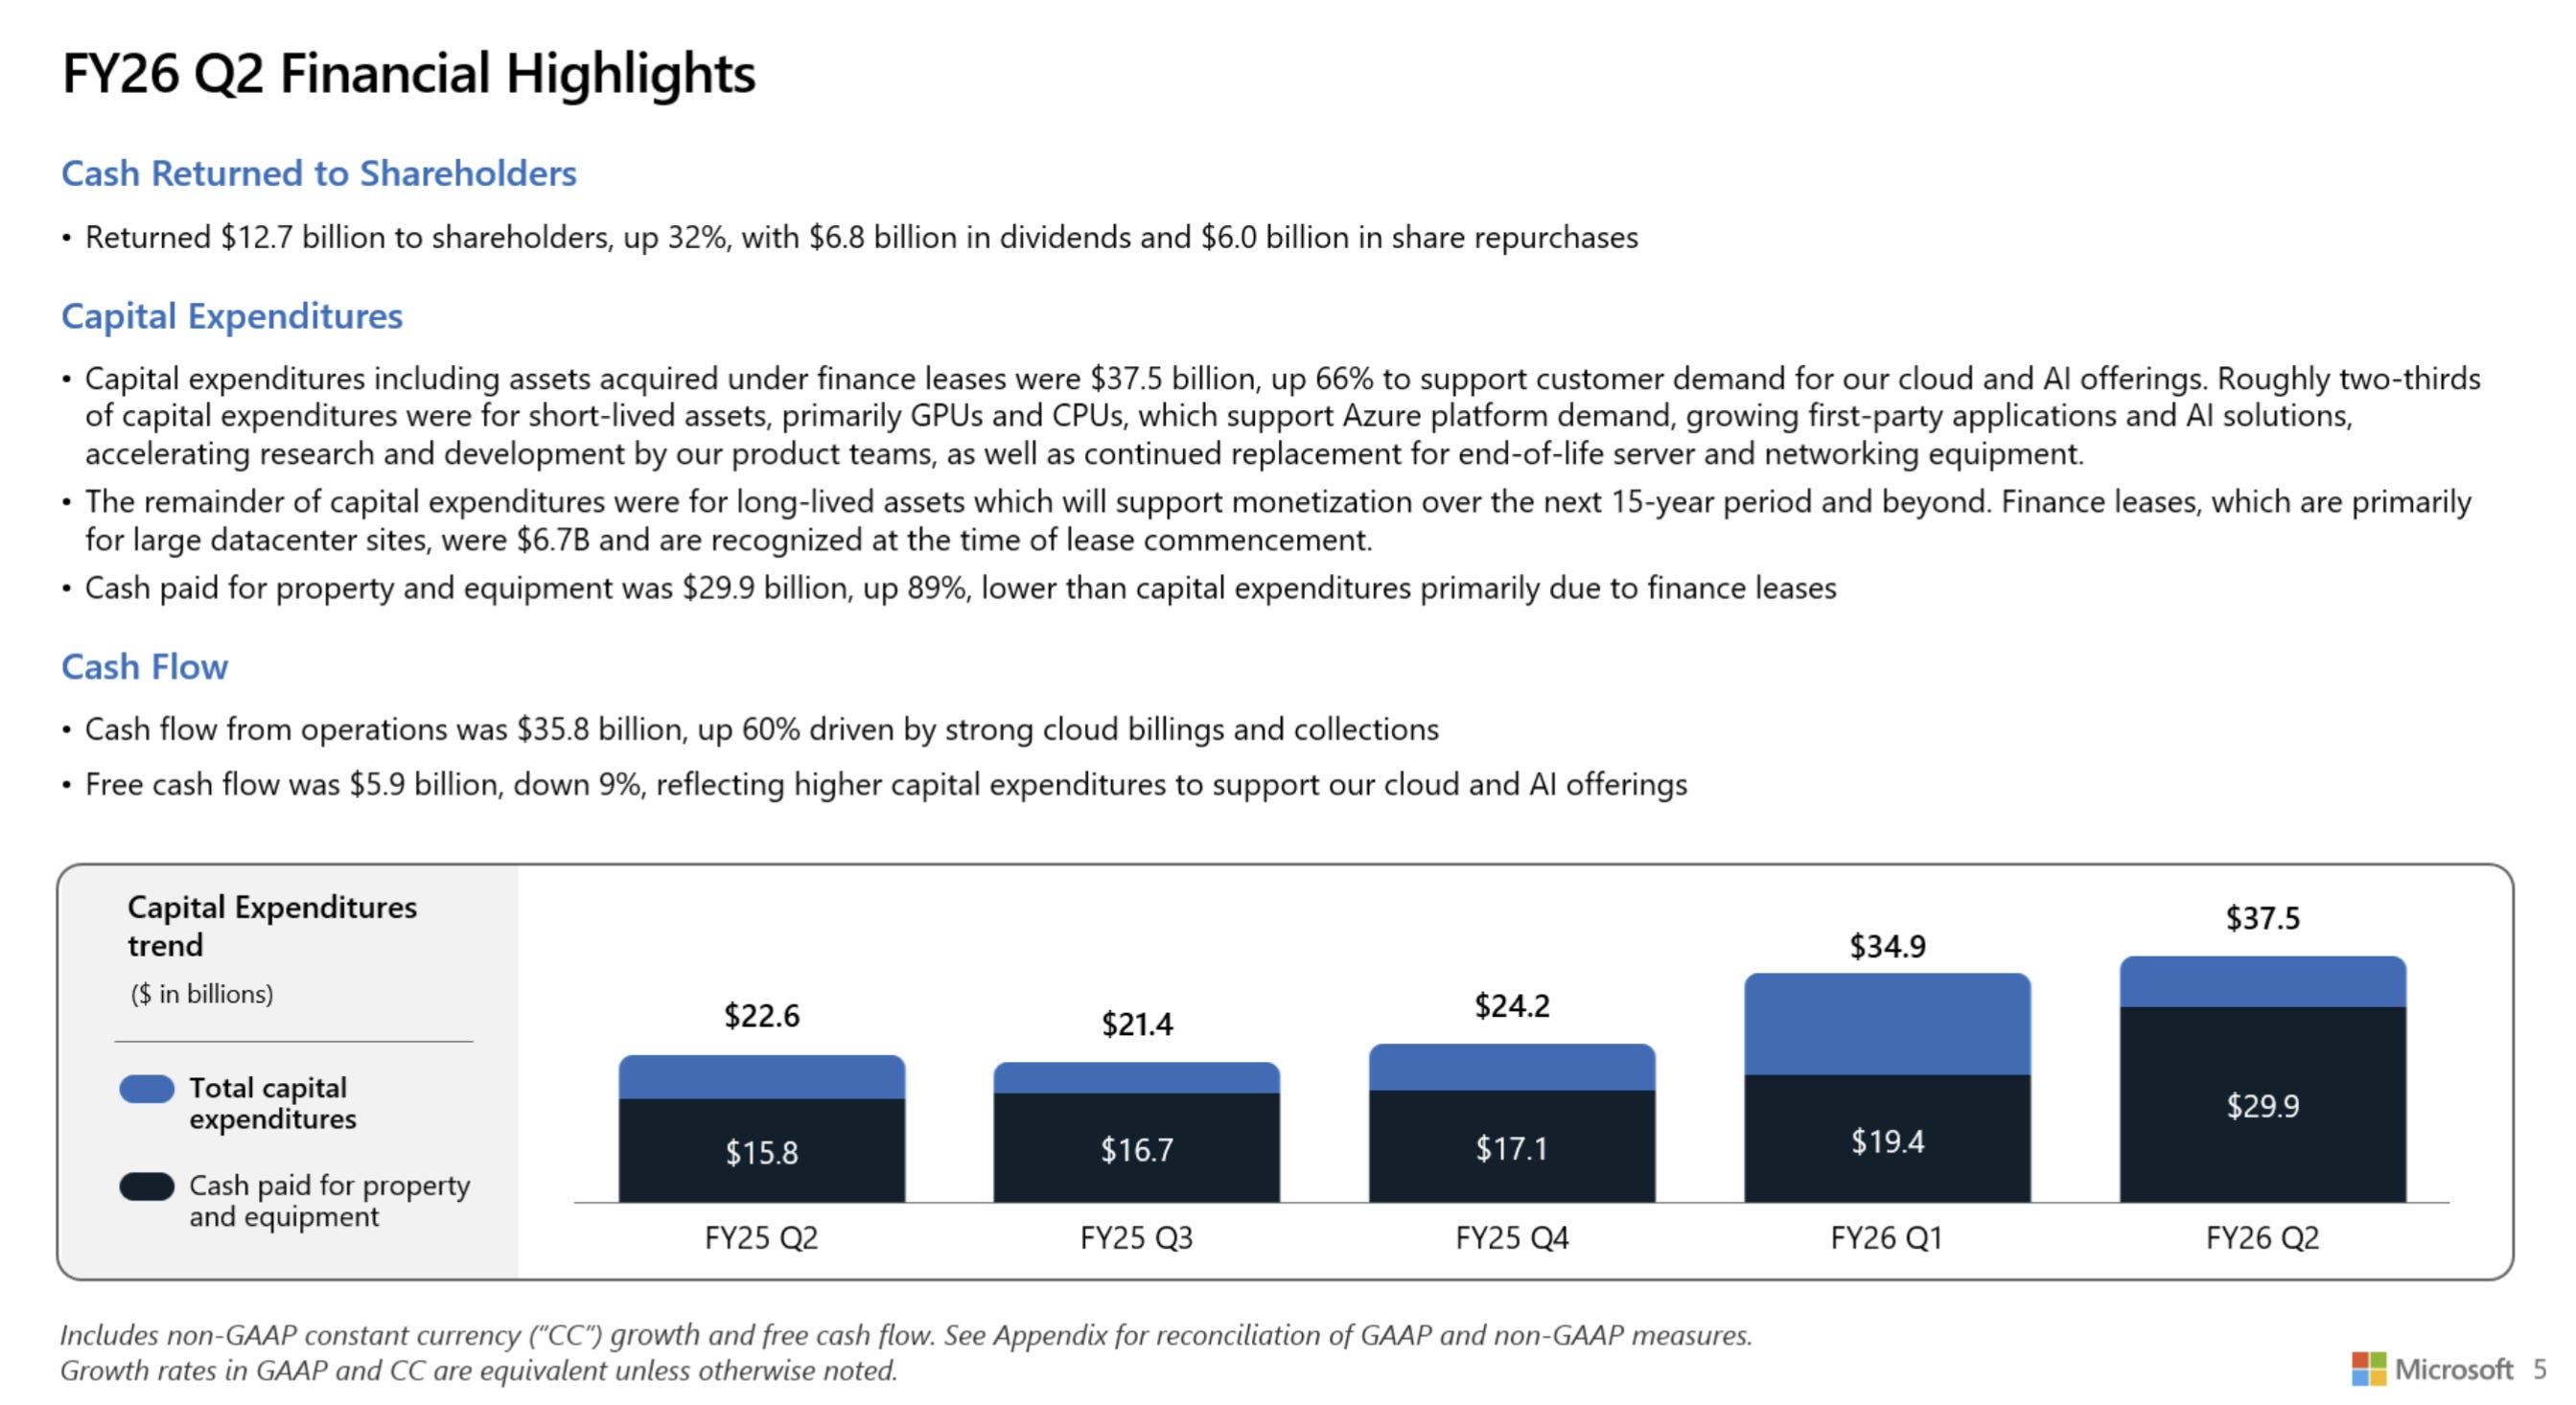
So, the negative FCF is solely due to CapEx investments made very deliberately from the management team (And the investments are starting to bear fruits, which this quarter is proof of).

Let’s talk a bit more about CapEx - Amazon expects to spend approximately $220 billion in cash CapEx in 2026 (Up from $200 billion estimate earlier this year).

This is primarily driven by higher memory chip costs.

Here is the mechanic that matters the most, laid out by the management team on the call:

Data centers and servers run on completely different capital cycles.

Data center construction requires ~2 years of spending before a single server goes in and starts generating revenue. Once it’s built, that shell gets monetized for 30-plus years without ever repeating the upfront cost.

Servers and networking equipment are a shorter cycle: about 3 years to break even, with a useful life of five to six years, and Amazon has a track record of pulling those breakevens forward.

The negative free cash flow we’re seeing right now is the visible cost of building many data centers at the same time, before any of them are generating revenue yet. It is not a sign that AWS’s unit economics are deteriorating, the capital cycle has just not finished yet.

We’ve seen this pattern before from Amazon, and they have a track record of coming out of these heavy CapEx cycles a lot stronger than before.

The key is to watch the operating cash flows. Then watch whether or not CapEx goes back down as intended. If both of these things happen, free cash flows will explode in a few years.

Why I’m Bullish on Amazon in 3 charts

The pristine business within Amazon:

One of the fastest growing advertisement businesses globally:

Cash from operating activities booming, even if free cash flow is negative:

Final Thoughts

The positive far outweighs the negative this quarter for Amazon.

Free cash flow turned negative, yes. But we’re seeing proof of their heavy CapEx investments bearing fruits.

We’re also seeing a reacceleration of AWS, at an incredible scale.

And the advertising business booming.

I didn’t even go into the other business segments in this article, but let’s just say that they’re all doing pretty well right now.

The negative free cash flow is the temporary cost of building capacity for demand that is already contracted.

This quarter, Amazon blew it out of the park, and the best thing about it, was that it gave us evidence of future demand (with a massive backlog).

That’s all for today!

Get 40% off forever

Ready to take the next step? Here’s how I can help you grow your investing journey:

  1. Go Premium — Unlock exclusive content and follow our market-beating Quality Growth portfolio. Learn more here.

  2. Essentials of Quality Growth — Join over 300 investors who have built winning portfolios with this step-by-step guide to identifying top-quality compounders. Get the guide.

  3. Free Valuation Cheat Sheet — Discover a simple, reliable way to value businesses and set your margin of safety. Download now.

  4. Free Guide: How to Identify a Compounder — Learn the key traits of companies worth holding for the long term. Access it here.

  5. Free Guide: How to Analyze Financial Statements — Master reading balance sheets, income statements, and cash flows. Start learning.

  6. Get Featured — Promote yourself to over 24,000 active stock market investors with a 42% open rate. Reach out: investinassets20@gmail.com

☐ ☆ ✇ Invest in Quality

Broadcom: The AI Arms Dealer That Wins Regardless 💽

By: Invest In Assets 📈

Every AI investment thesis eventually runs into the same question:

What if you picked the wrong winner?

Nvidia versus custom silicon, Google versus OpenAI versus Anthropic, GPUs versus XPUs.

Broadcom’s entire investment case is built on not having to answer that question.

It sells the chips and the networking gear to nearly every serious contender in the race, and gets paid whether the customer wins, loses, or simply keeps spending to stay in the game.

The Q2 2026 results provided evidence that this isn’t just a narrative, it is already showing up in the numbers.


Moat: Diversified across the entire AI and Technology ecosystem

Broadcom does not rely on a single customer relationship.

It has six core AI customers - including nearly every serious AI lab and Hyperscaler.

Each of the customers are locked into multi year, multi-gigawatt commitments.

  • Alphabet has a long-term contract announced in April of 2026, for multiple generations of TPUs and AI networking.

  • Anthropic has access to over 1 gigawatt of Broadcom TPU-based compute in 2026, expanding to another 5 gigawatts of next-generation compute starting 2027.

  • OpenAI has silicon in production for late 2026, with a commitment of 1.3 GW in 2027 as part of a larger 10 GW agreement by 2029.

  • Meta signed a partnership in April for multiple generations of MTIA XPUs, targeting 3 GW deployed through 2028.

  • Two additional customers have already placed $6 billion in purchase orders for shipments beginning late 2026.

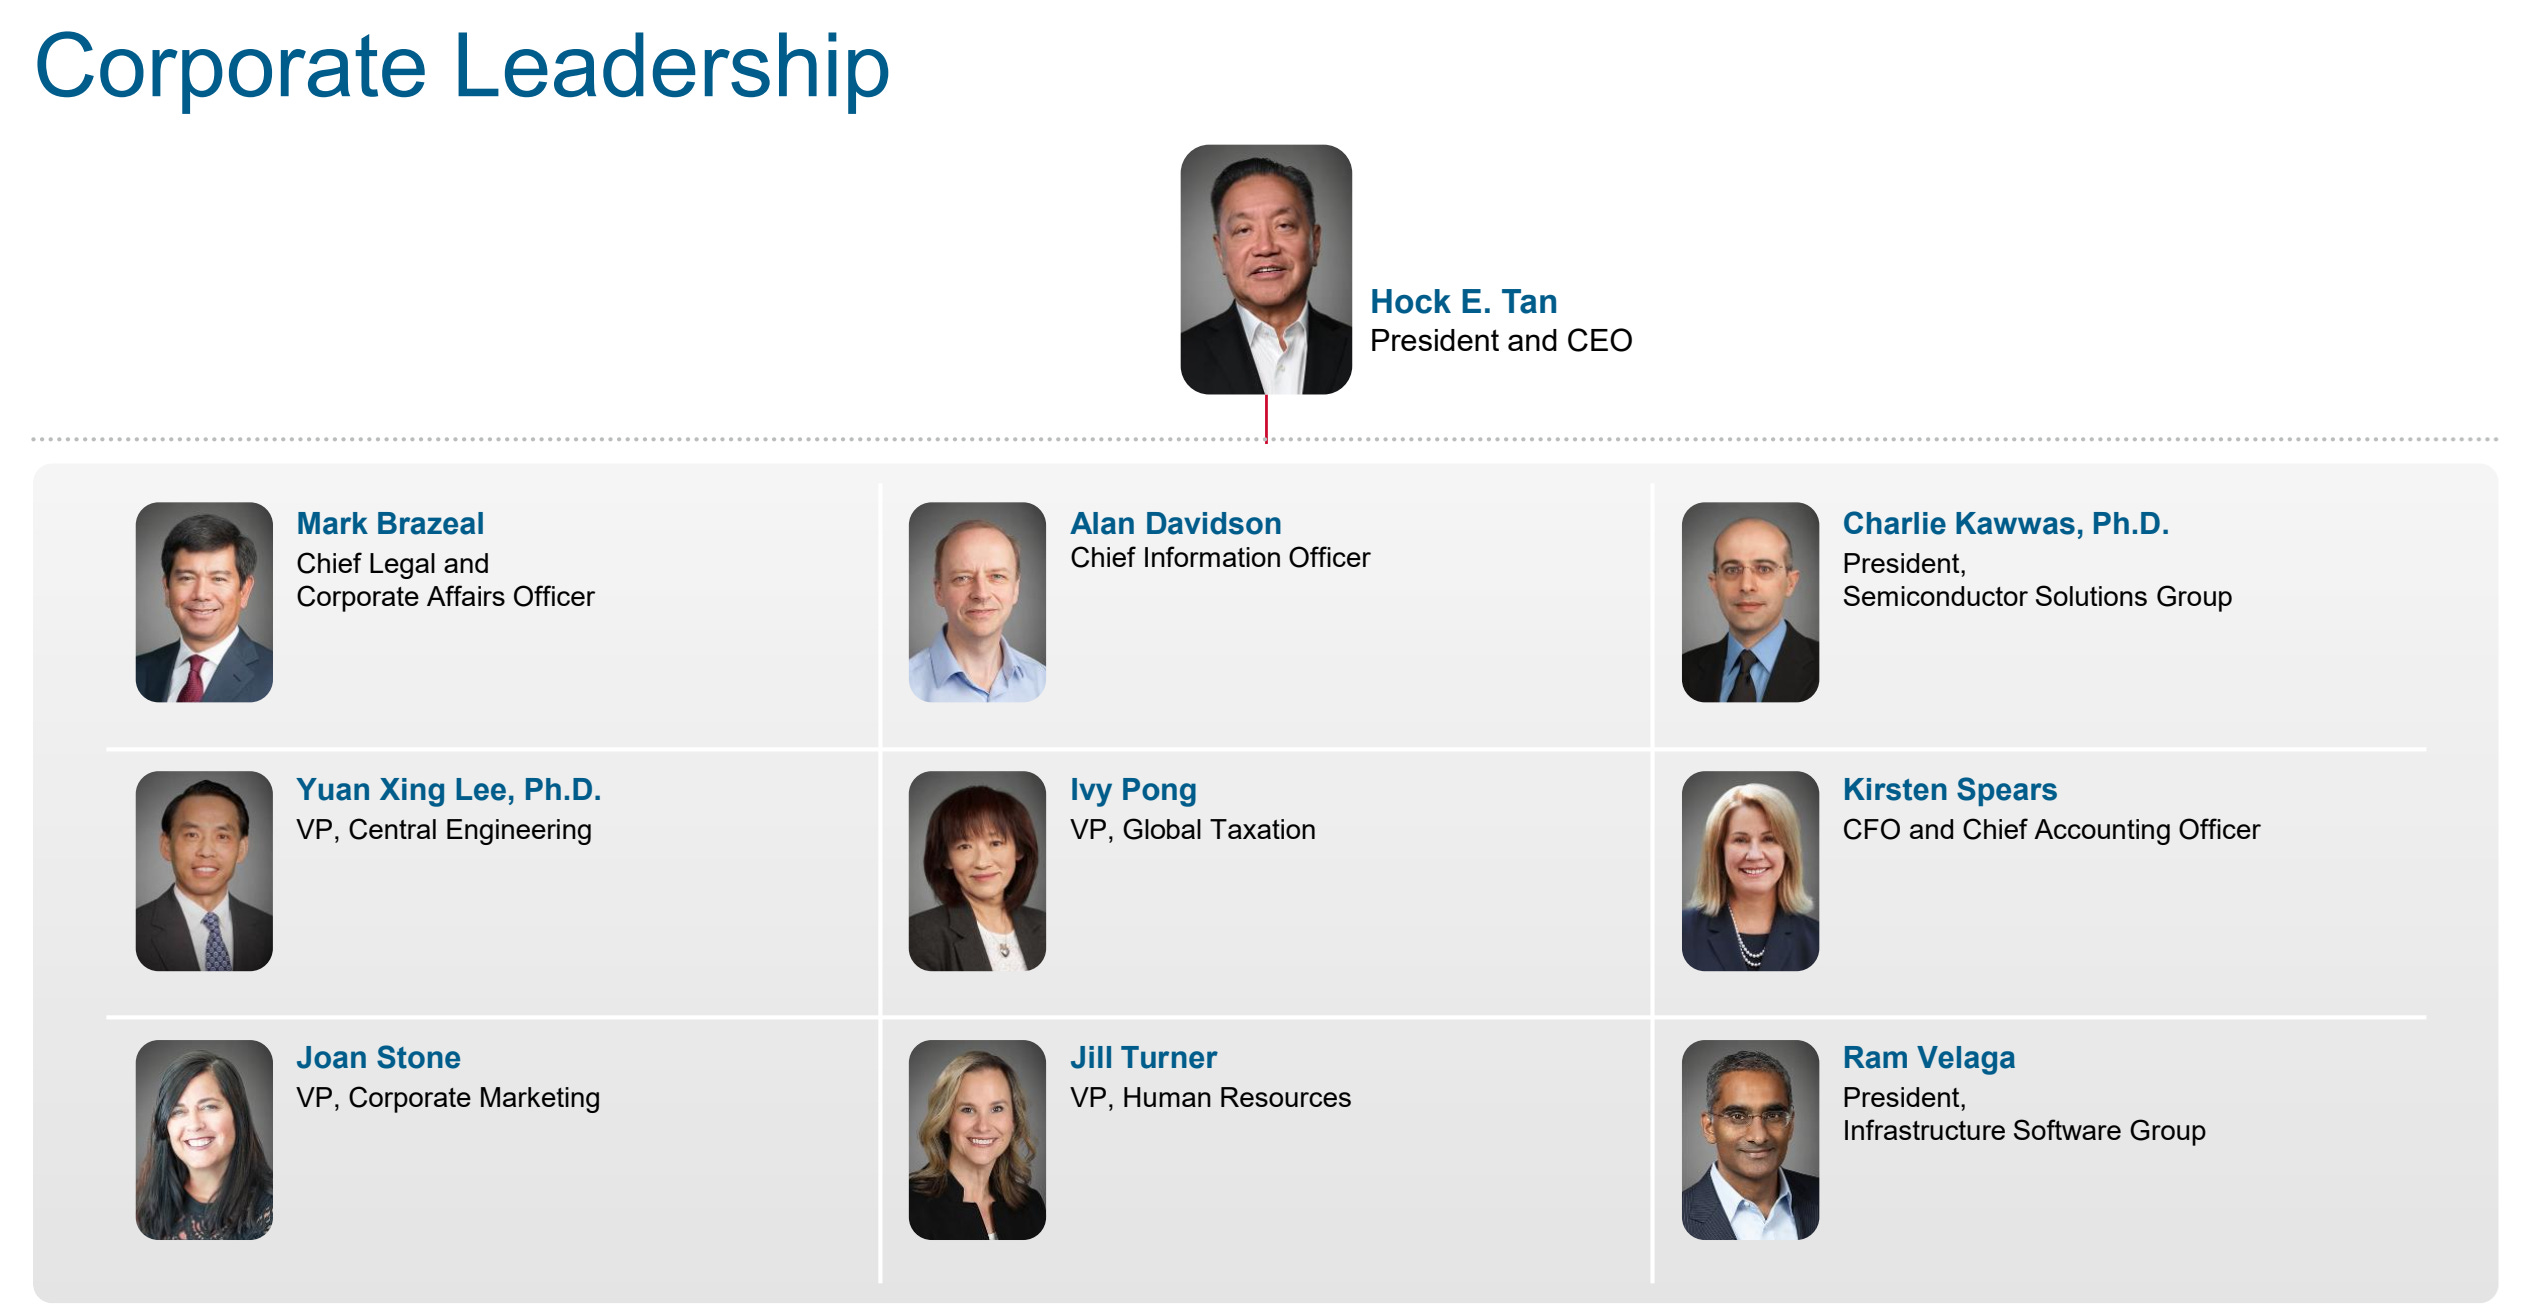
CEO Hock Tan was directly asked whether the new Google agreement secures Broadcom’s share against competitive risk. His answer was:

“We fully expect that there’ll be some diversity of sources for them.”

Tan is not claiming that Broadcom has a monopoly, instead, he is communicating that they don’t need one, because Broadcom is already embedded across the entire field of competitors.

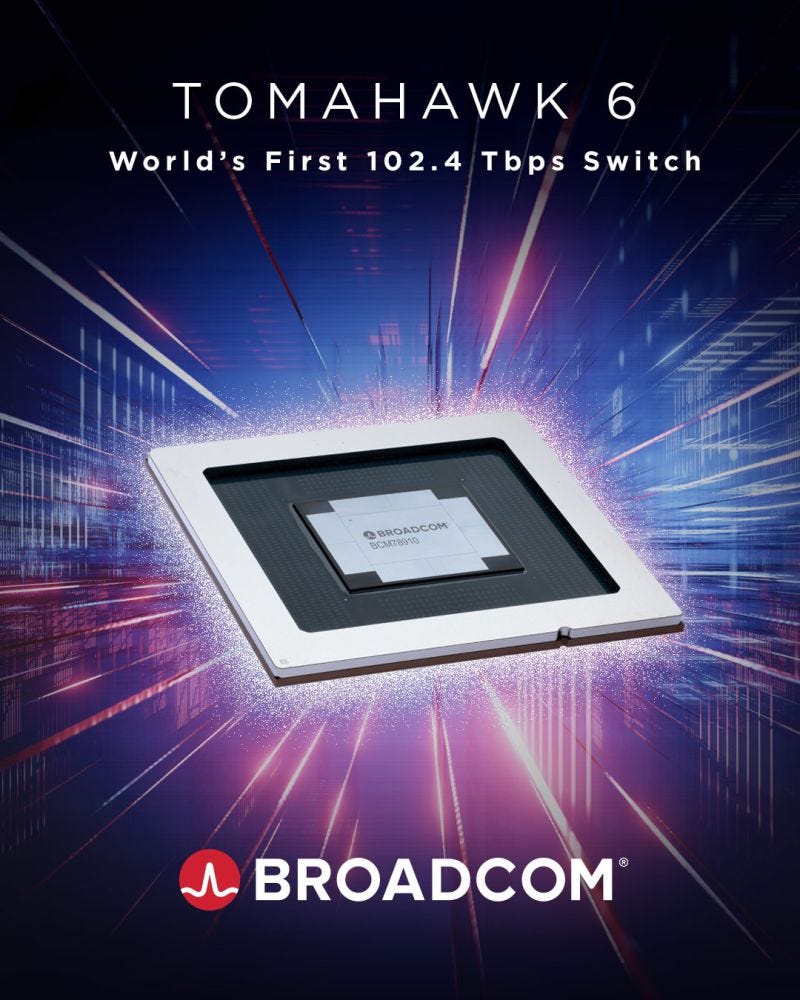
The moat is reinforced by a full-stack networking position that goes beyond chip design. Broadcom has been shipping the industry’s only 100-terabit Ethernet switch, the Tomahawk 6, for over a year, with a next-generation 200-terabit switch taping out this quarter.

Broadcom's Tomahawk 6: 102.4 Terabits/sec Ethernet switch | Aaron Bolthouse  posted on the topic | LinkedIn

Hock Tan stated on the Q2 earnings call:

“We are the de facto standard in the industry.”

Networking represented almost 40% of Q2 AI revenue, and management described demand for XPUs and networking together as “simply insatiable.

Notably, Broadcom has deliberately chosen not to compete in full AI systems or racks. Asked directly whether rack-scale versus chip-scale dynamics were shifting, Tan’s answer was: “No rack. It’s all chips.”

This matters for the moat. Broadcom stays a critical supplier to every systems builder rather than a competitor to any of them.

We’re running a summer sale now, where you can get -40% off an annual subscription. Read more about the Premium service here.

Get 40% off forever


Business model: Capital-light

Broadcom spent just $231 million on capital expenditures in a quarter that generated $10.5 billion in operating cash flow.

That’s the structural difference between owning fabs (TSMC) and designing chips that someone else manufactures.

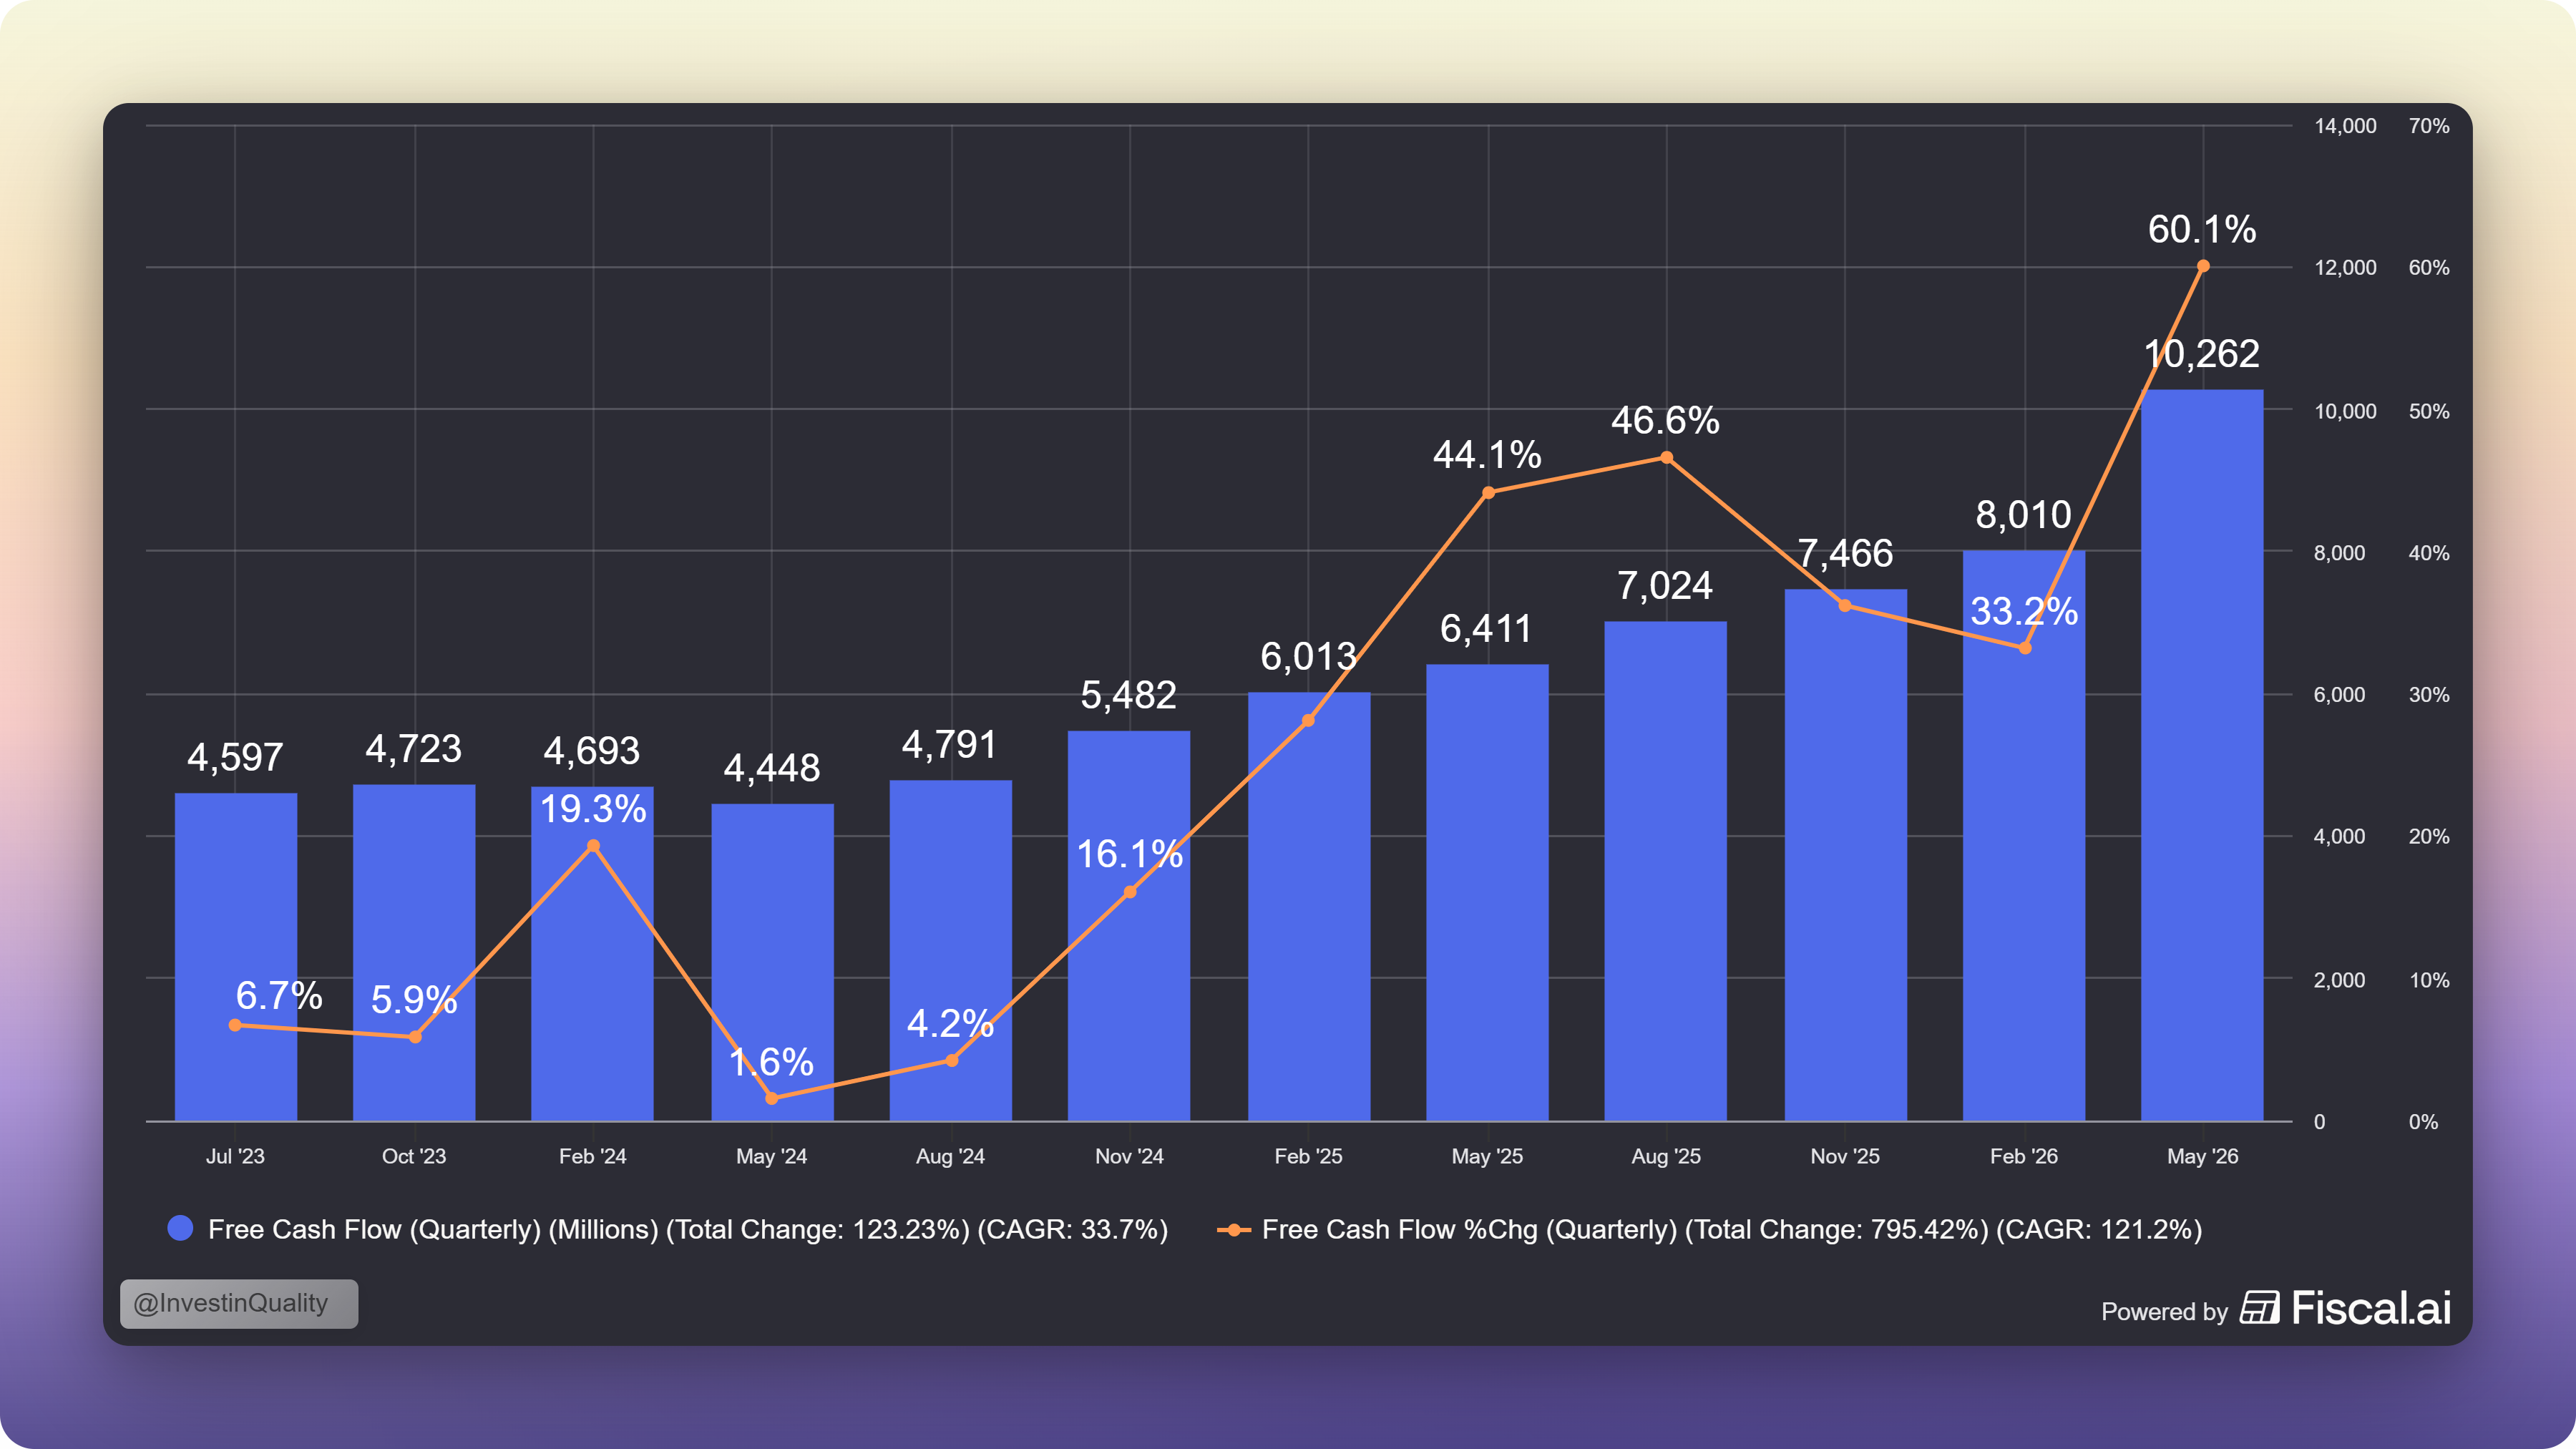
Free cash flow hit a record $10.26 billion, 46% of revenue, up 60% year-over-year.

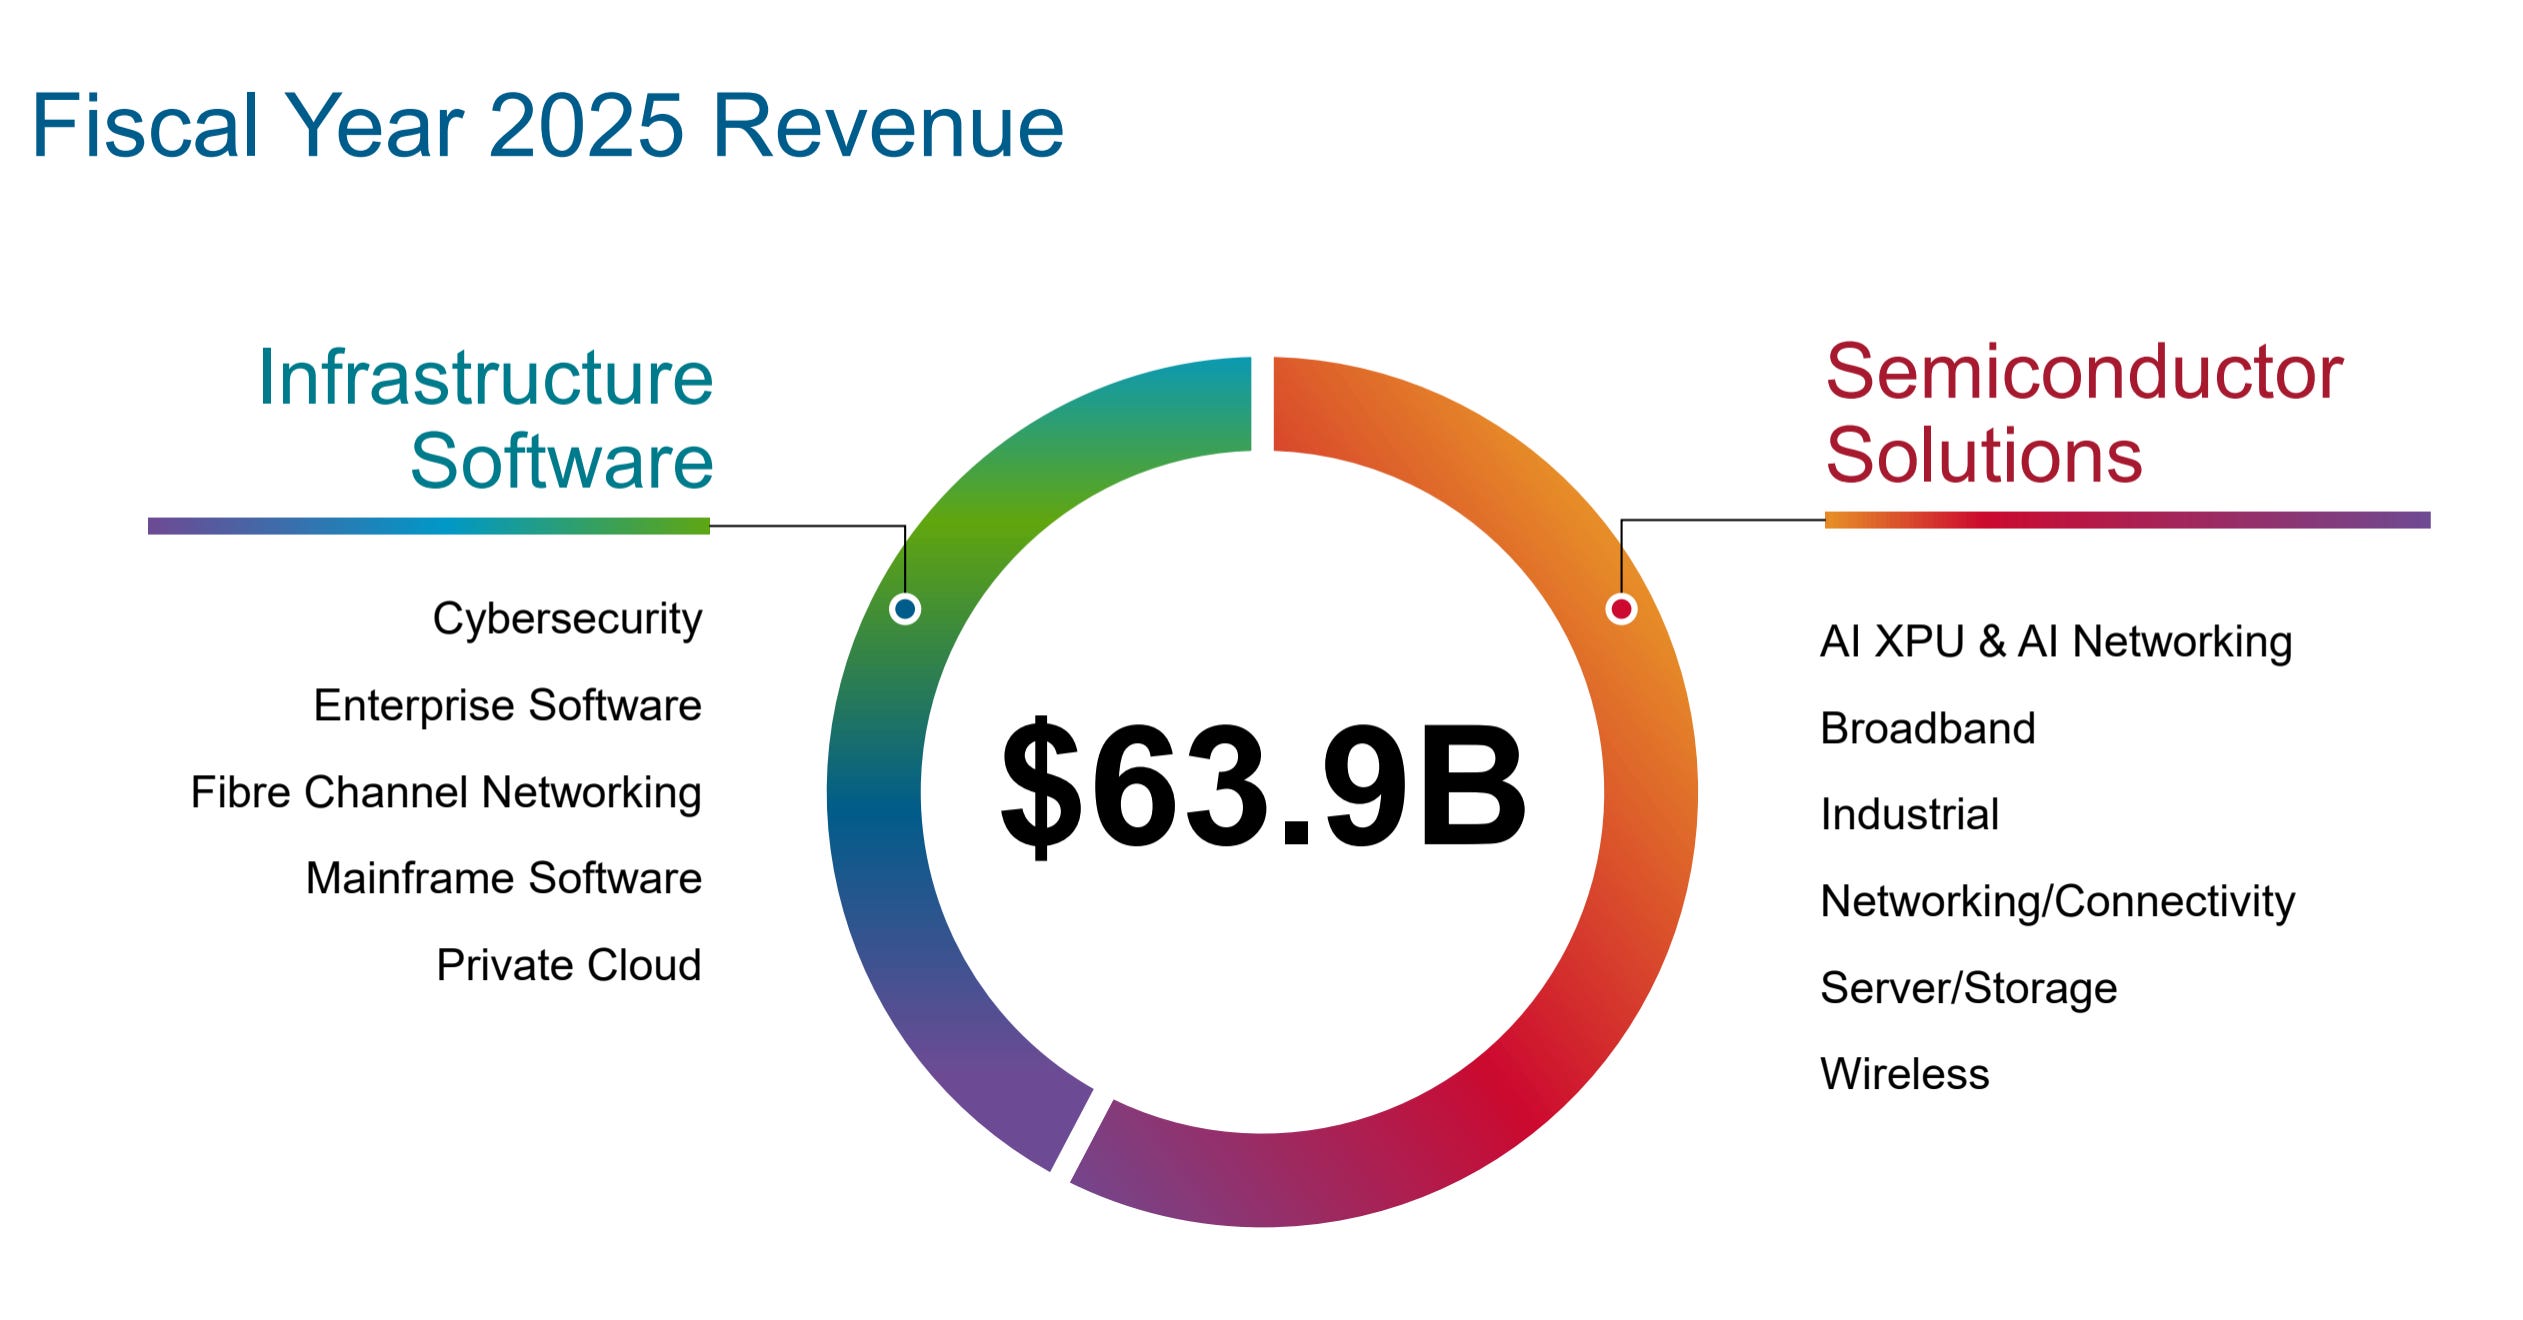
The segment split is:

  • Semiconductor Solutions (68% of revenue, up 79% year-over-year)

  • Infrastructure Software (32% of revenue, up 9% year-over-year)

One thing to note from the Q2 earnings call is that management has guided margins down to ~74% in Q3 (From 77.1% in Q2).

CFO Kirsten Spears was explicit that this is a product mix effect, and not deterioration of the business:

“This decline in gross margin does not represent a structural change in semiconductor margin. Rather, it reflects product mix between semiconductors and infrastructure software... We highly recommend that investors model semiconductor and infrastructure software margins separately.”

Operating margin is guided flat at 67% (The number that matter the most).

The most structurally interesting development this quarter is a new financing vehicle.

Broadcom is partnering with Apollo, Blackstone, and other investors to create an “AI XPU platform” designed to deploy more than 20 gigawatts of compute capacity through 2028, with a first tranche valued at $35 billion already being launched by Apollo.

The purpose is to let the best AI labs (Anthropic, OpenAI) access Broadcom-designed compute capacity without Broadcom having to carry all of that capital commitment on its own balance sheet.

It’s a new structure, and worth watching as it matures rather than assuming it behaves like a traditional customer financing arrangement.

Get 40% off forever


Management: Hock Tan’s fourth act

Every quarter, analysts ask some version of “can this last?” It’s the wrong question. Hock Tan has run this playbook before: “acquire, strip to the core, run for cash flow”, three times before, and each time the market underestimated him.

He took over what was then Avago in 2006, when the company was a roughly $1.7 billion Agilent spinout nobody outside the industry had heard of.

Over the next two decades he turned it into the operating model for the entire semiconductor sector: buy a company with real technology but bloated costs, cut what doesn’t drive margin, keep what does. What cash flows compound.

This pattern shows up in Broadcom’s previous deals.

LSI in 2013 gave Avago a storage and networking chip business it used to build scale. The 2016 Broadcom Corporation merger, a $37 billion deal, is the best example of the playbook in action.

Avago was the smaller company by revenue, but it kept the Broadcom name for the brand recognition and then ran the combined company on Avago’s leaner operating model.

CA Technologies and Symantec’s enterprise security business extended the same logic into software. VMware, a $69 billion deal that closed in 2023, was the biggest test yet of whether the model scales, and two years in, VMware is now 32% of revenue and growing.

This is not AI-specific moves, but it is disciplined execution from the management team, lead by Tan.

So, when Tan tells you AI semiconductor revenue is going from $56 billion in 2026, to an “excess of $100 billion” in 2027 - we should listen.

The one real open item is the CFO seat. Kirsten Spears is retiring June 12 after 12 years in the role, handing off to Amie Thuener. Both were on the call together, which is the right way to do a transition, but a 12-year CFO of Kirsten’s caliber is a hard act to follow.


Growth: The backlog is building

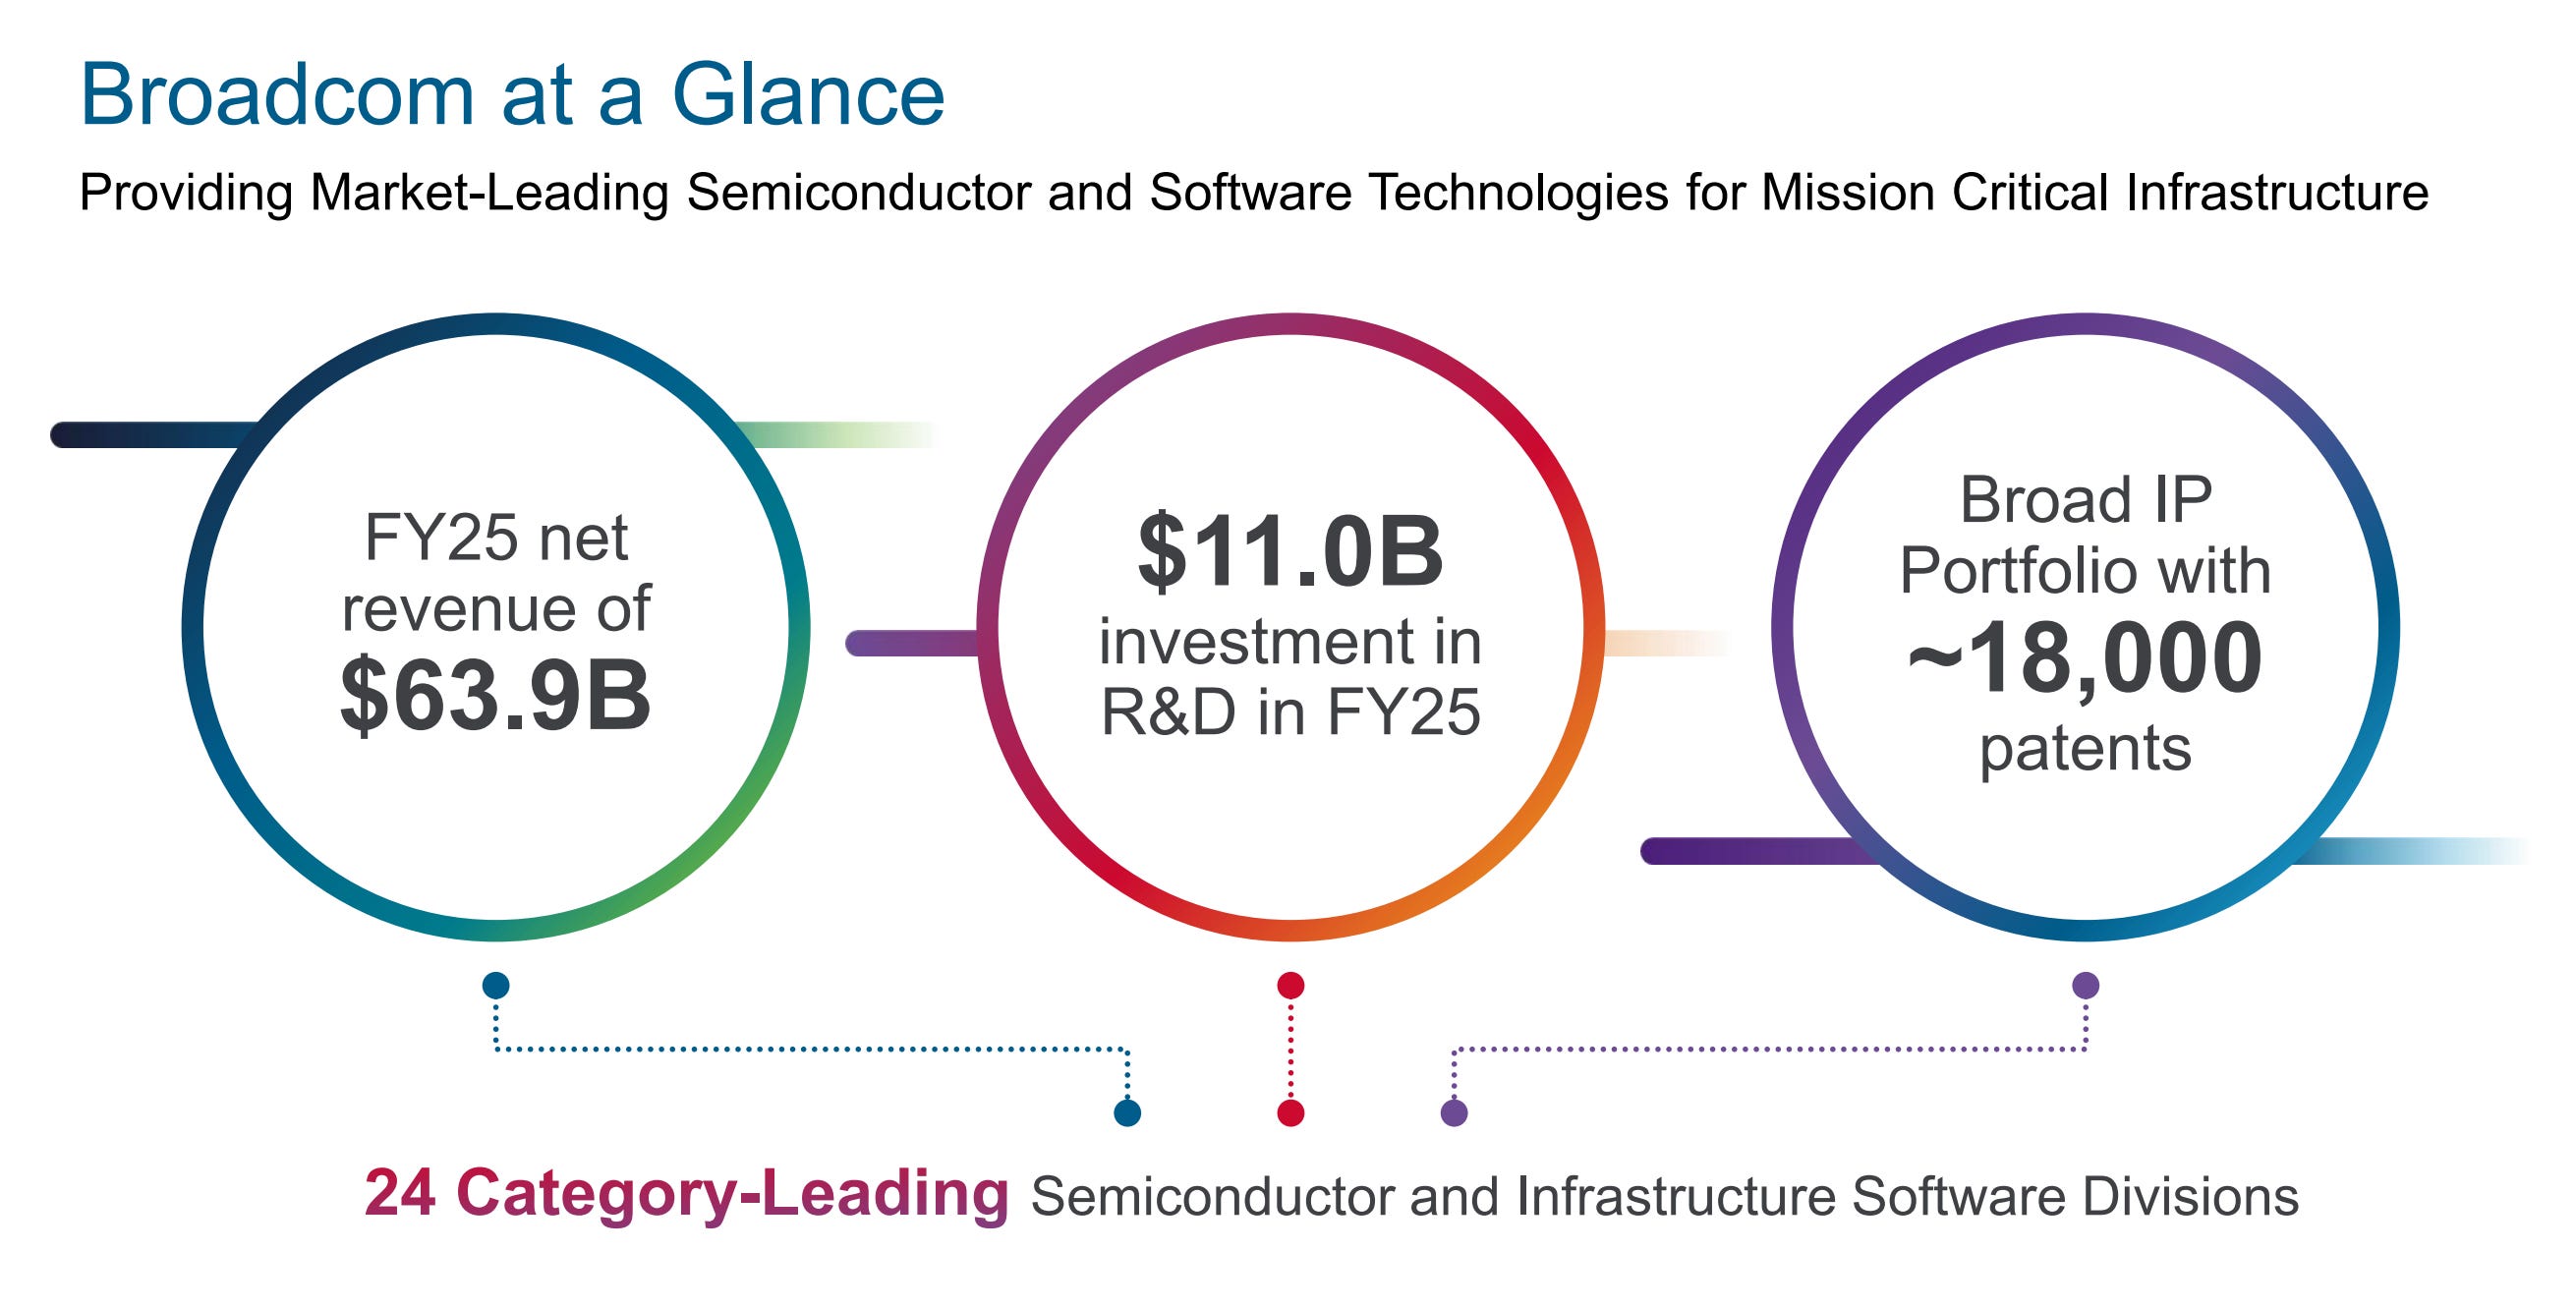
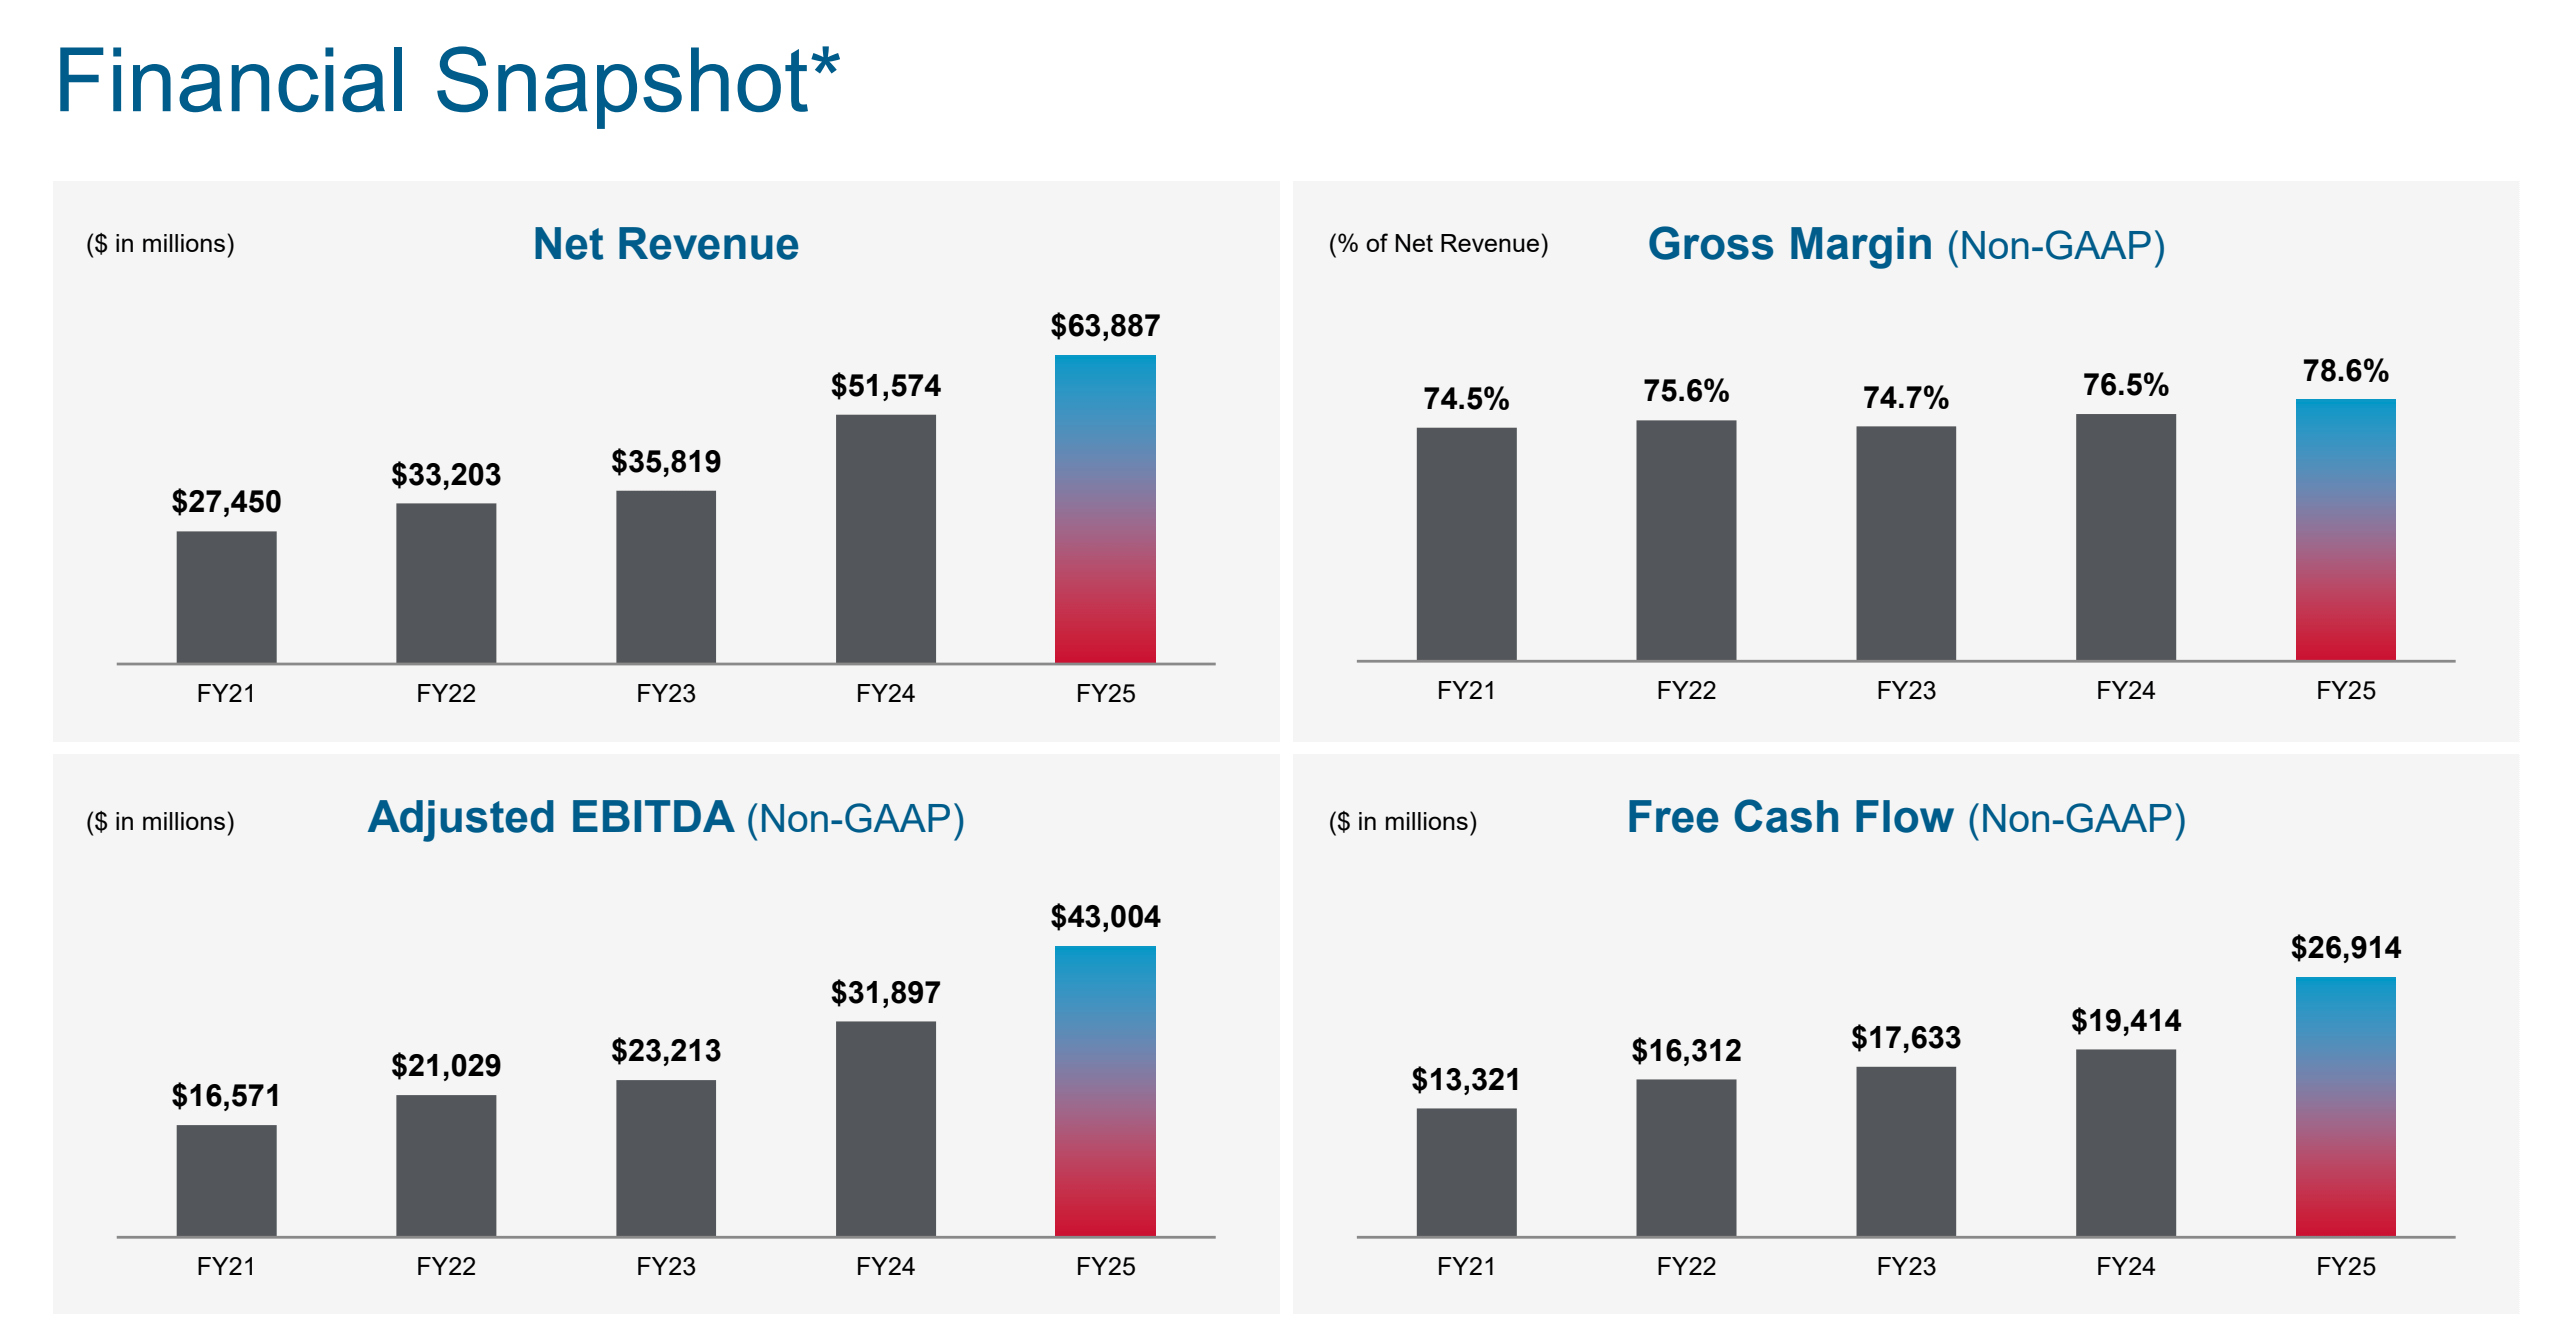
Broadcom’s financial snapshot shows how the business is growing rapidly, both from a revenue, earnings and cash flow perspective.

Most companies report growth as a single number: revenue, up X%. That number tells you what already happened. It doesn’t tell you what happens next. Two data points in this print tells us more about the future:

The first is book-to-bill.

In Q2, Broadcom booked over $30 billion in AI semiconductor orders against just $10.8 billion actually shipped. That’s roughly a 3-to-1 ratio.

A book-to-bill ratio this high means customers are placing orders three times faster than Broadcom can fill them, which is the opposite of a company drawing down an existing backlog to manufacture growth.

If bookings had fallen and shipments stayed flat, that would be a company working through old orders with nothing new coming in behind it.

For Broadcom, the queue is getting longer.

The second is this line from the call:

“Our visibility runs all the way to 2028 right now. Three months ago, I can tell you our visibility ran pretty much 2027.”

That’s customers locking in capacity commitments an entire year further out than they were three months ago.

A revenue beat can come from one big customer pulling forward an order. A visibility window that extends by a full year across the customer base is a much harder thing to manufacture, and a much stronger signal that demand is structural rather than lumpy.

The numbers underneath both of these points are strong on their own. Q2 AI semiconductor revenue hit $10.8 billion, +143% YoY and above management’s own forecast.

Q3 guidance calls for $16 billion, up over +200% YoY.

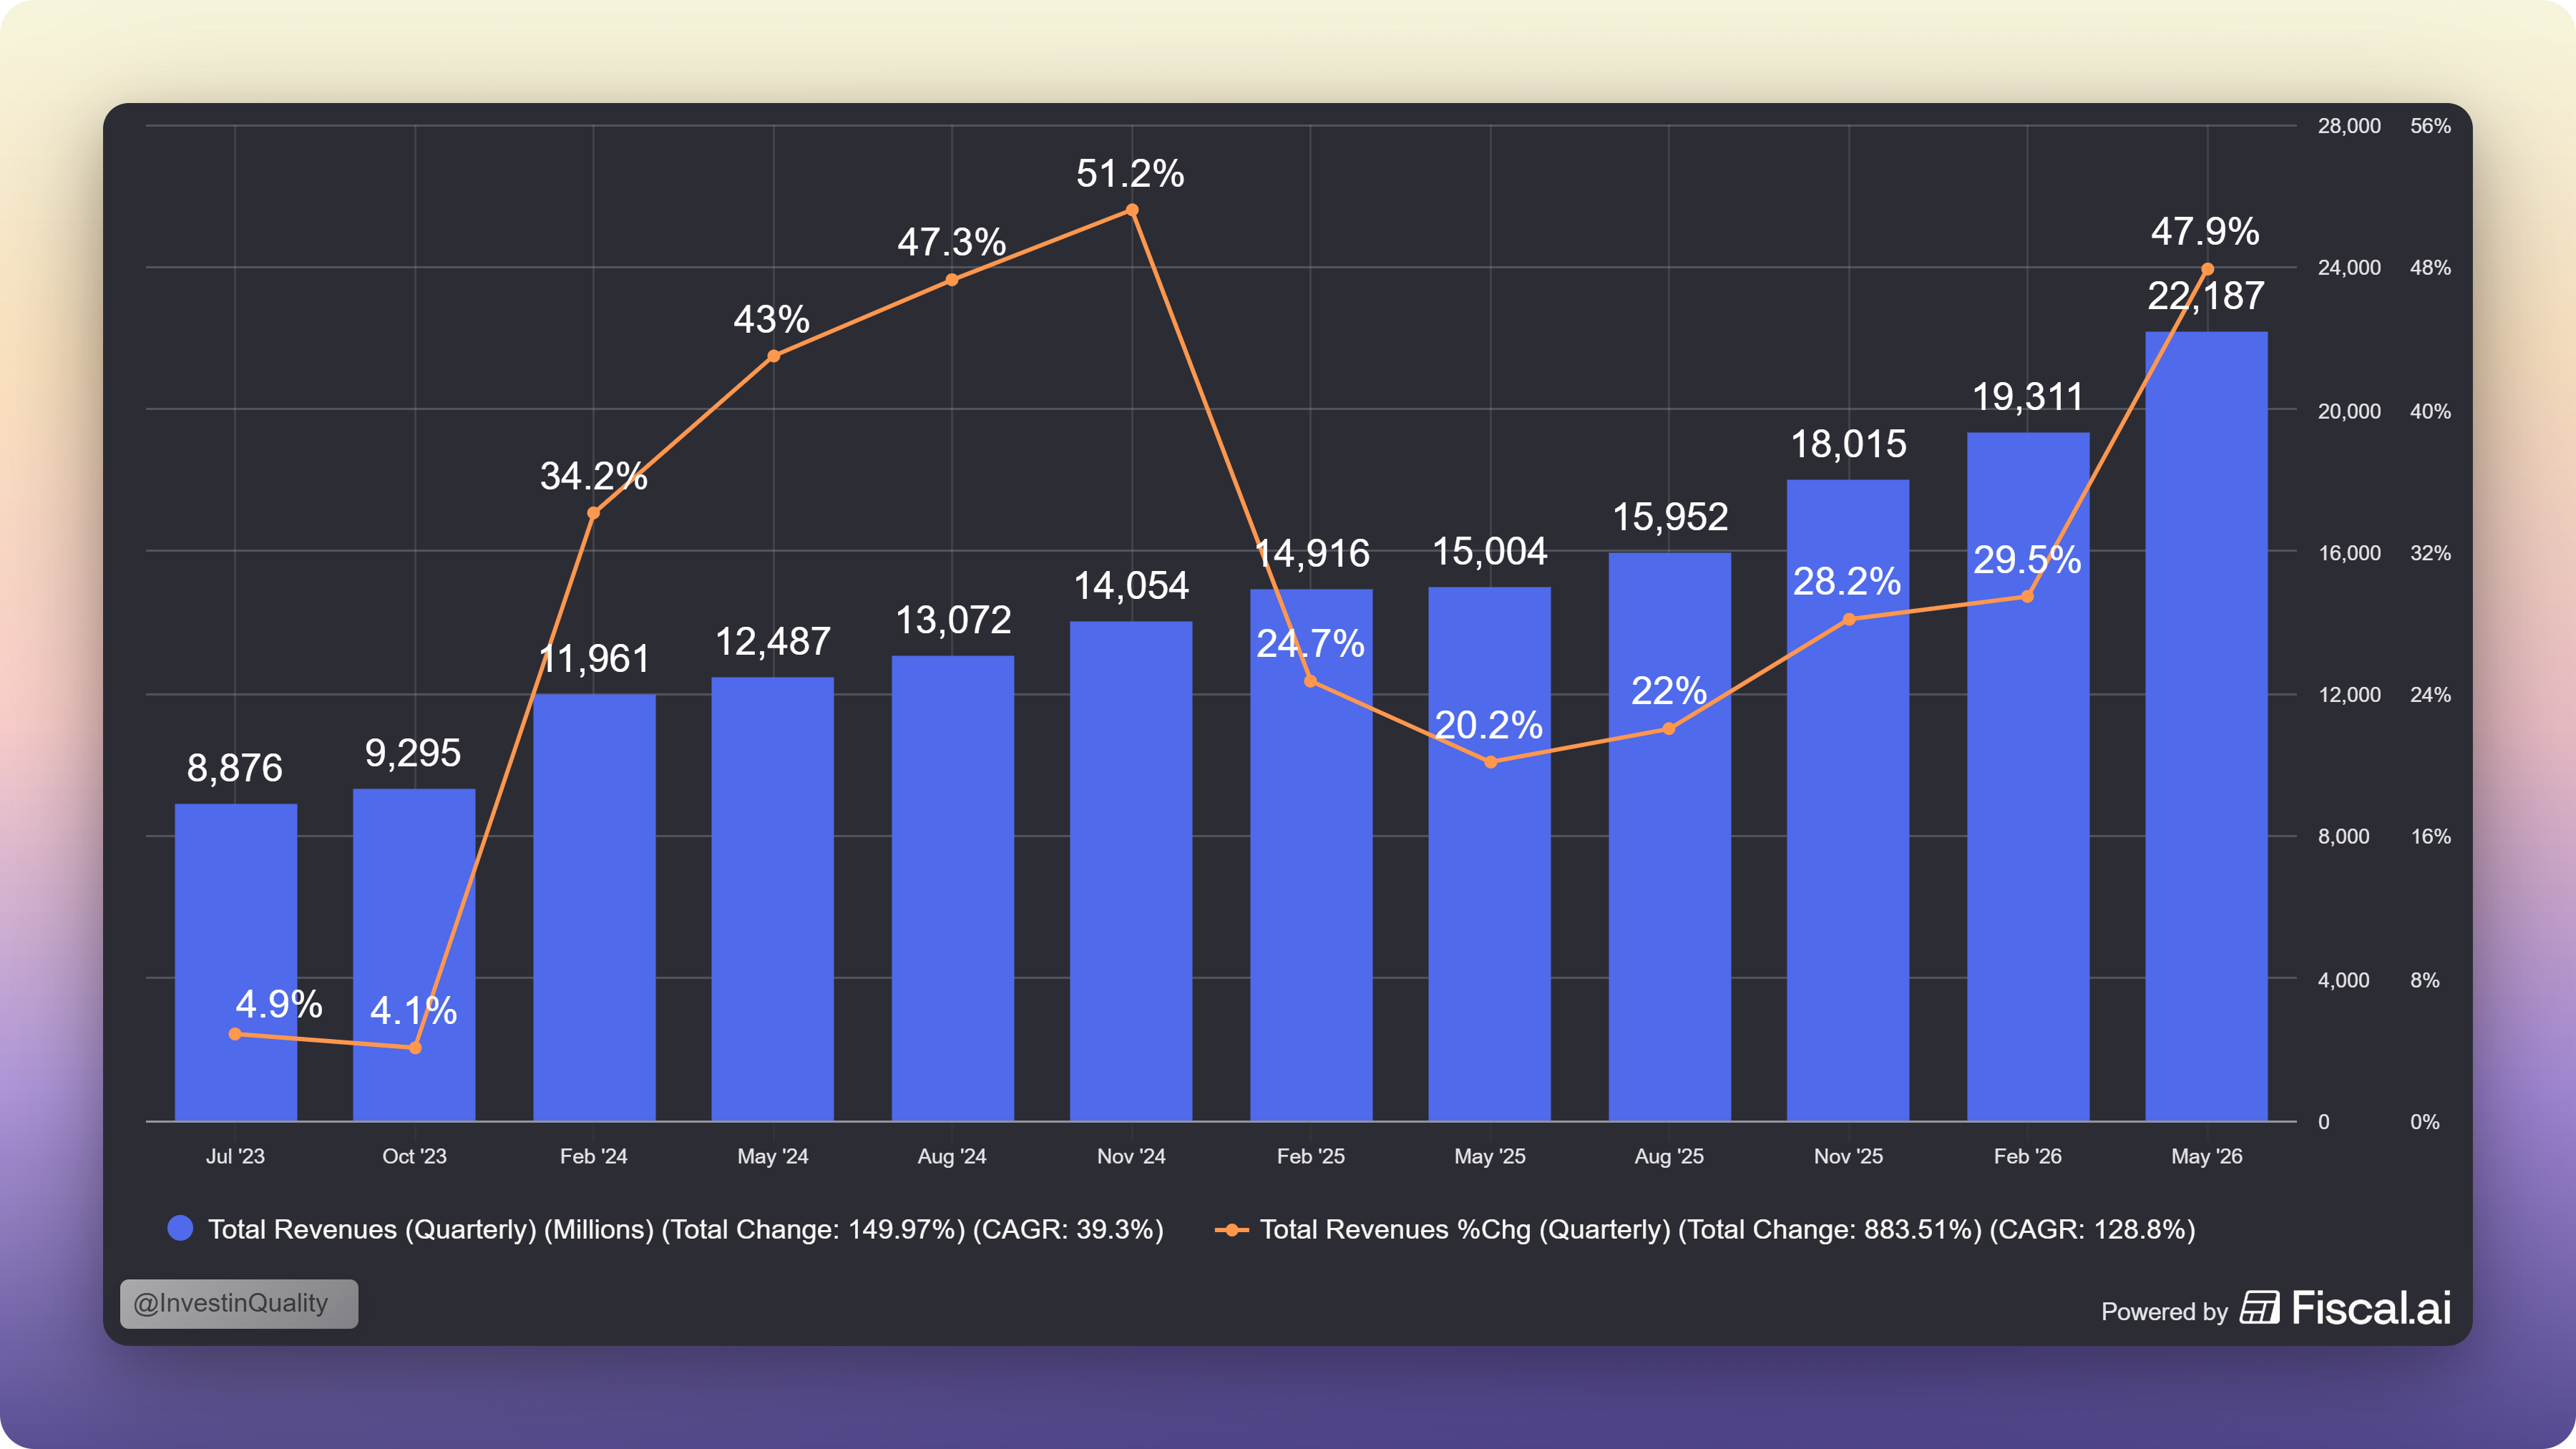
Full-year 2026 AI semiconductor revenue is guided to $56 billion, up ~+180% from 2025, and management reiterated 2027 guidance of “in excess of $100 billion.” Total consolidated revenue was $22.2 billion in Q2, a record, +48% YoY, with Q3 guided to $29.4 billion.

However, the book-to-bill ratio and the expanding visibility window are the two numbers that tell you whether next year’s guide is believable.

Both point the same direction.


Valuation: Fair price if you believe the growth story

Broadcom trades at roughly 24x forward earnings against a 41.2% long-term expected EPS growth rate. That’s a PEG of about 0.58. For context, that’s meaningfully cheaper than ASML.

But the more important point isn’t the number, it’s what’s behind it. Two companies can carry the same PEG ratio and not be equally cheap, because the quality of the growth assumption is different.

ASML’s growth sits in a backlog of tool orders that takes years to convert into machines shipped and revenue recognized. A lot can happen to that backlog between now and then: customers can push out capex, delay construction, or reprioritize.

Broadcom’s growth is already landing in the current income statement. It’s backed by a 3-to-1 book-to-bill ratio and customer-by-customer gigawatt commitments that management disclosed in enough detail to sanity-check independently on the call. Same discount to growth, less distance between the assumption and the cash.

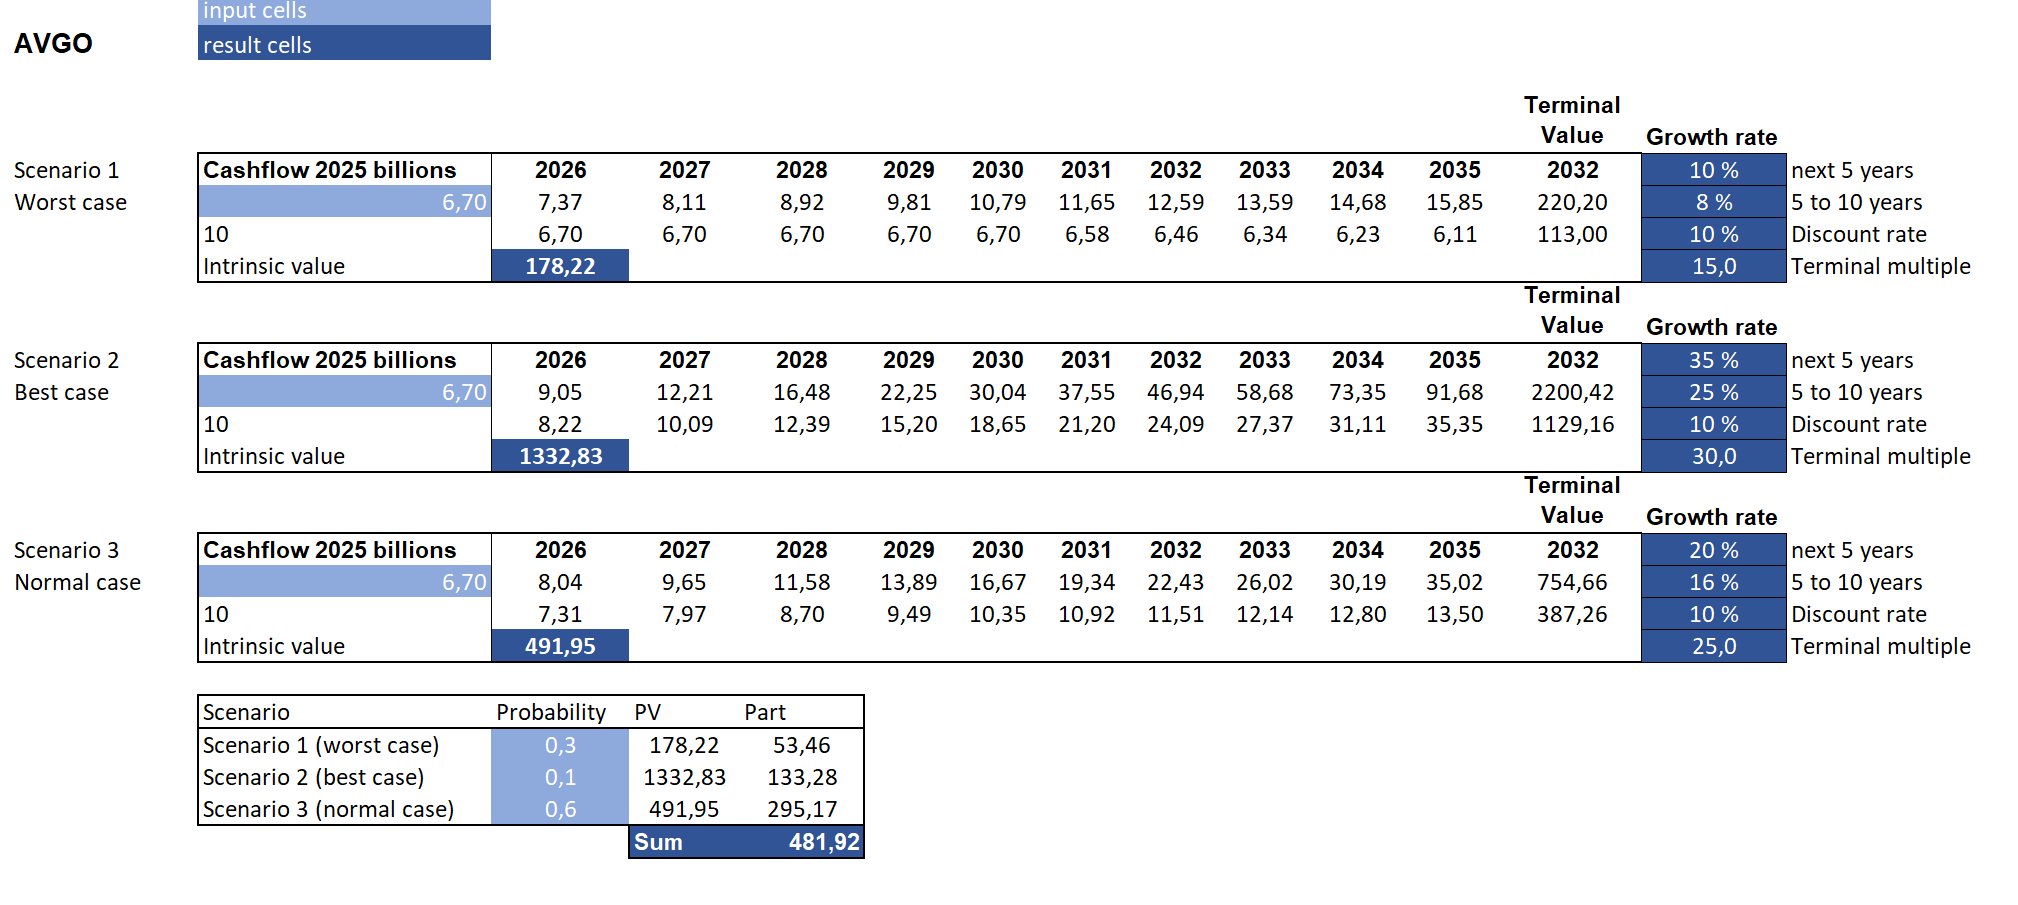
Here are my 3 valuation scenarios for Broadcom:

The rest of this article, including our next three picks and bonus, is for Premium subscribers only.

We’re running a summer sale now, where you can get -40% off an annual subscription. Read more about the Premium service here.

Get 40% off forever

  • Fair value estimate: $481.92

  • Current price: $393.29

  • Upside: 22.5%

  • CAGR from base case: 14%

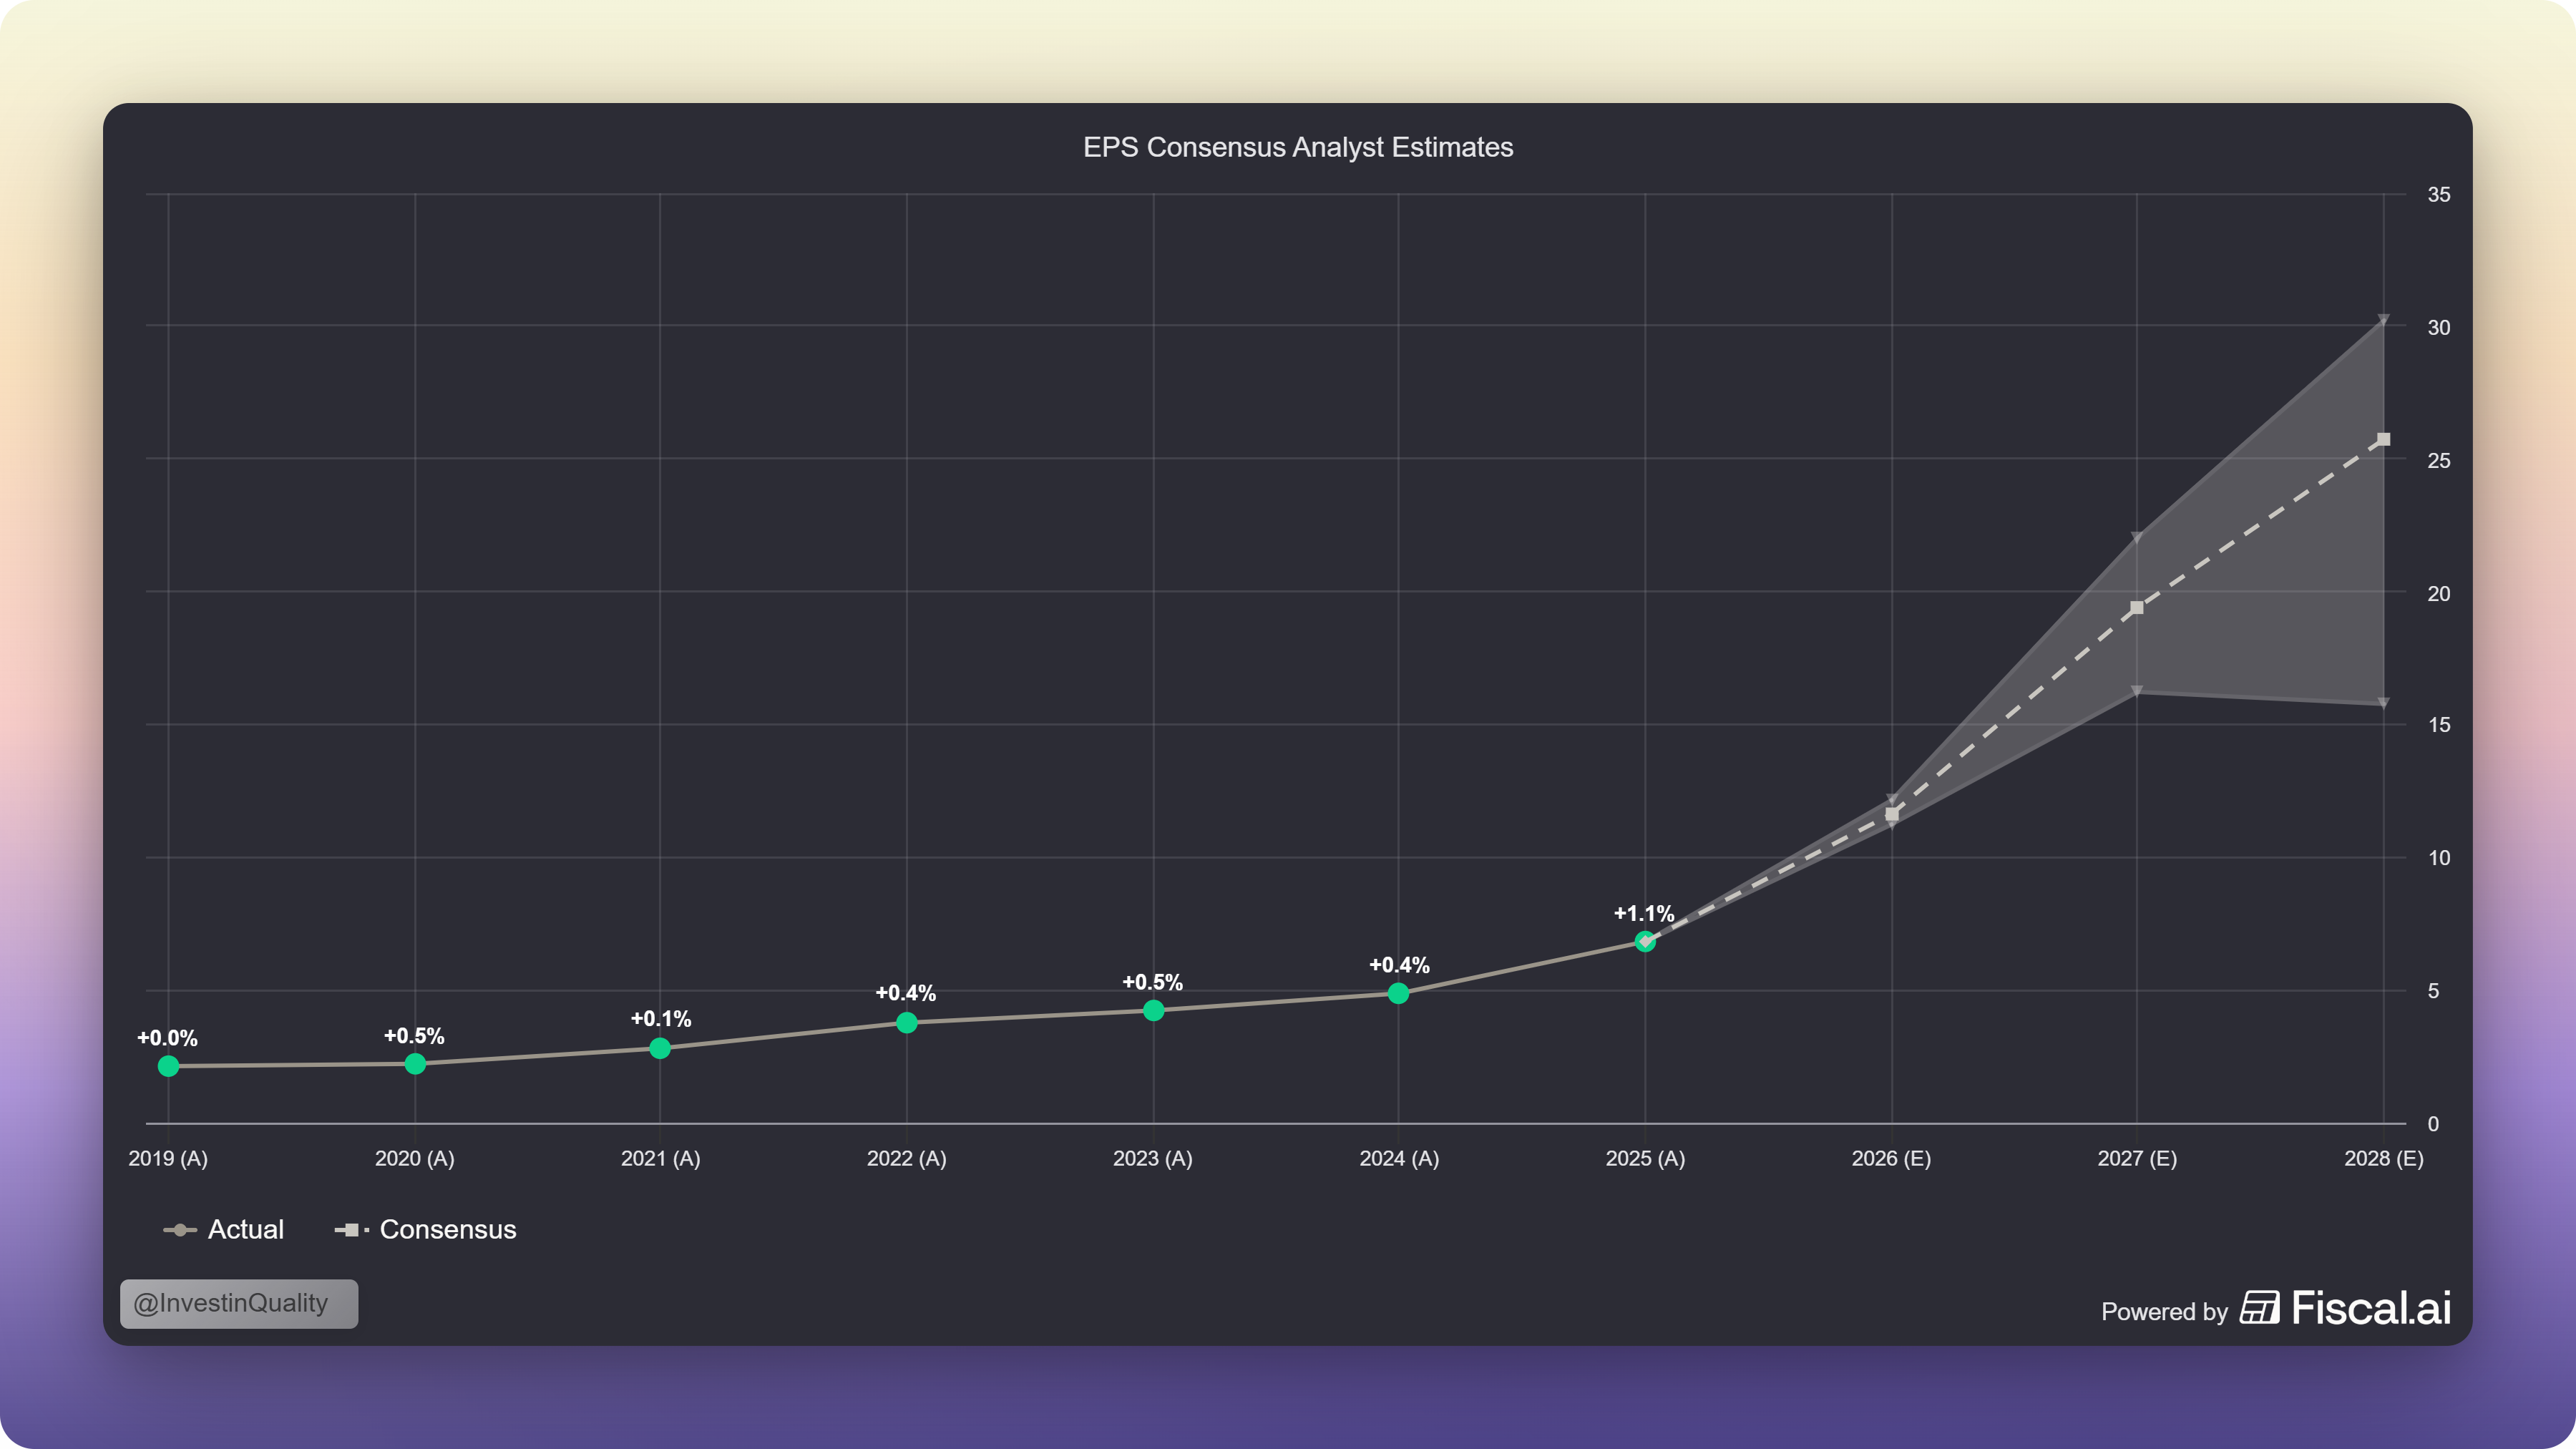
My DCF is conservative. I don’t want to model in a 41.2% long term EPS growth, but the near term earnings expectations are even higher than this, in the 60-80% range.

The key risk to the valuation of Broadcom is that the AI capex narrative holds. Any break in the story can trigger a rerating of Broadcom and the rest of the AI value chain.

So, to be direct, Broadcom has significant upside if the growth story plays out, but with the down side risk if the narrative shifts in the coming year or two.

Despite this, Broadcom is well positioned to benefit from the current market demand, and is an excellent way to get exposure to the ‘AI buildout’.


Key risks

Customer concentration is the largest risk.

Six customers drive essentially all AI revenue. Tan was asked directly whether the new Google agreement locks in Broadcom’s share, and his answer was that Google will maintain “diversity of sources.” That’s Tan being honest, not evasive: Broadcom will not win every design at every customer, even its most strategic one. A single lab deciding to bring more silicon in-house, or shifting spend toward a competitor’s design, would show up fast in a business this concentrated. This is the risk to actually watch.

The Apollo and Blackstone AI XPU financing vehicle is new and untested.

Structuring $35 billion, and eventually over 20 gigawatts, of compute capacity funding through third-party investors rather than Broadcom’s own balance sheet is not a traditional customer contract. It lets frontier labs access capacity without Broadcom carrying the capital commitment, which is elegant in theory. But there’s no track record for how a vehicle like this behaves across a full spending cycle, a downturn, or a customer default. Worth watching closely as it scales rather than assuming it behaves like a normal financing arrangement.

The gross margin contraction guidance is a headline risk.

Consolidated gross margin is guided down to roughly 74% in Q3 from 77.1% in Q2. CFO Kirsten Spears was explicit that this is a mix effect between semiconductor and infrastructure software, not margin compression, and that operating margin, the number that actually matters, is guided flat at 67%. The risk isn’t the number itself. It’s that a market that has already punished this stock on guidance technicalities before might react to the headline print before anyone reads the explanation underneath it.


The takeaway

Broadcom doesn’t need to guess who wins the AI race. Google, Anthropic, OpenAI, Meta, it’s building the chips and the networking for nearly all of them, and it gets paid regardless of which architecture ends up on top.

This is what makes Broadcom such a strong investment case for exposure to the AI-boom.

A 3-to-1 book-to-bill ratio means the backlog is getting longer. A visibility window that stretched from 2027 to 2028 in three months means customers are locking in years of capacity.

Those two data points matter more than any single quarter’s revenue beat, because they tell you next year’s guidance is grounded in something real.

And the man running it has done this before. Four times, actually, each one bigger than the last, each one hitting the numbers he committed to. That track record is worth something when he tells you AI revenue doubles again next year.

None of that makes this risk-free. Six customers still drive almost all the AI revenue, the Apollo financing structure is unproven, and the market may still flinch at a gross margin headline that doesn’t deserve the reaction. But at a PEG of roughly 0.58, backed by growth that’s already showing up in the income statement rather than sitting in a backlog waiting to convert, this is priced like the outcome is still in doubt.

It isn’t. That’s the opportunity.

Ready to take the next step? Here’s how I can help you grow your investing journey:

  1. Go Premium — Unlock exclusive content and follow our market-beating Quality Growth portfolio. Learn more here.

  2. Essentials of Quality Growth — Join over 300 investors who have built winning portfolios with this step-by-step guide to identifying top-quality compounders. Get the guide.

  3. Free Valuation Cheat Sheet — Discover a simple, reliable way to value businesses and set your margin of safety. Download now.

  4. Free Guide: How to Identify a Compounder — Learn the key traits of companies worth holding for the long term. Access it here.

  5. Free Guide: How to Analyze Financial Statements — Master reading balance sheets, income statements, and cash flows. Start learning.

  6. Get Featured — Promote yourself to over 24,000 active stock market investors with a 42% open rate. Reach out: investinassets20@gmail.com

☐ ☆ ✇ Invest in Quality

Factsheet July 2026 📈

By: Invest In Assets 📈

Hello, partner 👋

July was a month where our core holdings did everything right.

  • Constellation Software soared higher.

  • Amazon didn’t just beat estimates; it obliterated them.

  • Alphabet posted numbers that would send the stock up by a lot in any other period.

The Quality Growth portfolio increased by 1.13% in July, marking the 4th consecutive positive mont…

Read more

☐ ☆ ✇ Invest in Quality

5 Undervalued Quality Stocks 💎

By: Invest In Assets 📈

Hi partner! 👋🏻

Welcome to the July edition of Top 5 Buys.

You can access our Top 25 Buys for 2026 list as a premium member here.

In this article, we will discuss our top stock picks for July 2026.

Let’s get into it 👇

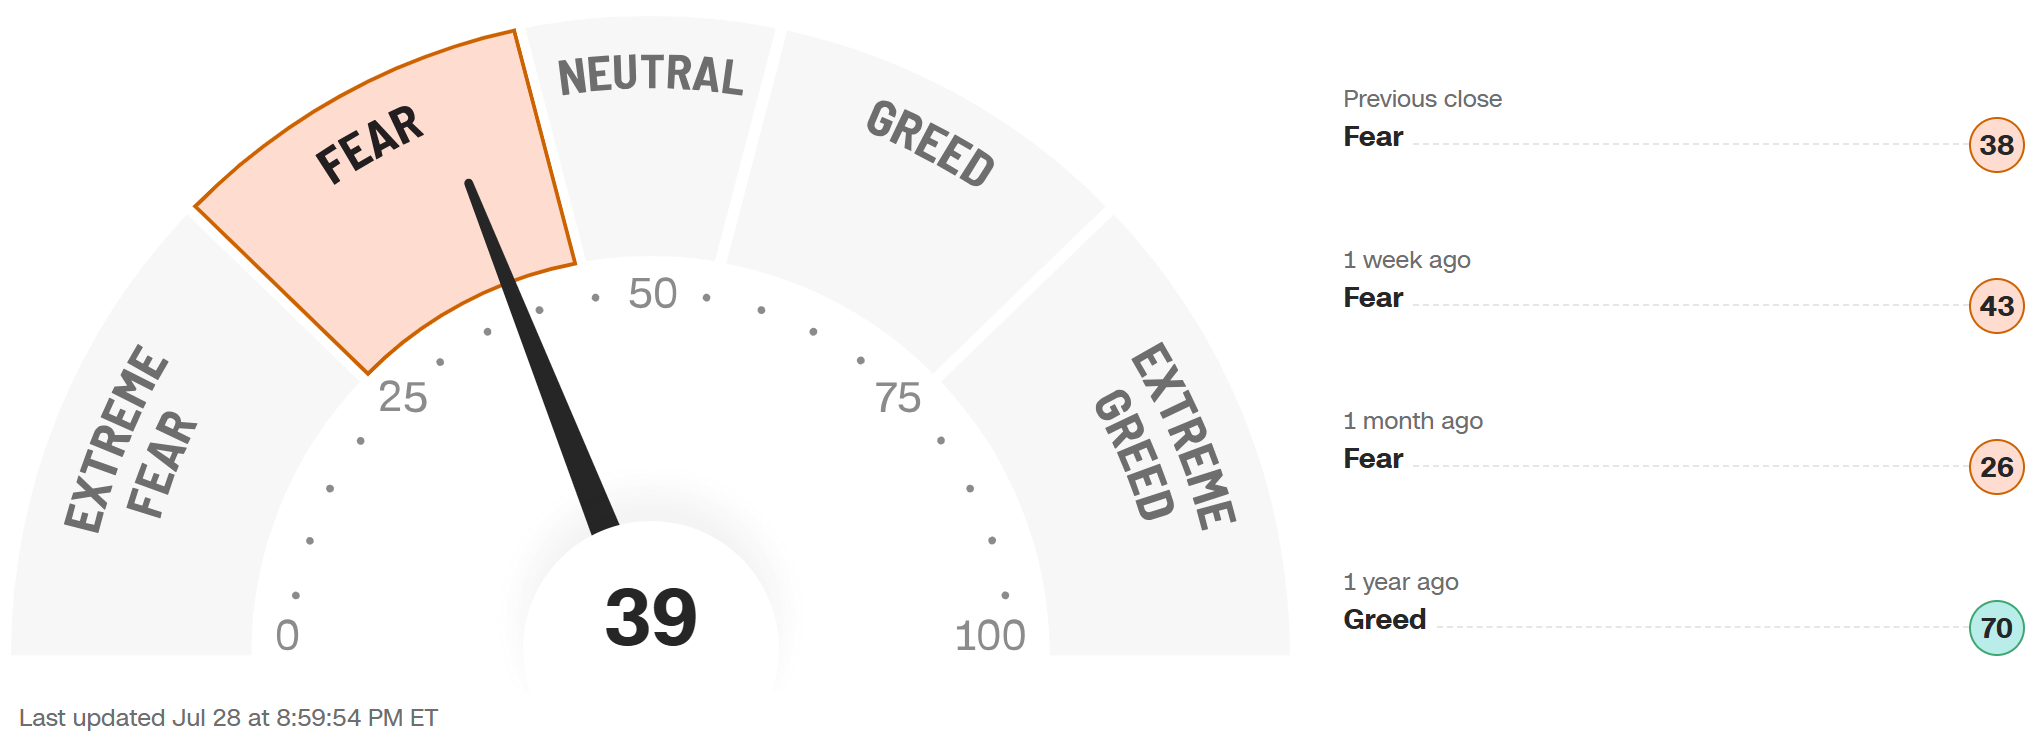
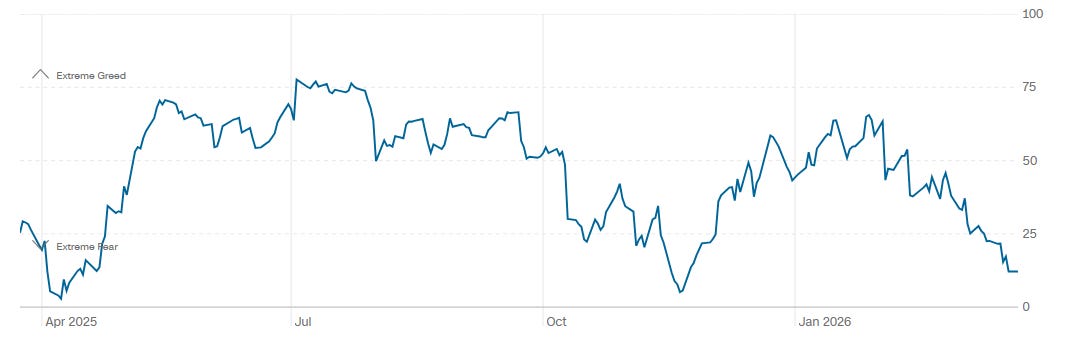
The Market Sentiment: Fear

The “Fear to Greed” index is currently at 39.

This is basically the same as last month, but just with a new headline.

This time, semiconductors are getting smoked.

The market has been cautious for a while, only having brief moments in greed, and no time in extreme greed in the last 12 months.

The market is on edge. And it shows in the current earnings season. Great results with a small negative caveat? Stock is going down.

This month’s top 5 picks contains incredibly strong fundamental businesses, selling at very low prices (relative to historical points).

The price disconnect has little to do with the fundamental performances of the businesses, and more to do with the prevailing narratives in the markets.

The market is scared and uncertain, but these businesses keep delivering, and will keep delivering in the years to come.

Here are this month’s Top 5 Buys, plus a bonus 👇

This is not investment advice. Always conduct your own due diligence and make your own investment decisions.

Get 40% off forever

Top 5 Quality Buys July 2026 🚀

Accenture 🖥️

Accenture had its largest one-day drop in its history, on a quarter that was ok (Not horrible).

The stock dropped 18% in a single session on June 18th.

Revenue grew, margins expanded, and the company generated $3.6 billion of free cash flows.

So why did the stock fall so much?

Declining bookings (indicating negative future revenue), management cut guidance, and AI cannibalization fears - the declining bookings fed into this fear. Management had stated earlier that companies will need Accenture to installing AI for clients, but this data point was interpreted as proof of the AI narrative.

The business model

Accenture has always been the global market leader for technology consulting.

They help the best (and the biggest) companies in the world integrate new technology, set their strategy, and do the work outside of the company’s core competency.

The benefit of Accenture supporting technological integration projects is that they embed themselves into the clients operations, and switching becomes hard and painful.

This approach has served the business well.

Accenture serves clients in more than 120 countries and has ~774k employees - this creates a scale advantage that few competitors can match.

However, the market’s fear is real. If AI can do the labor intensive work, Accenture will not be able to bill hourly for that work like it has in the past.

We believe that this is true to some degree, but that the effects over the coming few years is greatly overstated.

The jury is still out on how effective AI will be for businesses, but in our experience, there is still a massive need for consultants - especially now, when things are changing more rapidly than ever.

Many companies are facing existential challenges, and need to set new strategic ways, set up their tech stack, figure out how to effectively integrate AI into their organization for it to actually drive results.

We believe that Accenture is the best positioned global consultancy business to capitalize on this, once the dust has settled.

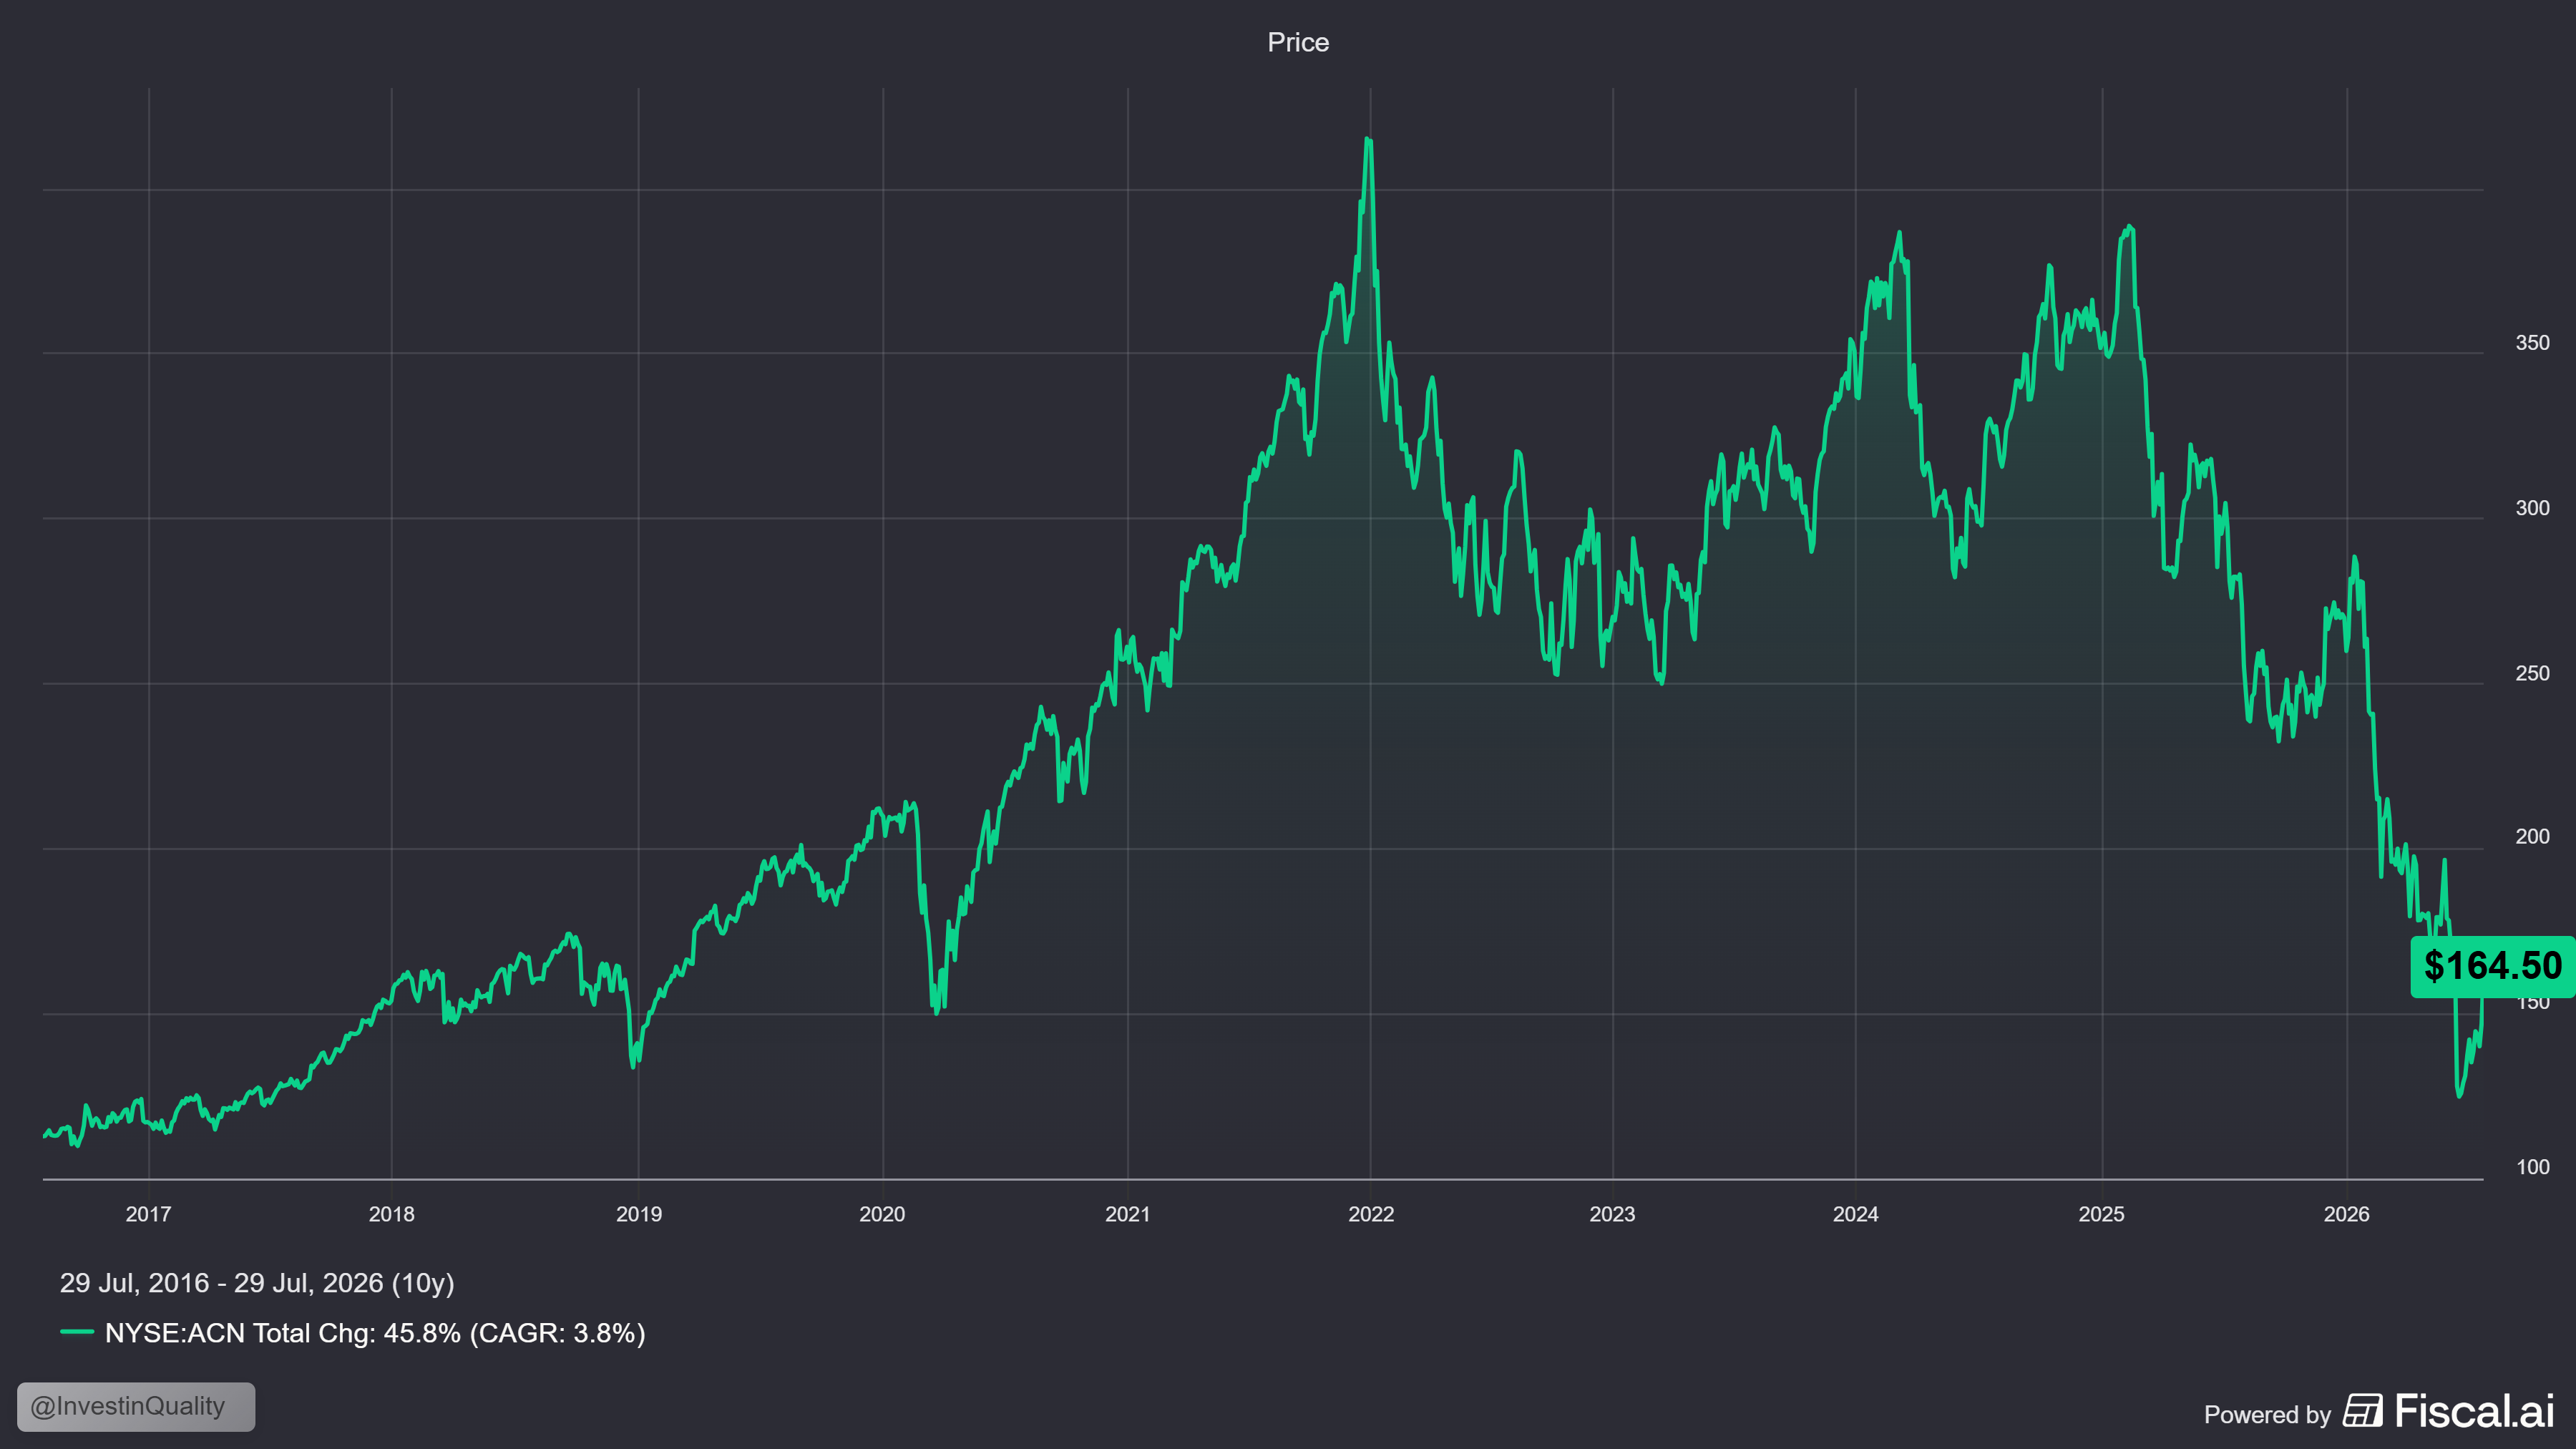
This is a contrarian bet, the stock has sold off by -60.4% from its highs, and is trading at an 10 year low stock price.

If this bet pays off, investors will be paid handsomely.

The Financials

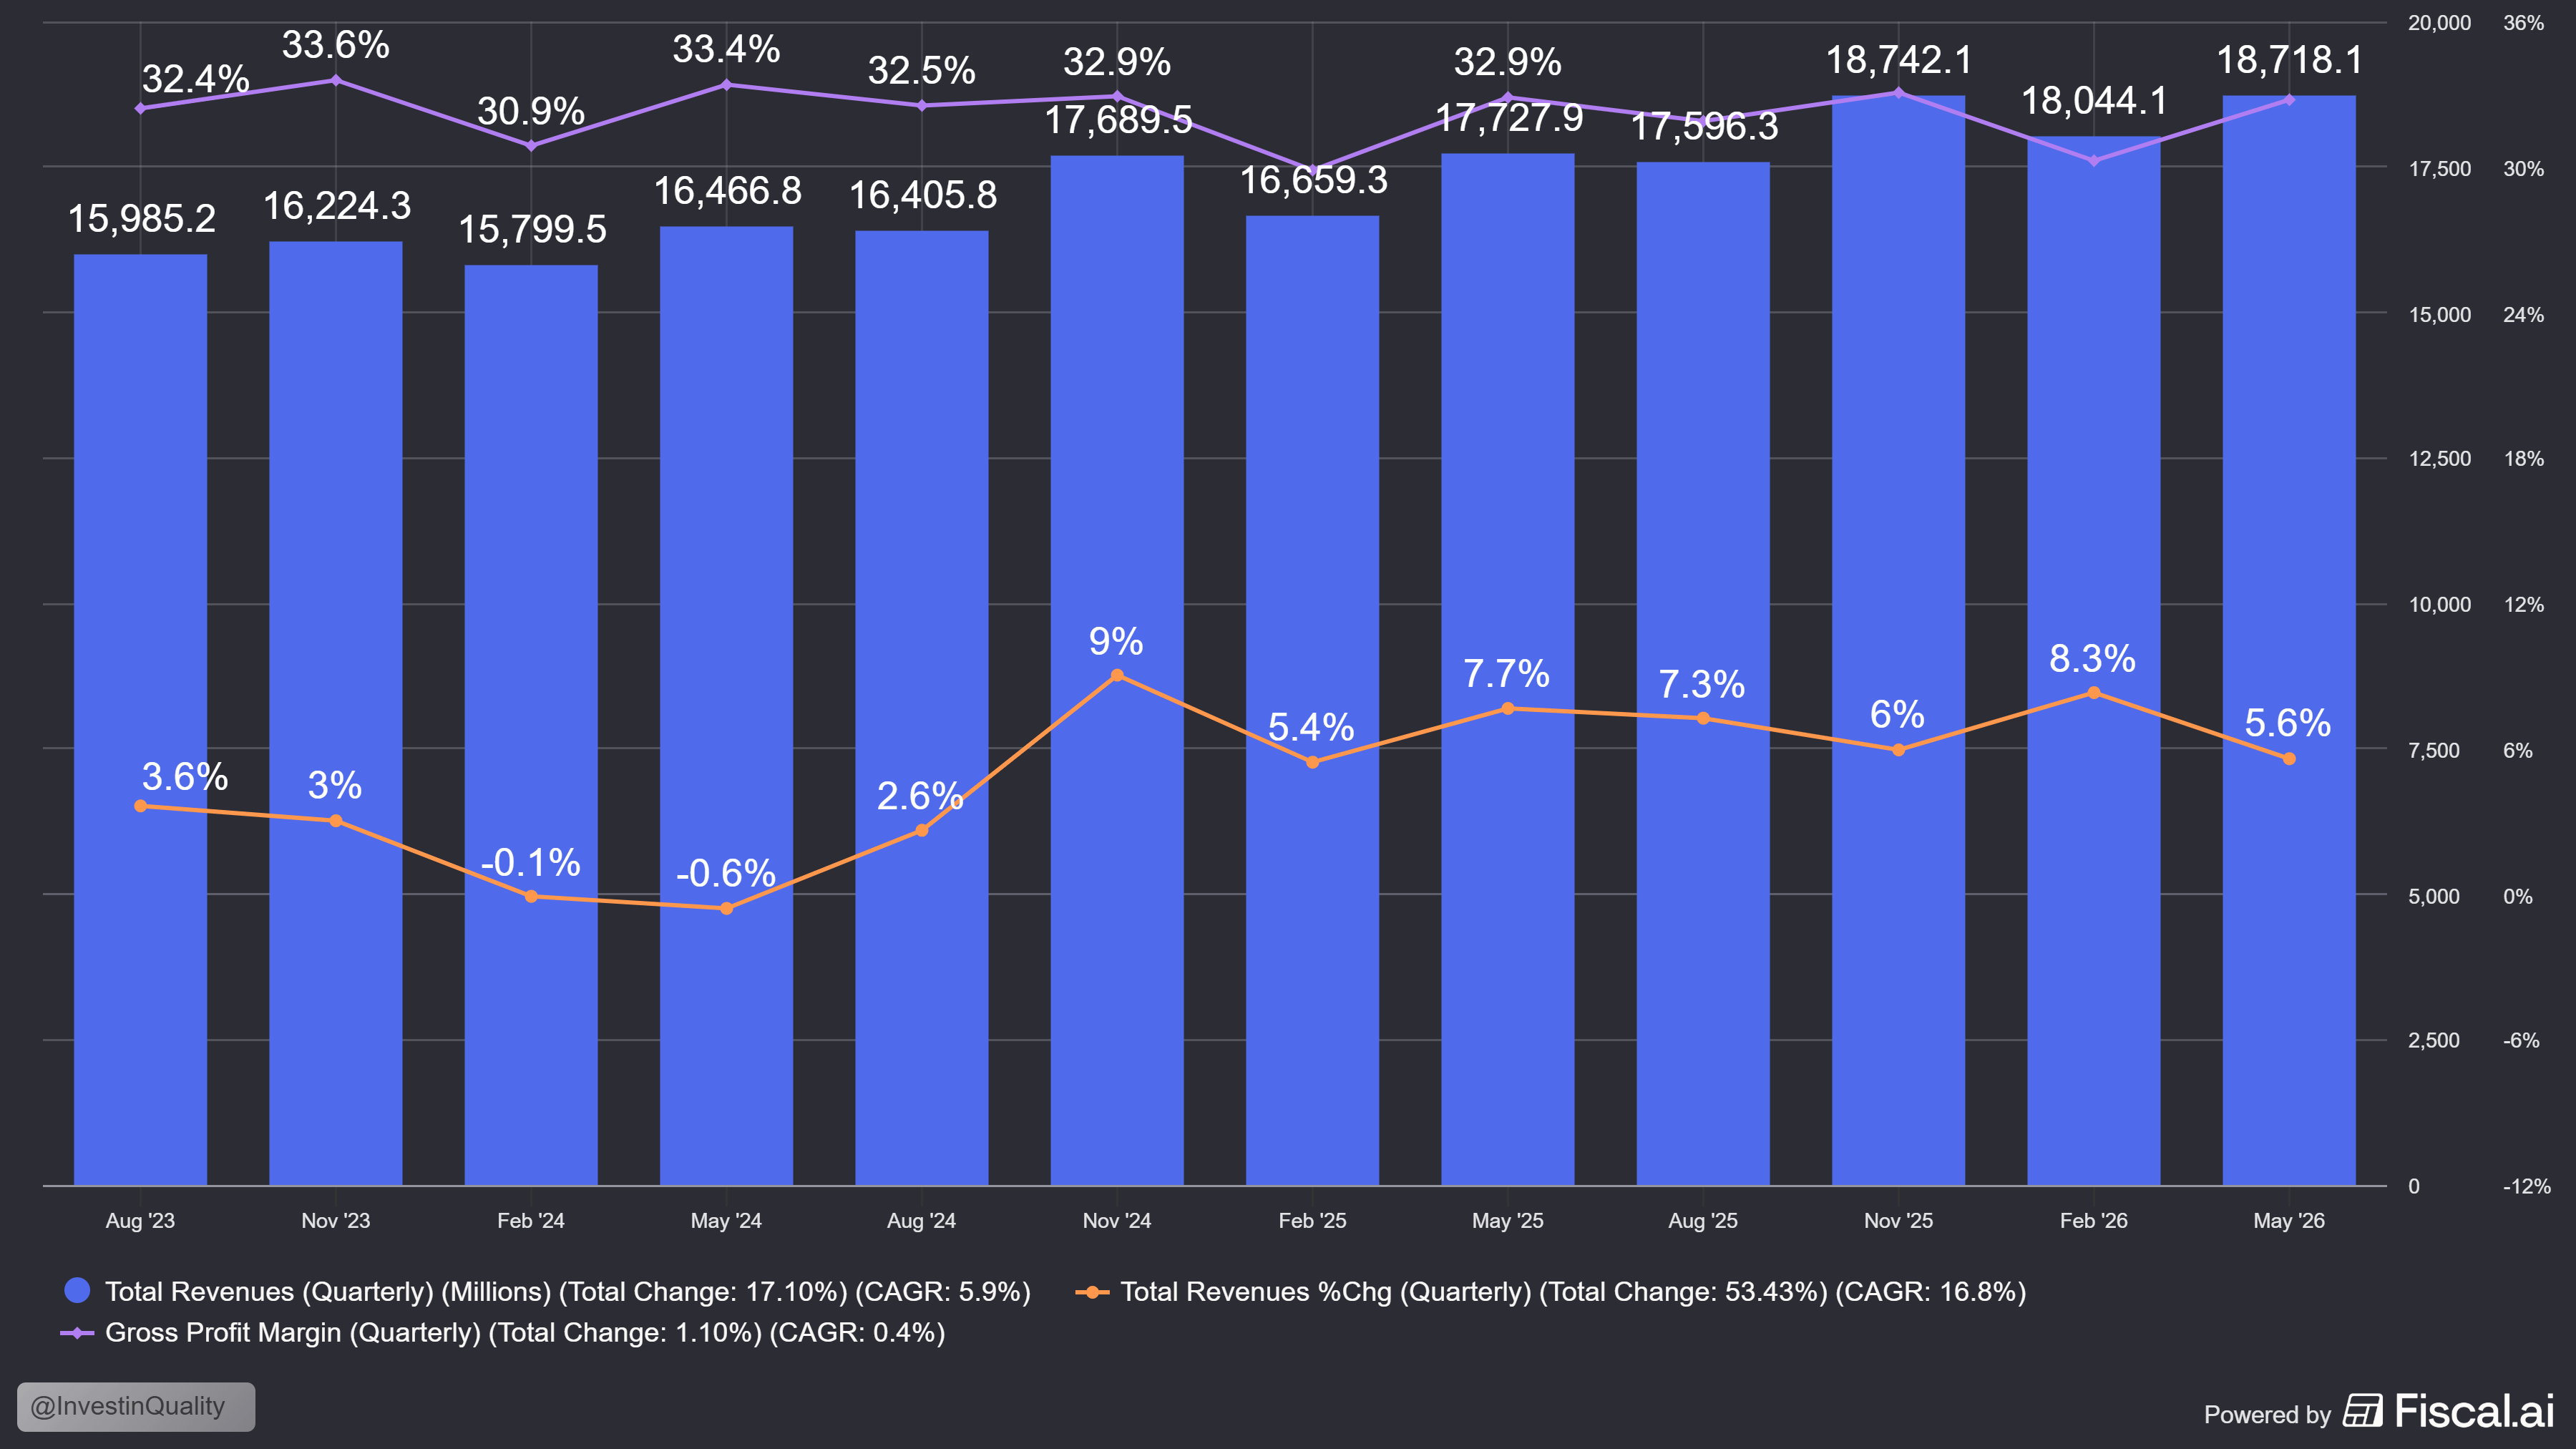
In the most recent quarter, revenues increased by 5.6%, EPS was up 9%, in line with expectations.

If we compare this growth to the 2023-2024 era, we can see that this is relatively solid top line growth for Accenture.

On top of that, Gross margins are holding up well. No sign of business deterioration like the stock price suggests.

But, the market is always forward looking. It does not care about the current results, if there are indications that growth will fall in the future.

And for Accenture, that is exactly what happened in the quarter.

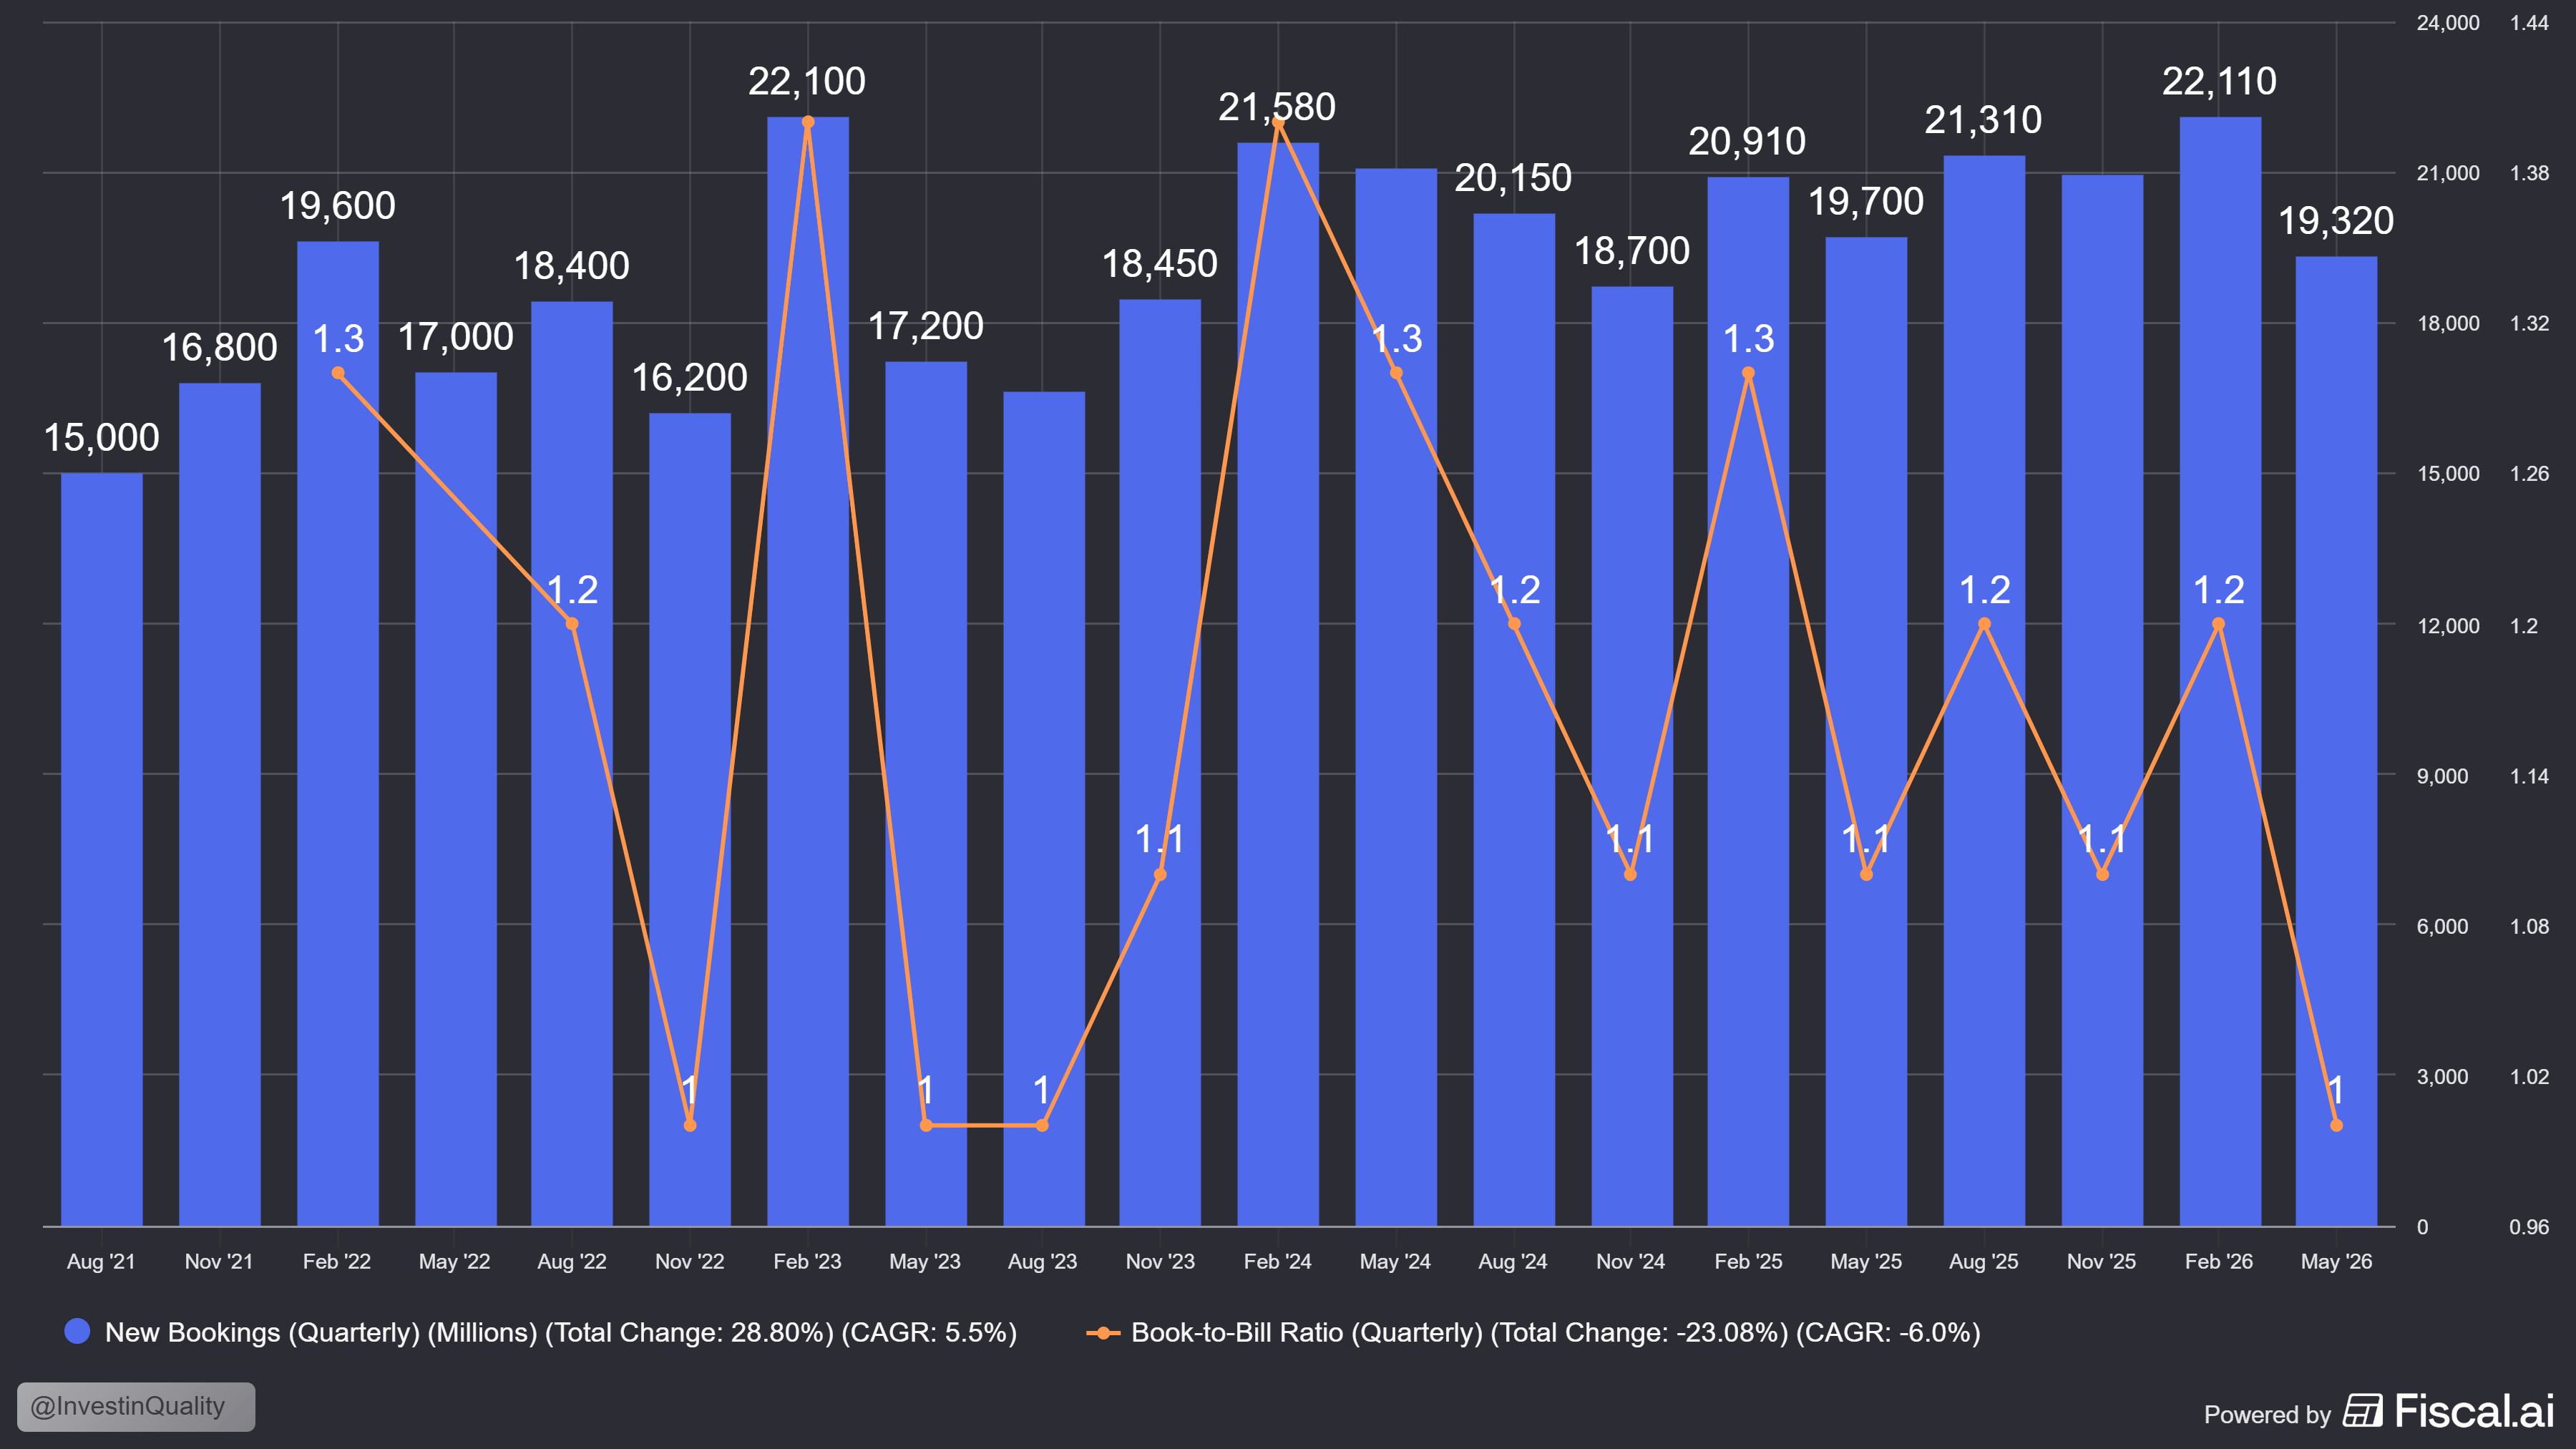
New booking came in at $19.3 billion, and Book-to-Bill fell to 1.

Now, if you look at this going back a few years, new bookings has been much lower in previous quarters, and the Book-to-Bill ratio has been 1 multiple times.

But this time we have a nervous market, and a prevailing narrative to follow the numbers.

The ‘AI transition story’ is still intact, as management has noted +100 new advanced AI projects in this quarter alone.

Accenture is doubling down on cybersecurity by acquiring stakes in Dragos, runZero, and NetRise (All leaders in technological security). This is a major pain point for most serious businesses that is only getting worse due to AI.

Overall solid fundamentals.

The Valuation

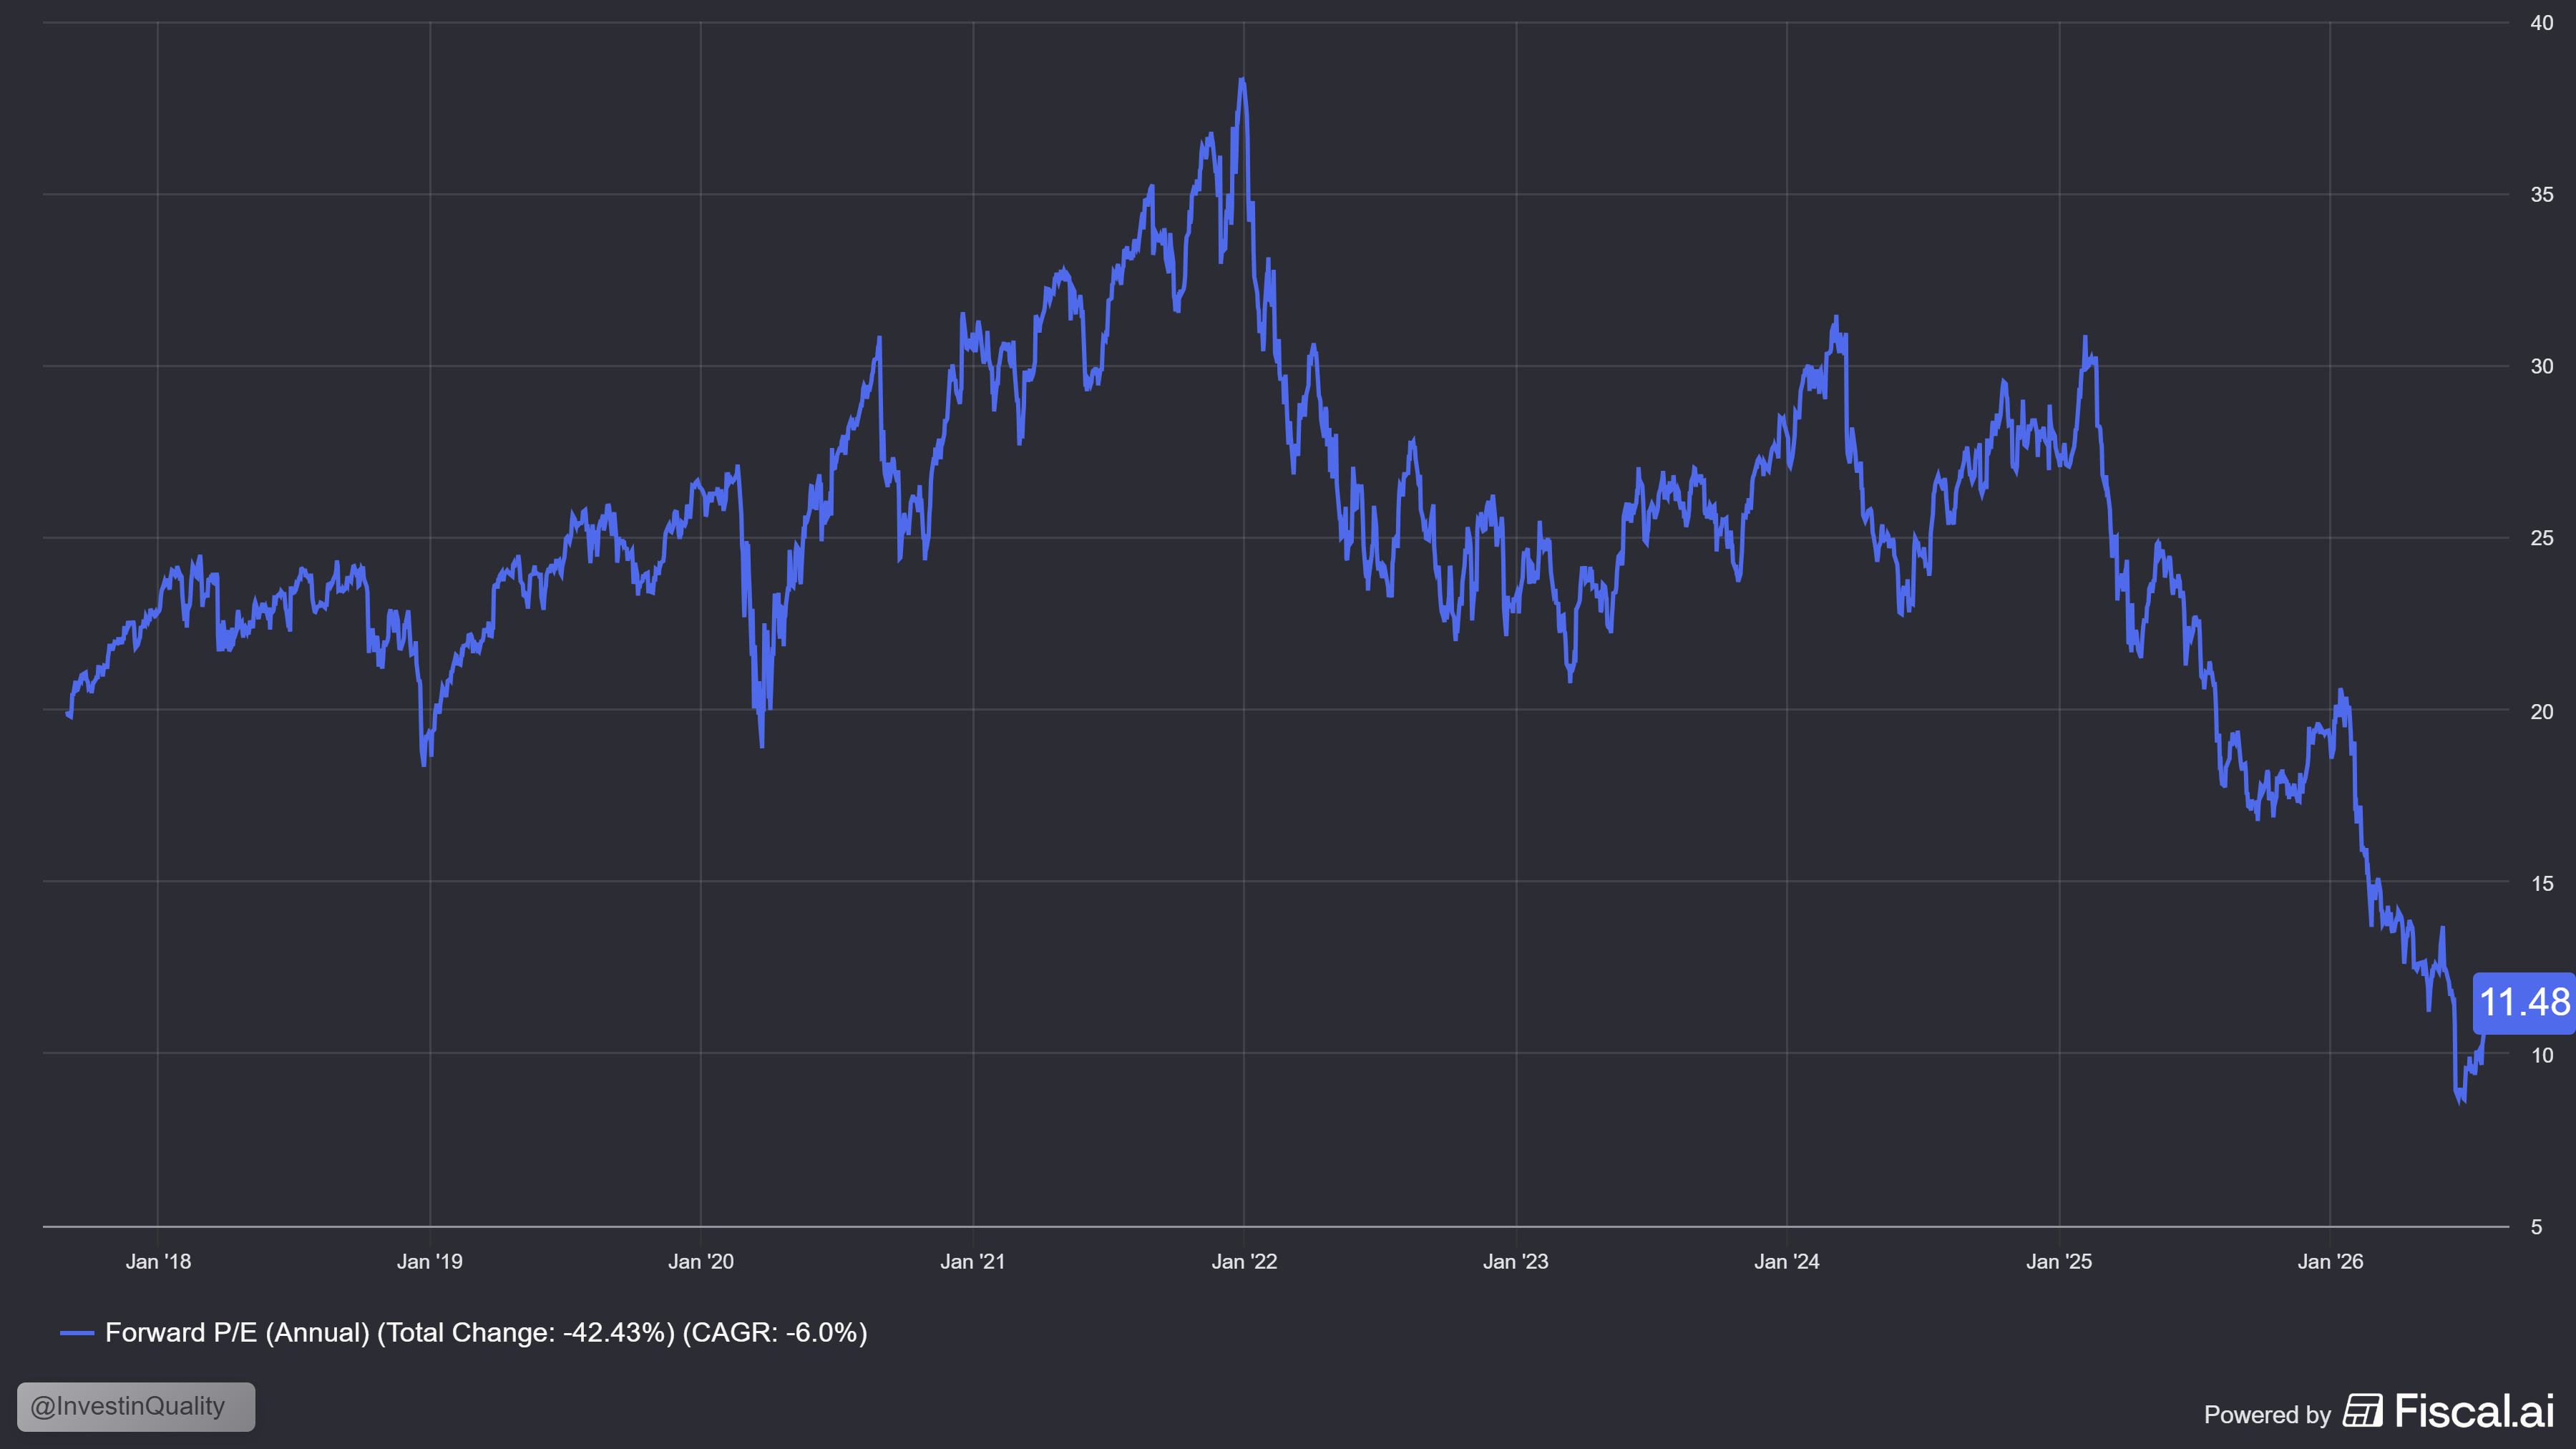
Accenture trades at 11.48x forward earnings. The cheapest valuation in the company’s history. The average is close to 25x, and it has traded as high as +35x at one point.

This rerating assumes major AI disruption to the business, and is very pessimistic.

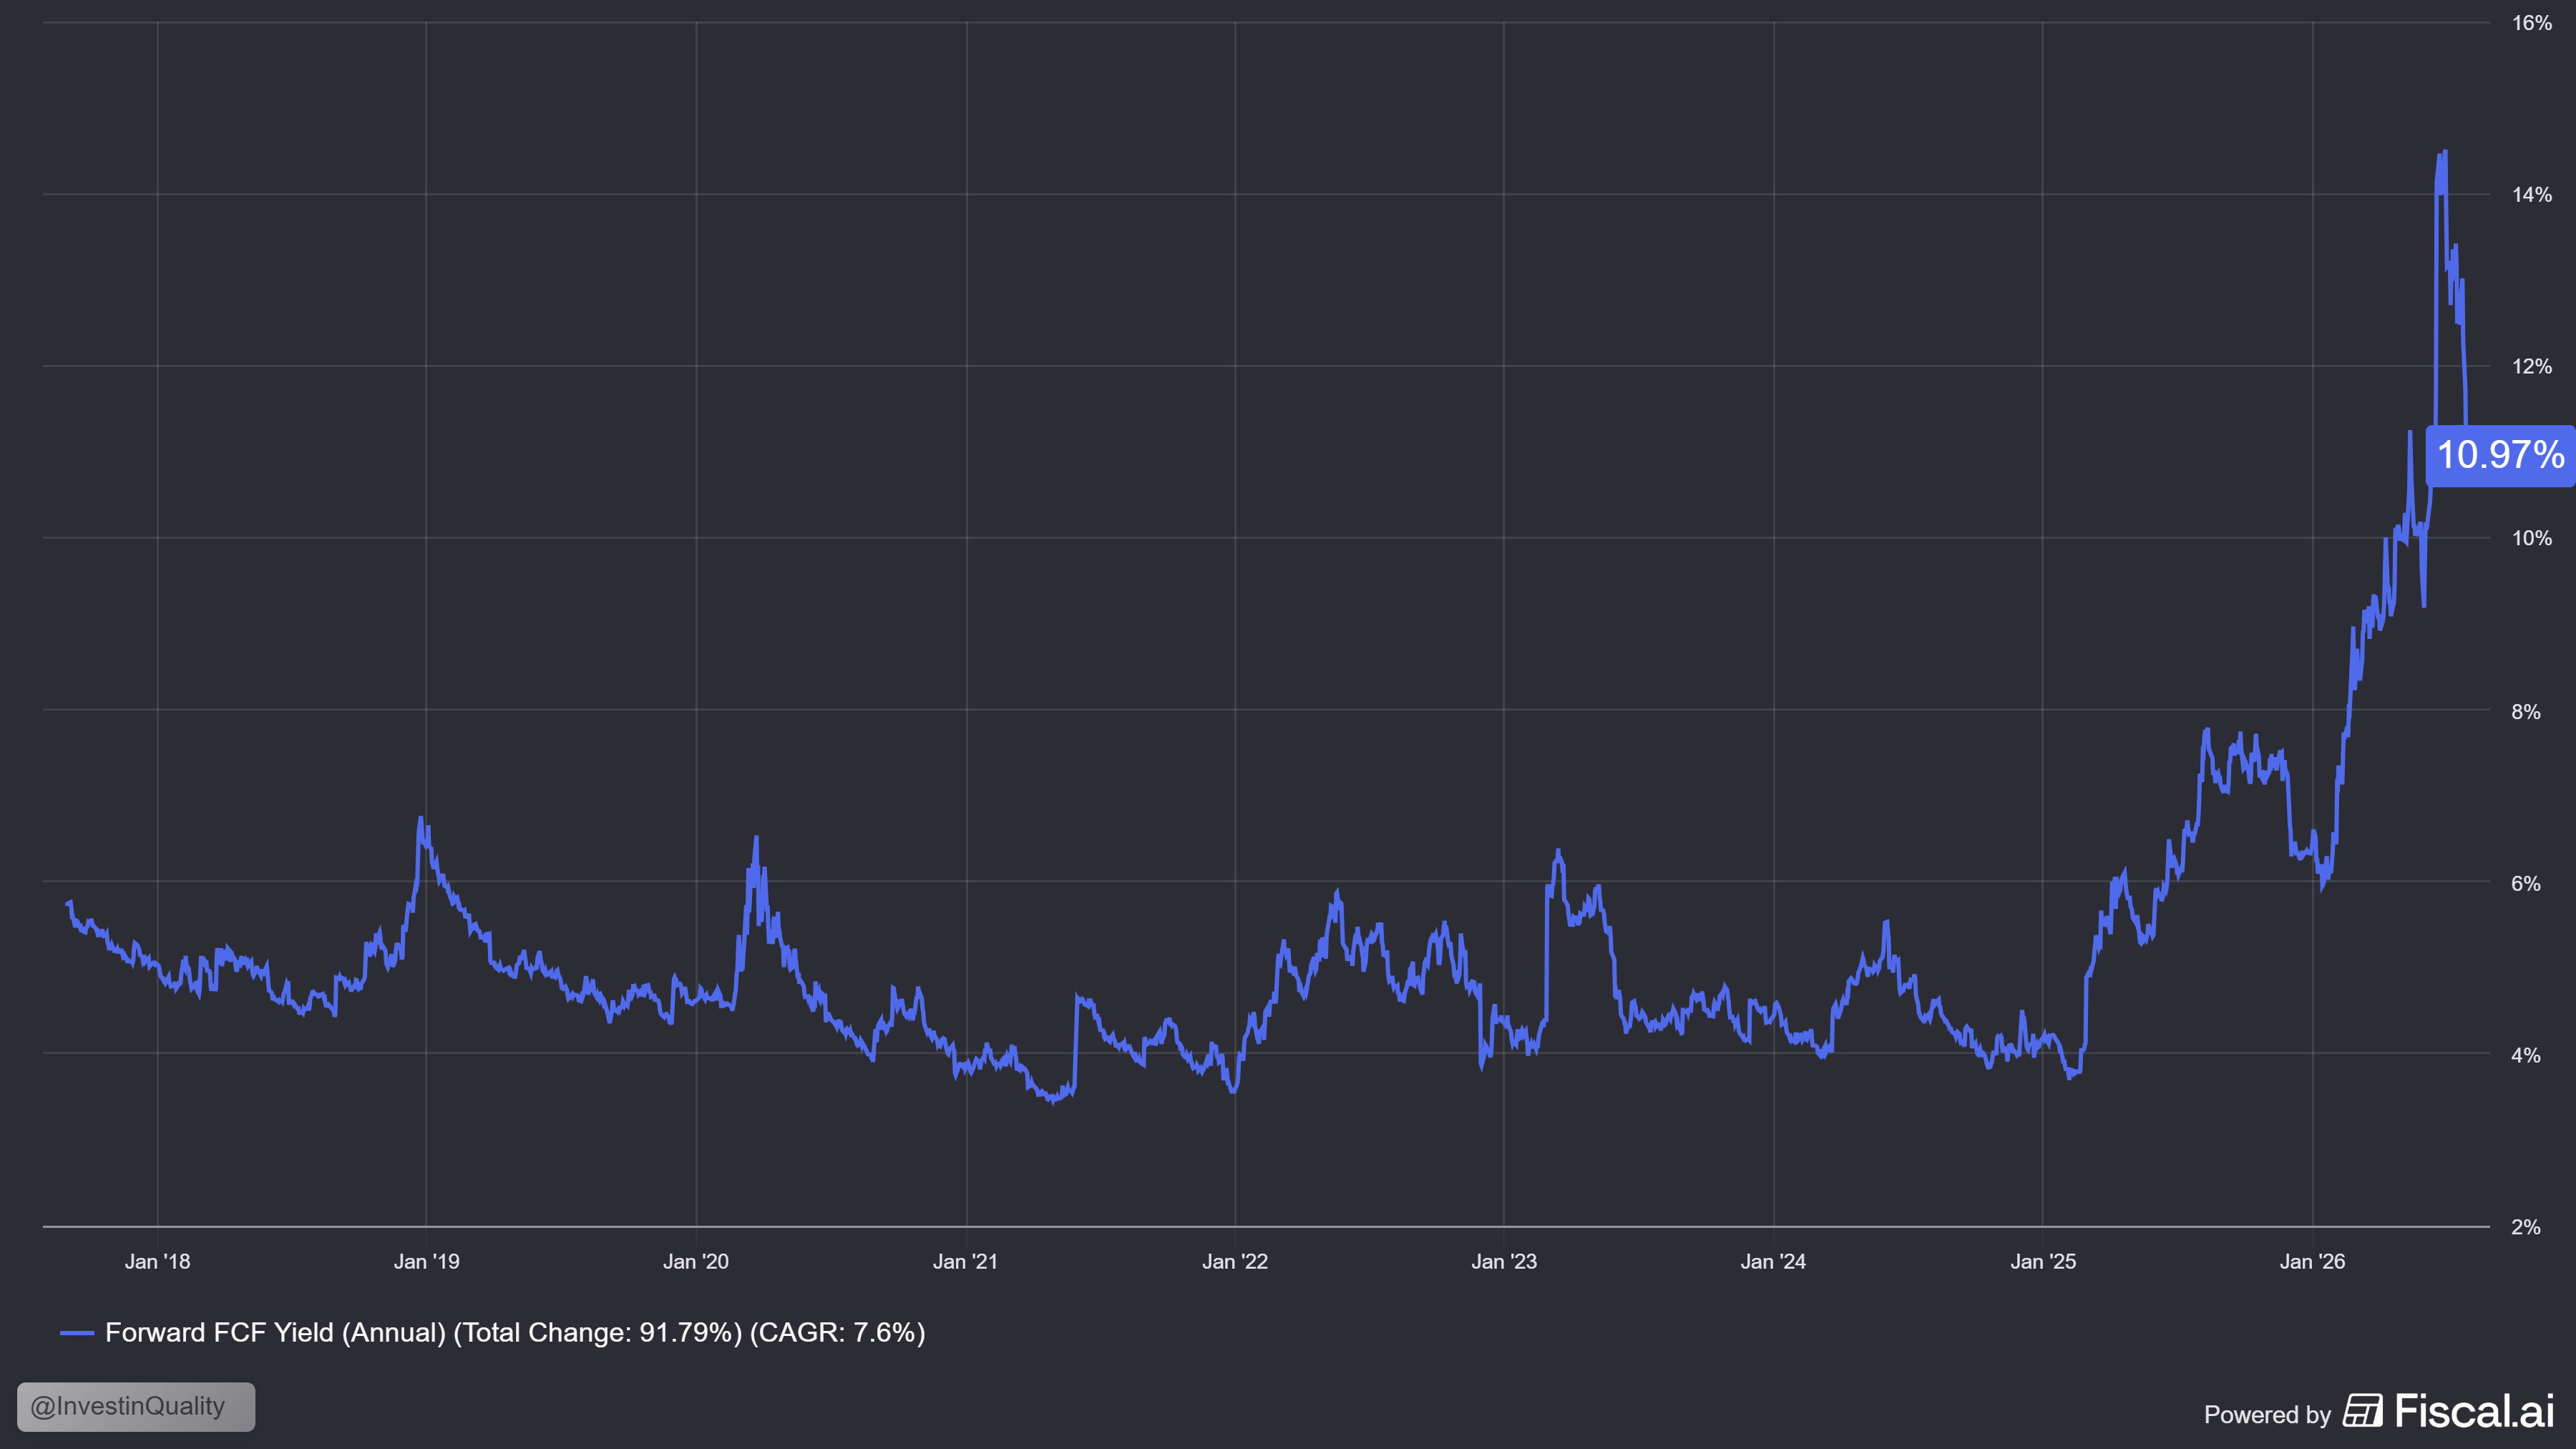
The FCF yield is currently at 10.97%, which is the best valuation you’ll probably see Accenture at.

The FCF margins currently sit at 17%, up more than 5% in the last 5 years - this suggests that the business is coming more capital-light in its transition and does not support the business deteriorating.

In addition, Accenture pays a ~4% dividend. It has a net cash position of $1.7 billion with $10 billion of cash. It has a ROIC 5 year average of 24.5%.

Not bad for a business trading at a +10% FCF yield.


Get 40% off forever


Adobe 🎨

Steady revenue growth, solid margins, 3x in AI ARR, but a stock price down 64.1% since its 2022 highs.

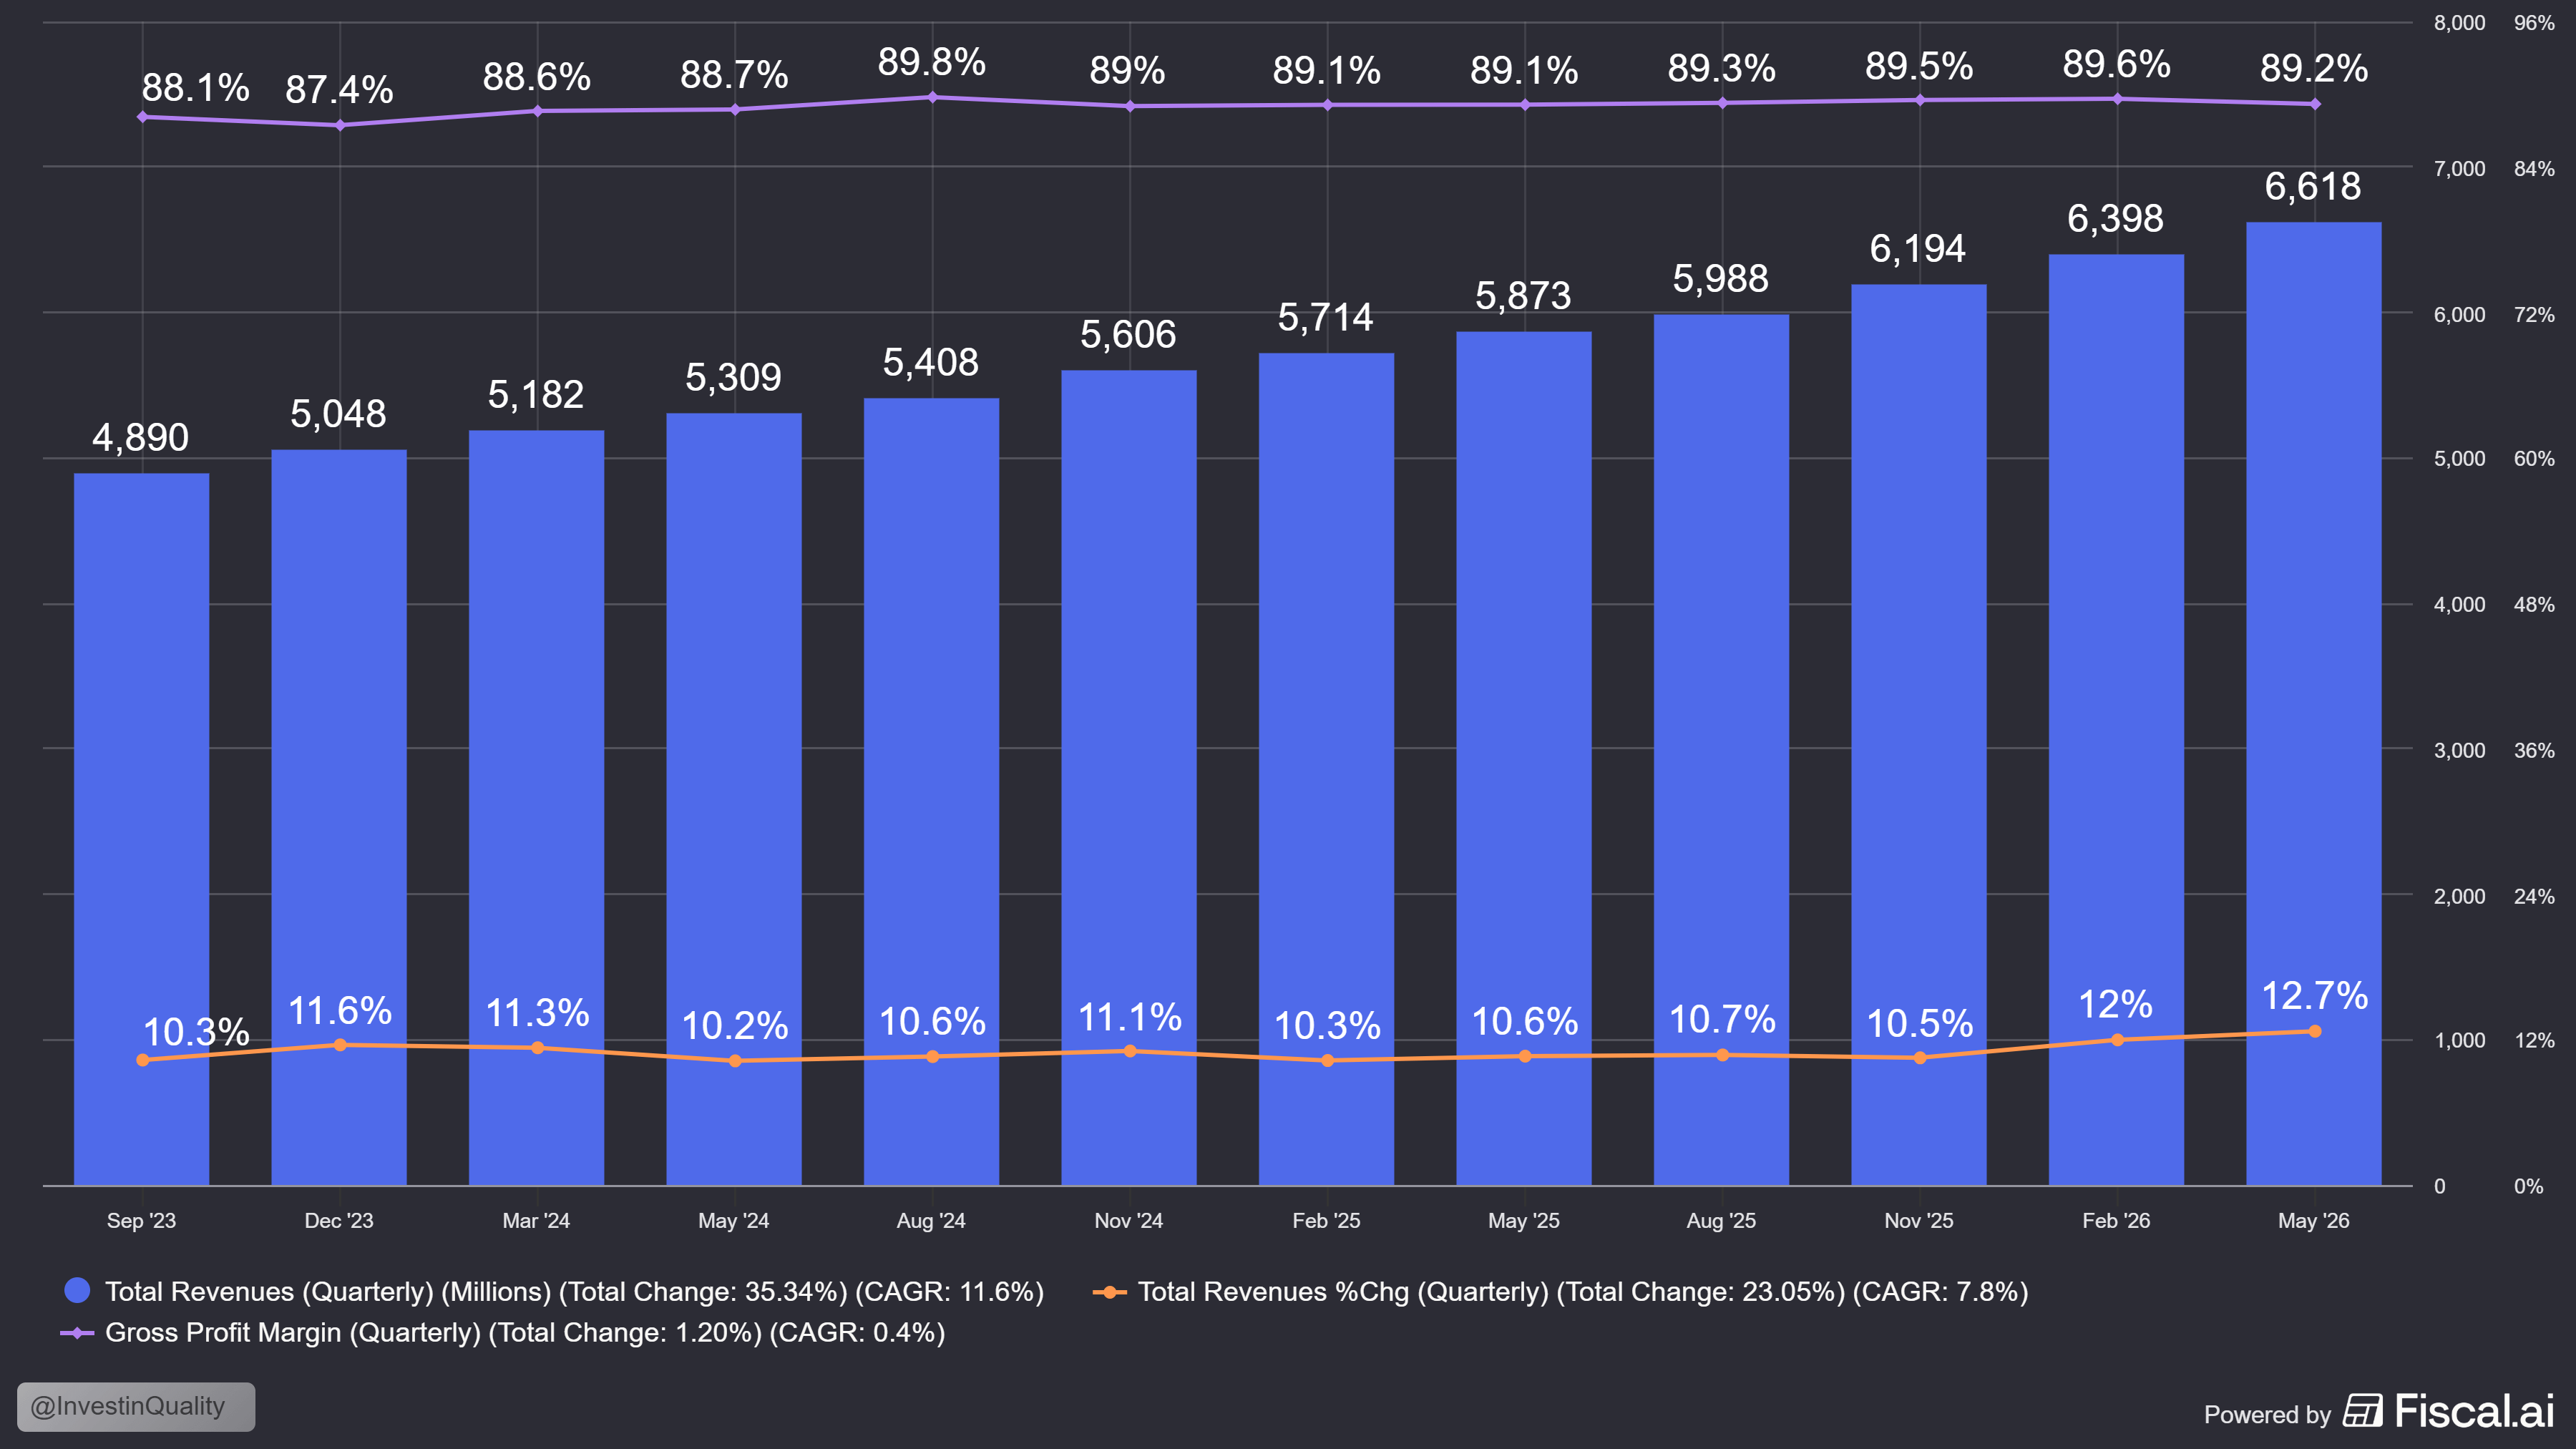
In the most recent quarter, Adobe delivered revenue of $6.62 billion (+13% YoY), and raised its guidance.

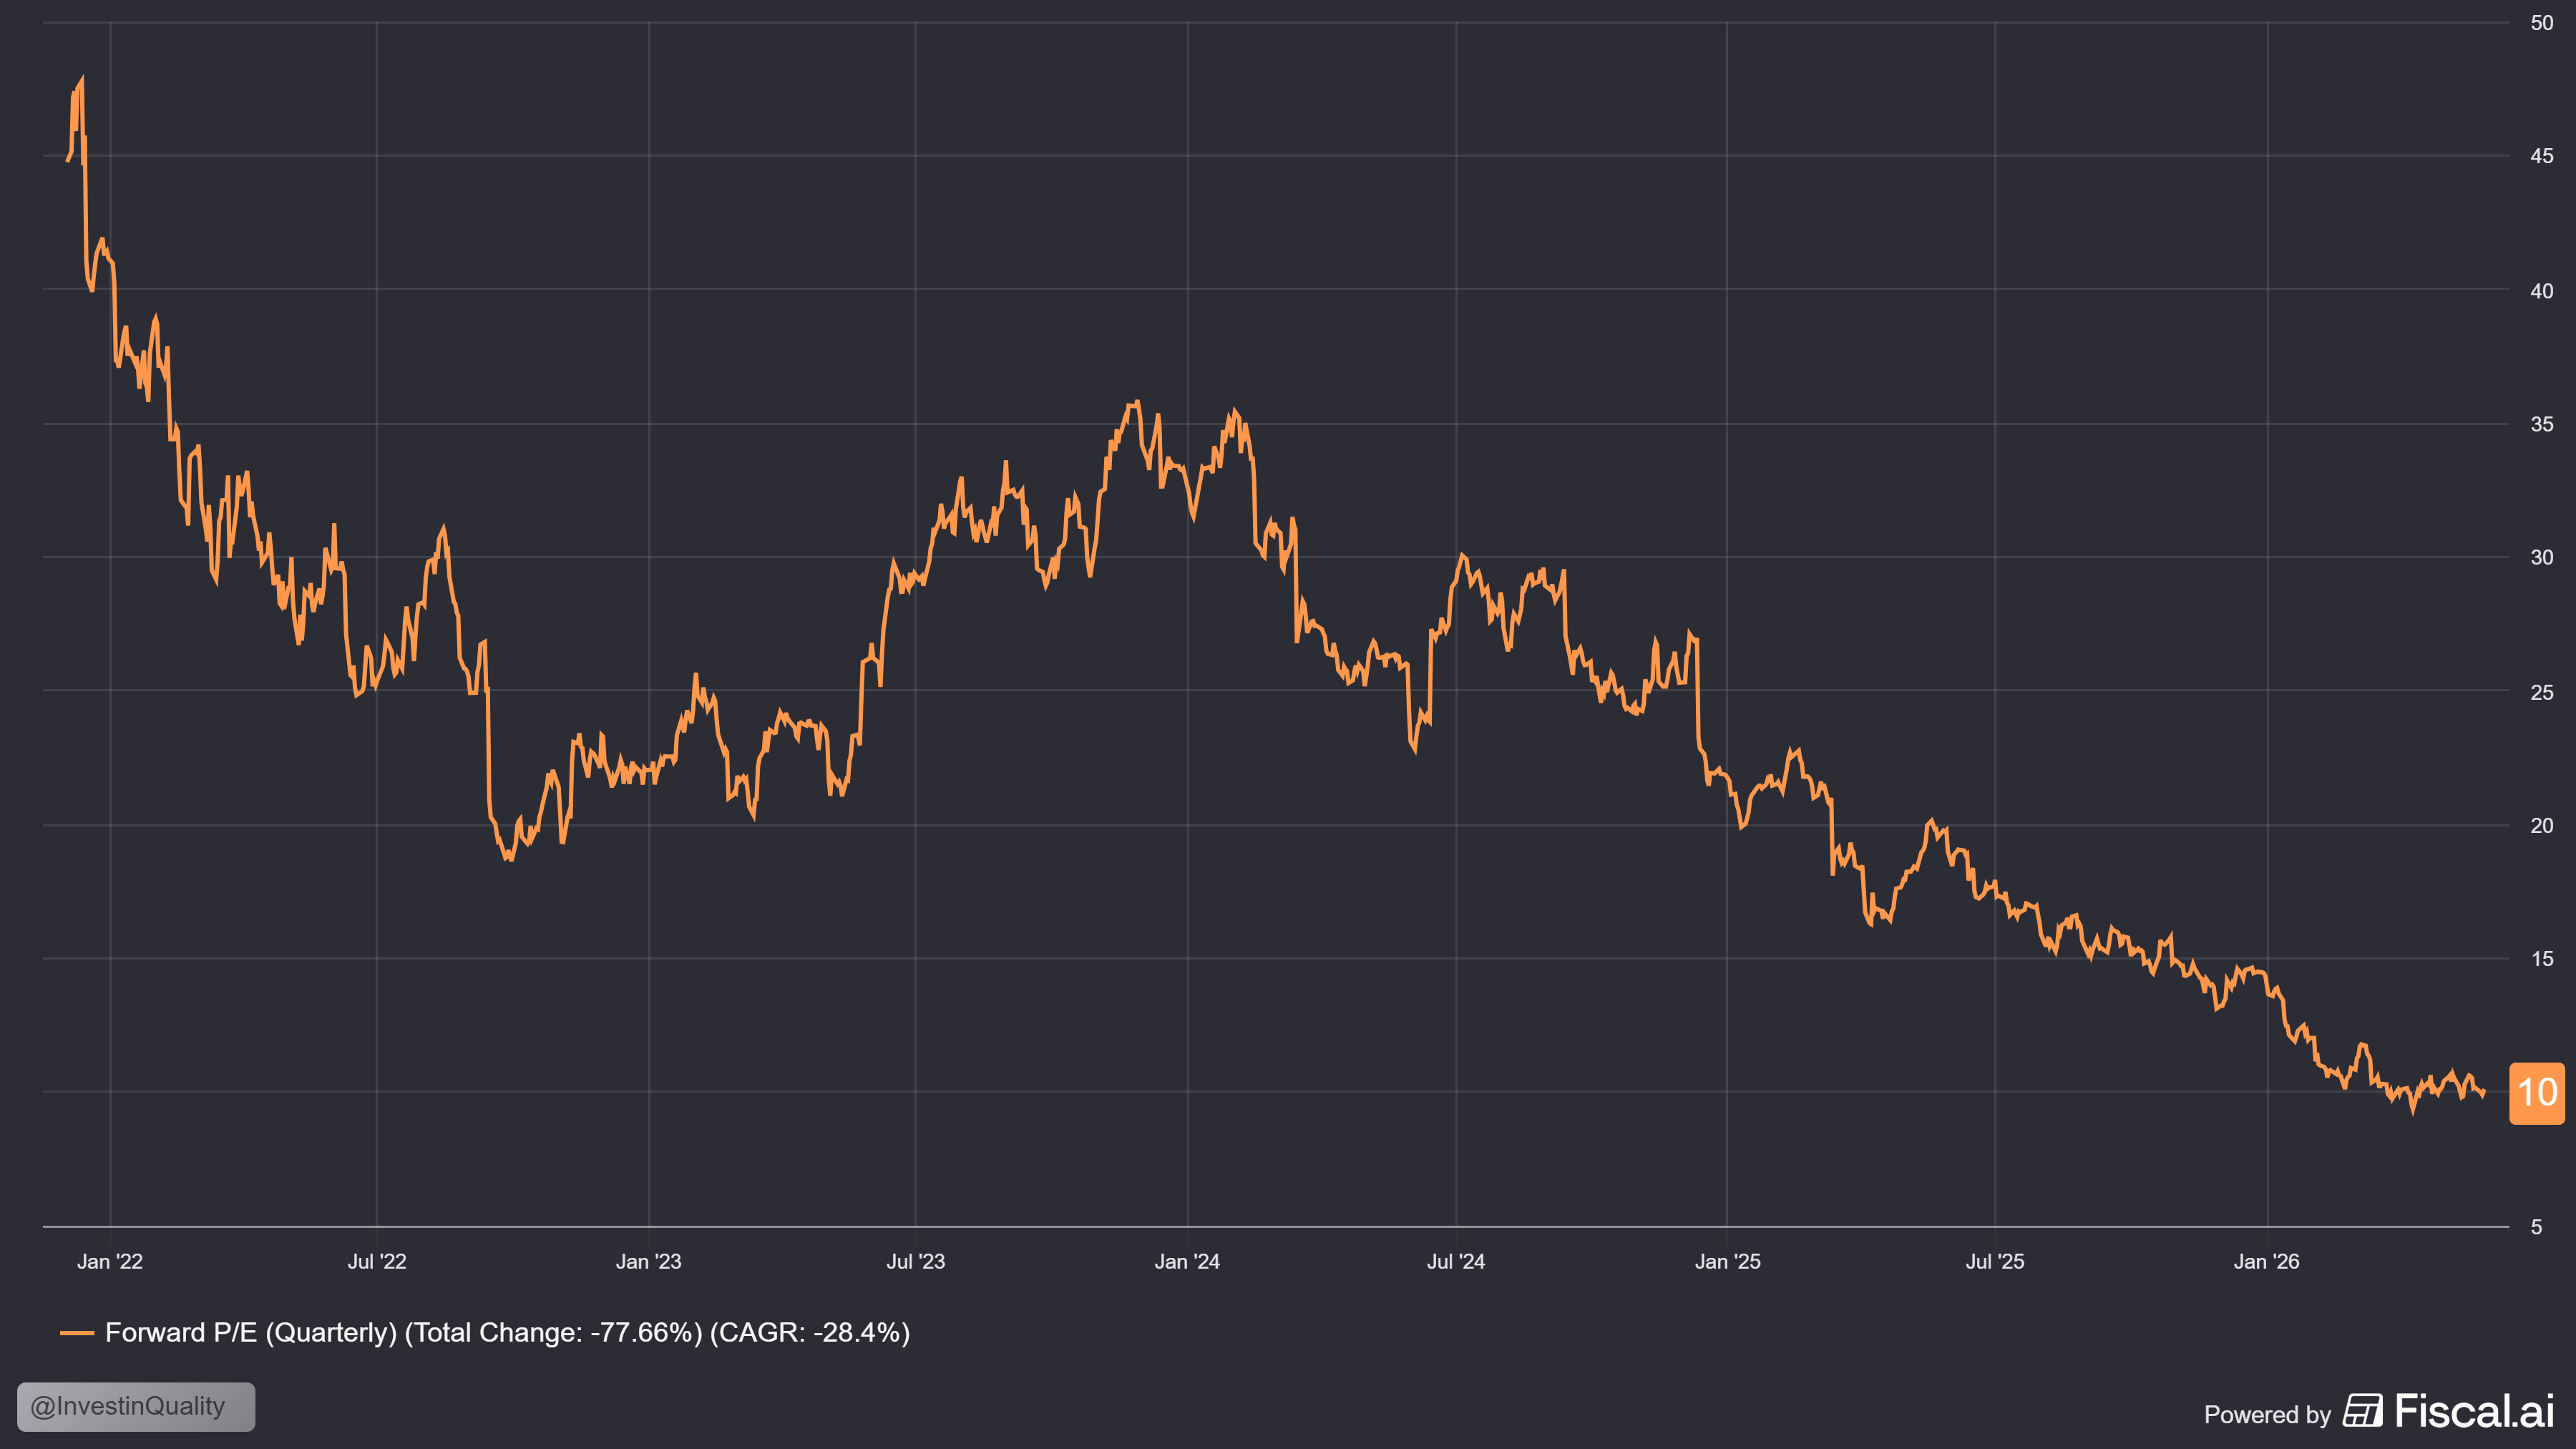
The stock still trades at 9.6x forward earnings. Interesting set up.

The Business Model

Adobe’s moat is built around their creative tools being the industry standard workflow.

Their tools are used by creative and business teams to help solve business problems within design, marketing, and other visual needs.

When companies and industries makes Adobe the standard, it is hard to just switch to something else.

You have trained your staff, you have internal super users that train others, and you have built a system around these tools.

This creates a switching cost for businesses using Adobe tools.

AI is set to be a major ‘competitor’ of Adobe, but Adobe already has massive distribution.

Millions are already using their products. And Firefly, the Acrobat AI Assistant, and GenStudio are new monetization surfaces built on top of this distribution.

What Changed?

AI ARR more than tripled YoY and crossed the $500 million line.

Total ARR reached $27 billion, so it’s still small %-wise, but it shows that there is massive demand for it.

Firefly grew 4x, the Acrobat AI assistant tripled its ARR, and GenStudio grew ARR +25%.

So, why didn’t Adobe stock soar?

CFO Dan Durn announced his departure. Why is this a problem?

Because Adobe now don’t have a CEO or a CFO - the two most important positions in a business.

This creates major uncertainty for investors.

In addition, Adobe announced that it will make a strategic pivot to expanding its freemium funnel (Product-led growth).

They will also be prioritizing user and traffic growth over near-term ARR by deferring some Creative Cloud Pricing optimizations.

We’ve seen this time and time again, the market hate these kinds of trade-offs. The market rewards short-term certainty, and punishes strategic long-term bets with short-term consequences (Another example of this is MercadoLibre).

The Numbers

The stock price crash has never been about fundamentals.

Adobe is defending a ~89% gross margin (Incredible).

It is growing top-line between 10-13% steadily every quarter.

Does this look like a business falling apart?

One of the most, real, numbers to follow for Adobe, is the number of subscriptions revenue is has.

Getting more revenue from it’s customers is the best indication of your product having an organic demand in the market.

It means that you are attracting more customers (More customers are coming in than churning), and it means that your existing customers are buying more of your product(s).

When we look at the growth of subscribers, it has been higher in the past.

Regardless, the YoY growth remains in the 11%-14% range, which is solid for a business of Adobe’s scale.

I also think its necessary to look at the Q2 numbers again.

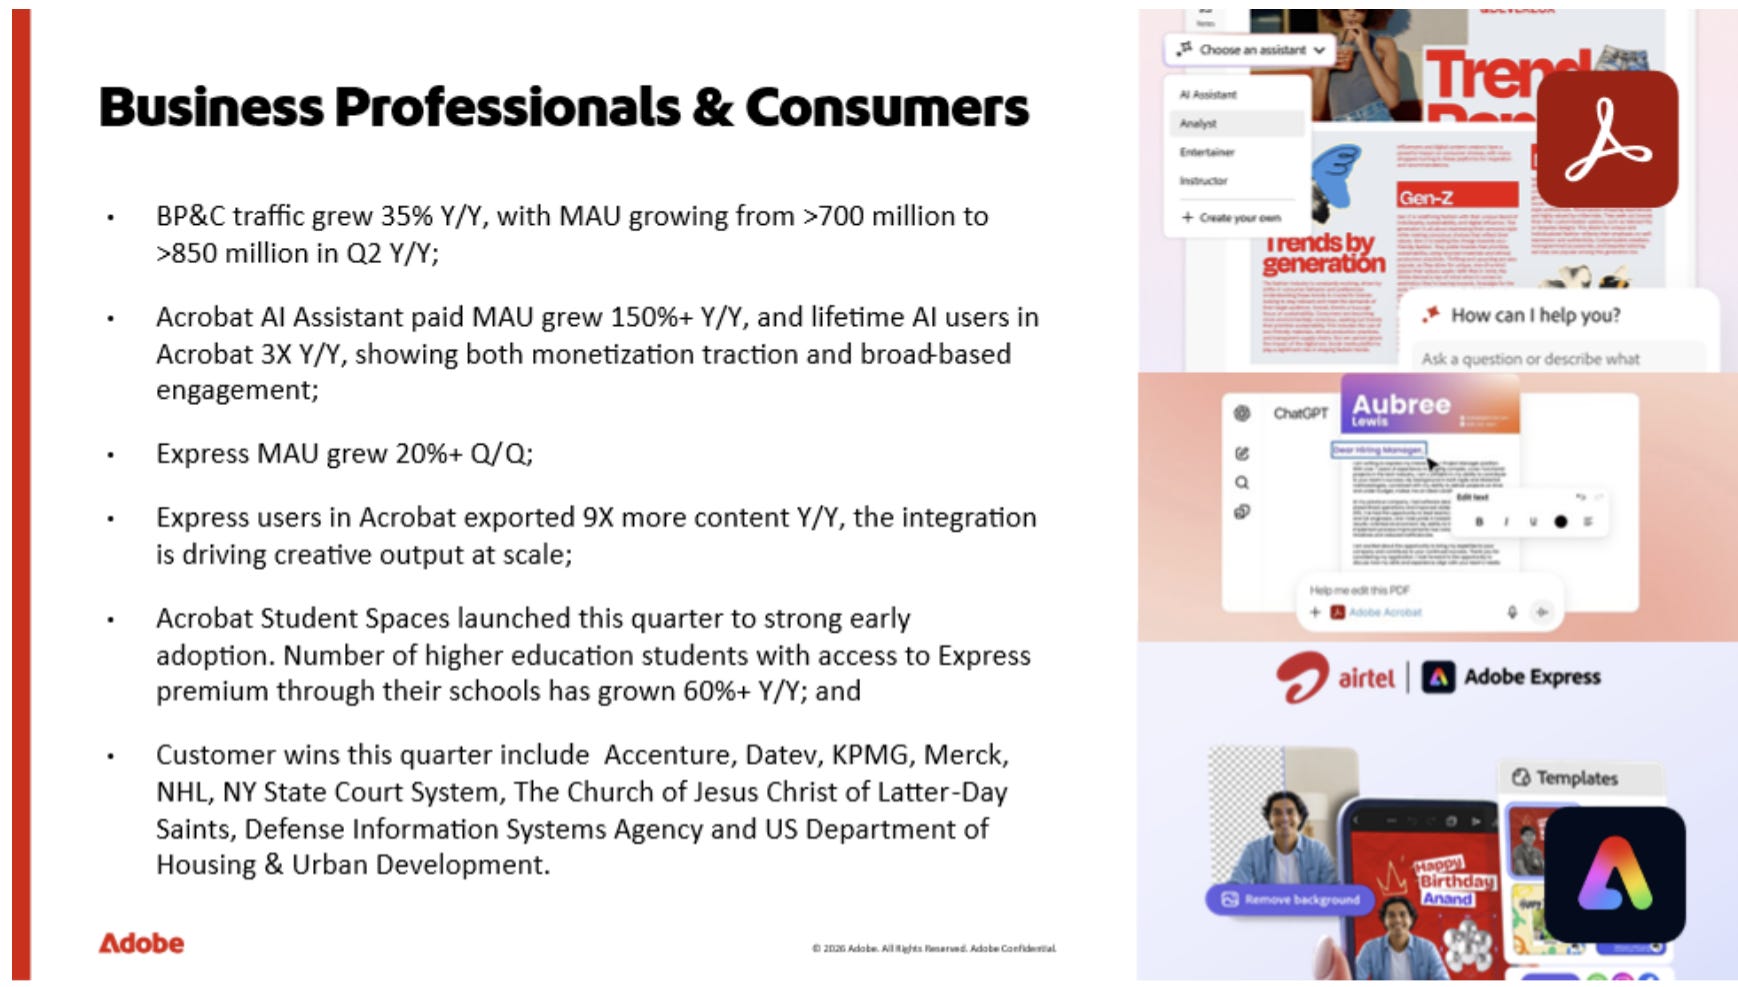
Traffic grew 35% YoY, that is significant. And 150 million MAU were gained.

Massive growth in the AI tools:

  • Acrobat +150% in paid MAU

  • Lifetime AI users in Acrobat 3x’d

  • Express MAU grew 20% QoQ

These are not numbers of a dying business in my book.

The Valuation

Adobe trades at a forward PE of 10x.

That is the lowest multiple in its history, by a long slide.

I don’t think we should expect Adobe to go back to its 30-35x multiple range, but assuming that Adobe can hold its competitive position and boats high margins with decent growth, a 20x multiple should be fair.

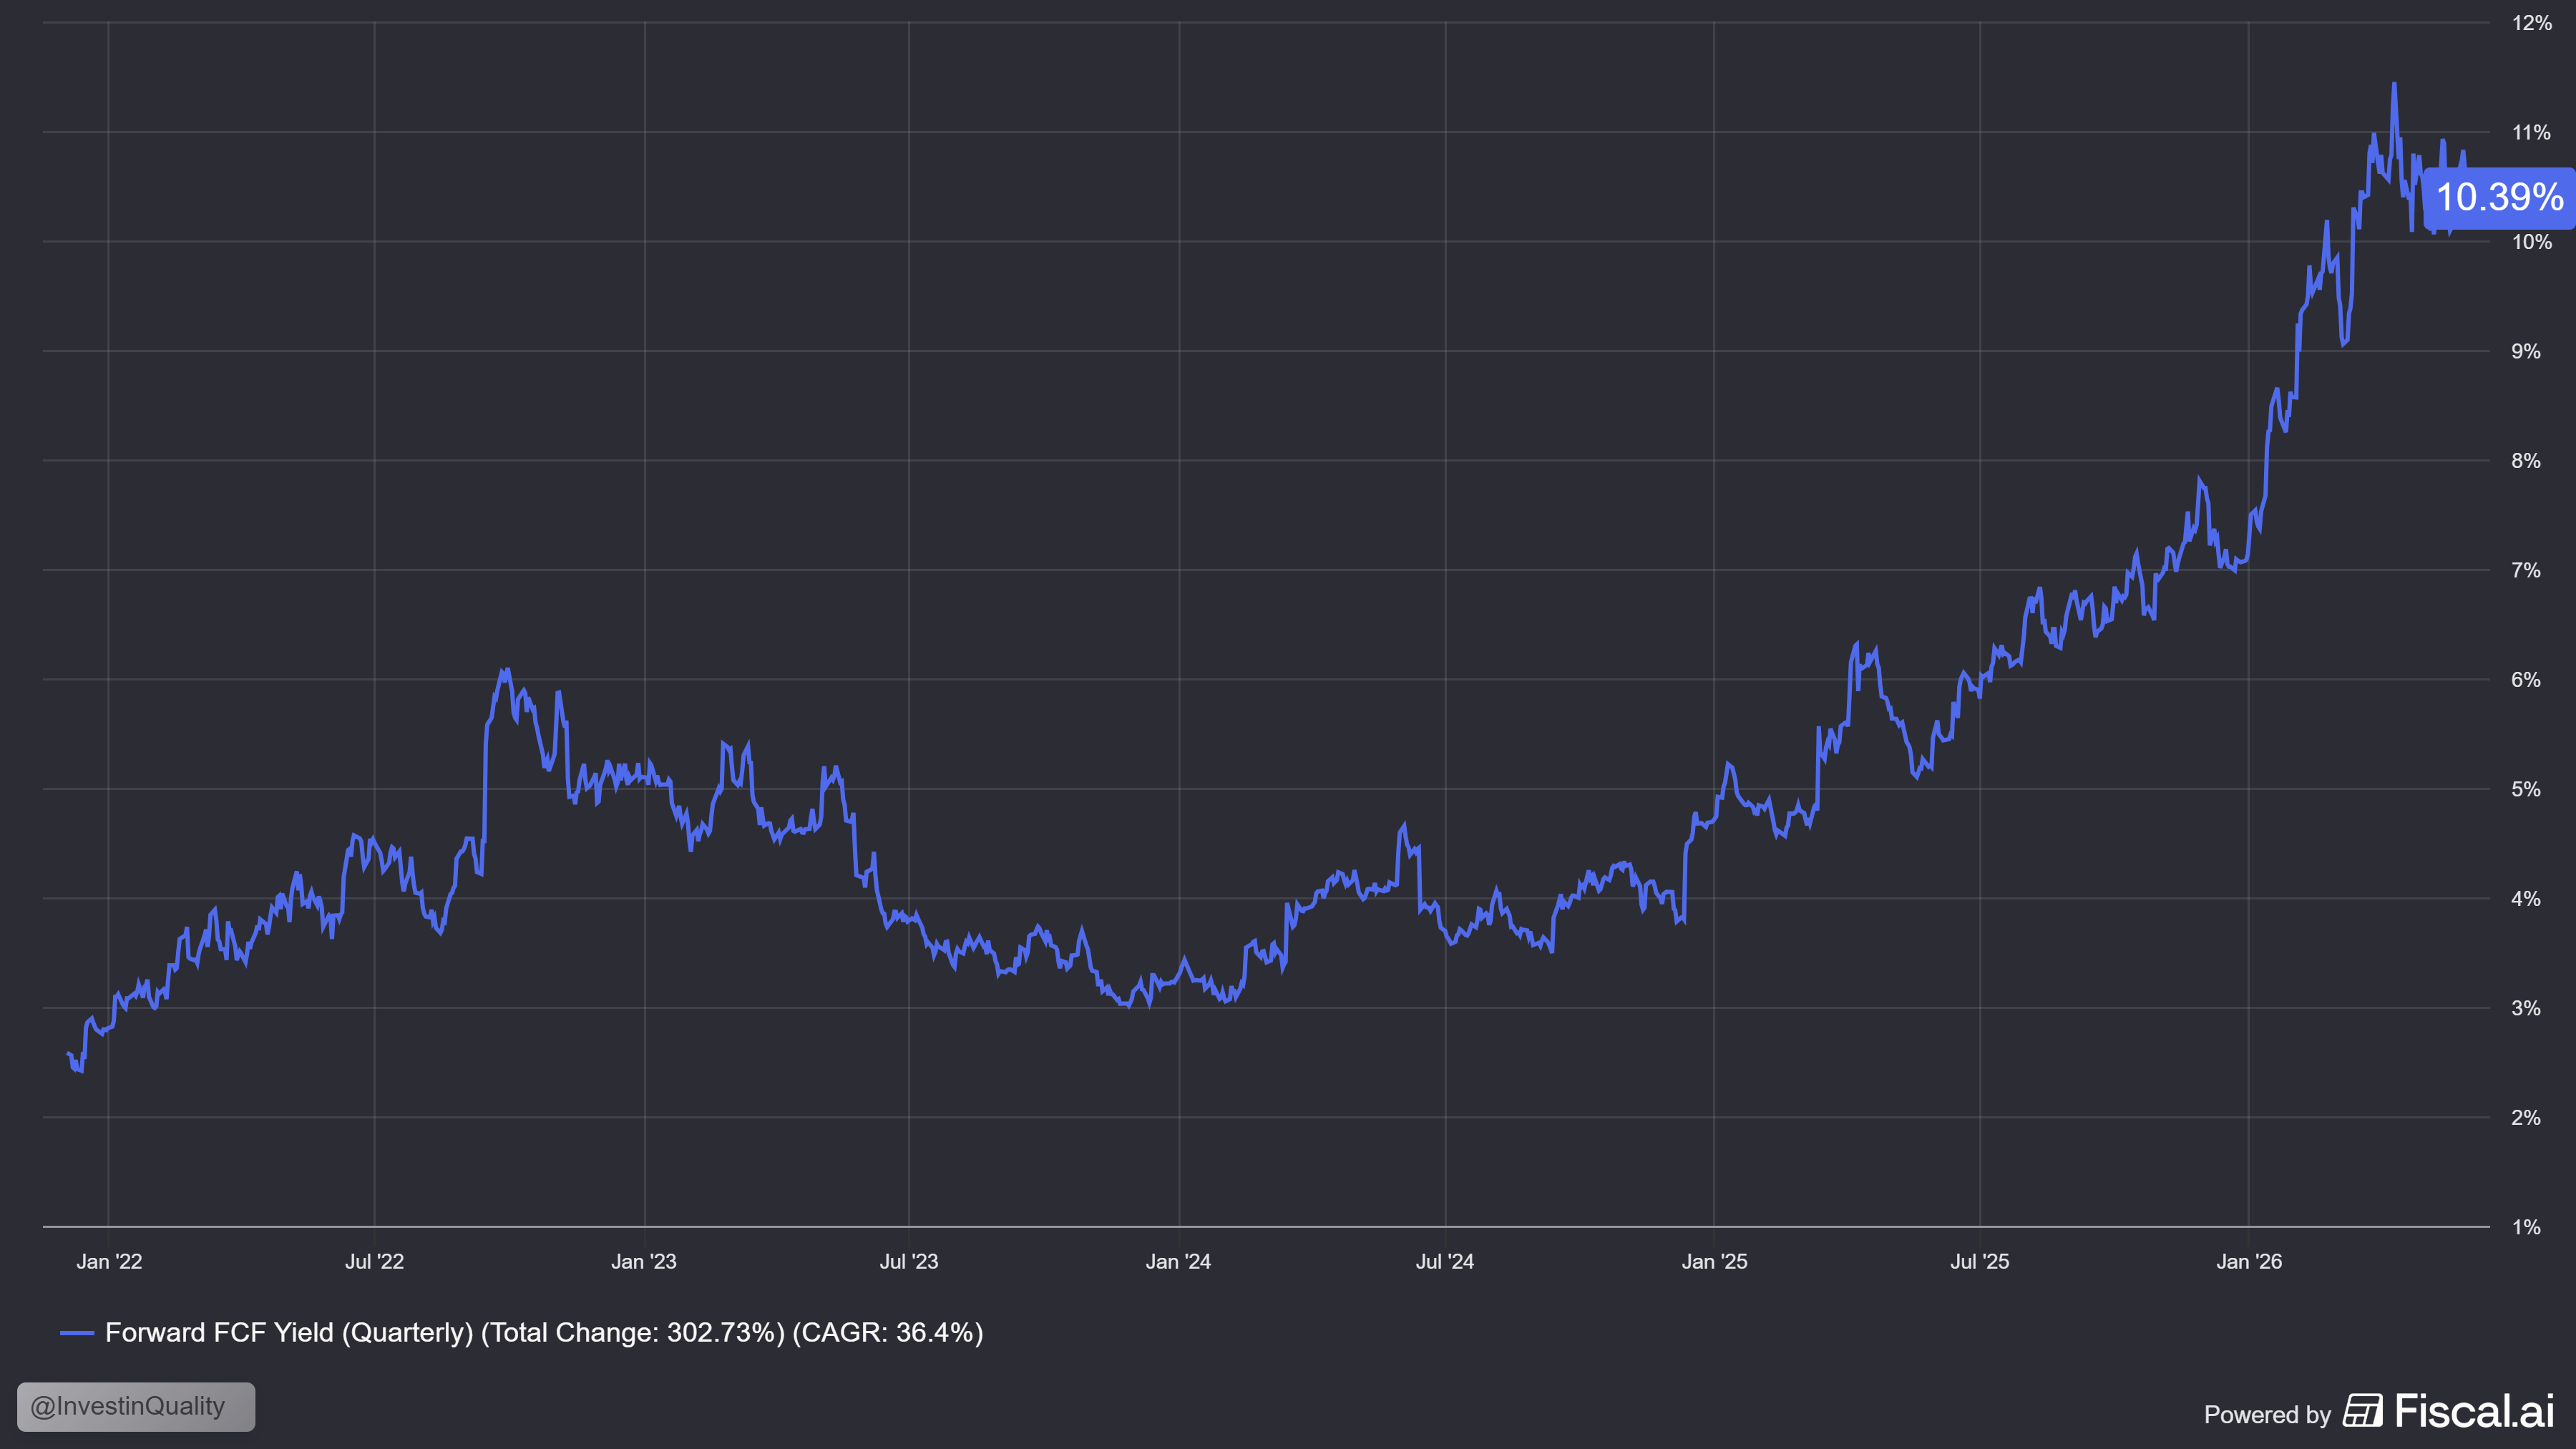
Looking at the FCF yield, it is extremely high, at 10.39%.

If we compare it to the risk free rate of 4.67%, we’re getting more than 2x the yield of Adobe.

That’s a huge risk premium for a very good business.

The current market hates uncertainty, and there are a few uncertainties for Adobe that needs to play out in the company’s favor for it to ‘turn around’.

  • Adobe must show that it can continue to grow and keep its market share, despite increased competition from Figma / Canva and emerging AI tools.

  • Adobe must get a management group in place that can set a clear strategic direction that the market believes in

  • Adobe must be successful in digital experiences and ‘creative AI’ to keep its competitive position, so far we don’t have enough proof of that materializing.

If it can executive like it has in the past, the upside potential is massive.

If it can’t, the multiple is likely to remain low, with slowing growth.

This is what we call execution risk, and you get paid handsomely to take it, because there is uncertainty in the investment case.


The rest of this article, including our next three picks and bonus, is for Premium subscribers only.

We’re running a summer sale now, where you can get -40% off an annual subscription. Read more about the Premium service here.

Get 40% off forever

Read more

☐ ☆ ✇ Invest in Quality

Google Crushed Earnings, but Stock Tanks💎

By: Invest In Assets 📈

Google is one of the best businesses in the history of the markets.

And their Q2 2026 report just confirms how good the business is, and how it keeps growing at unprecedented levels, even at its scale.

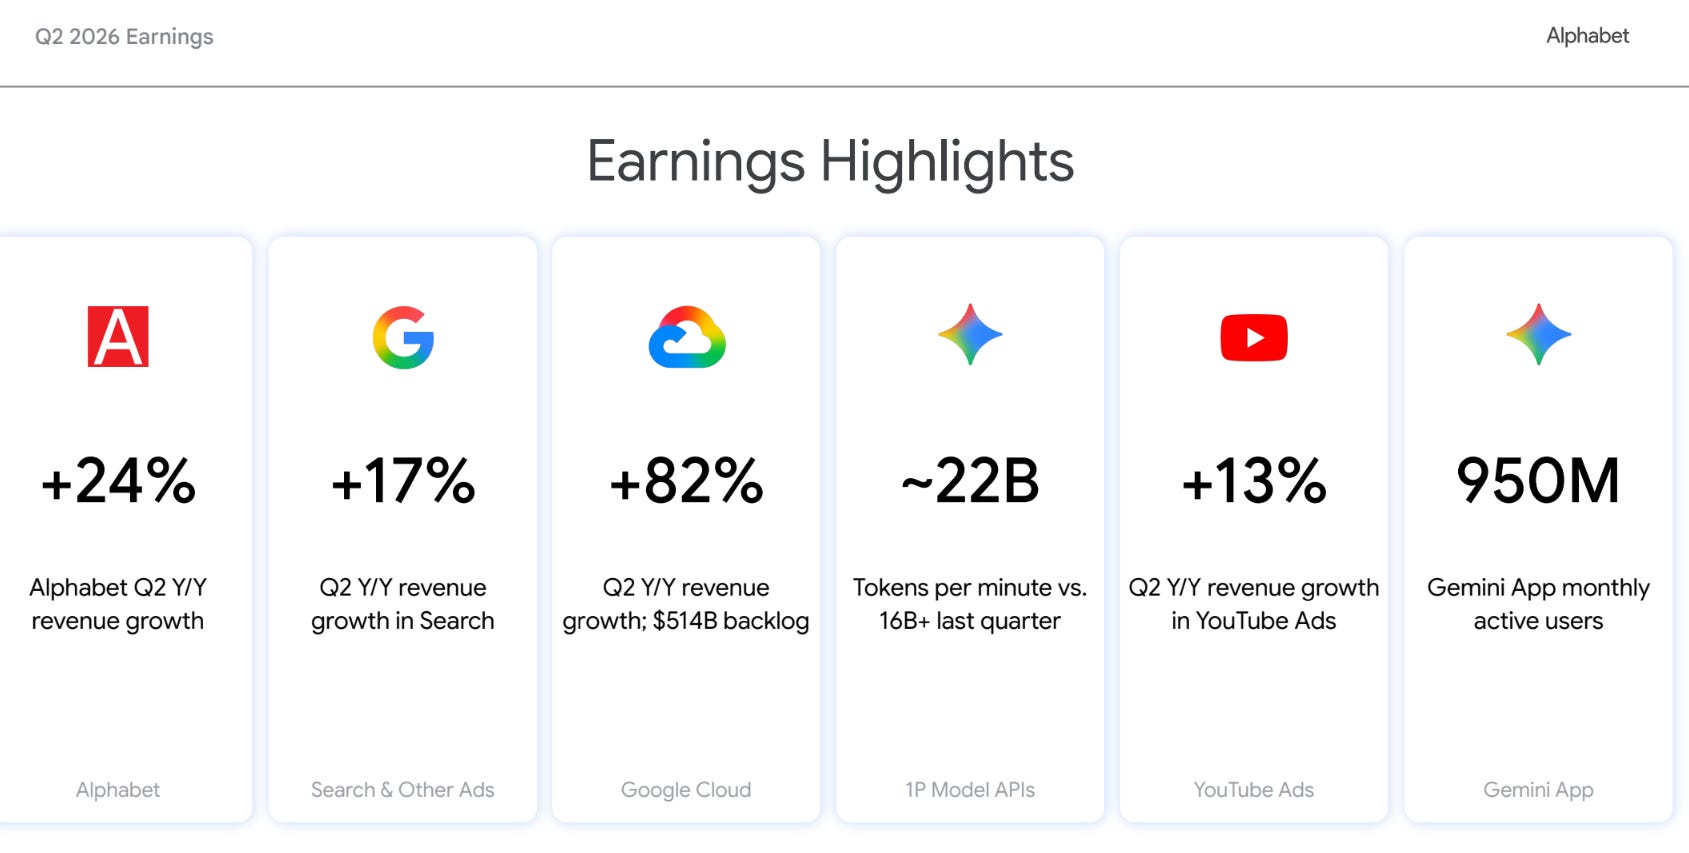
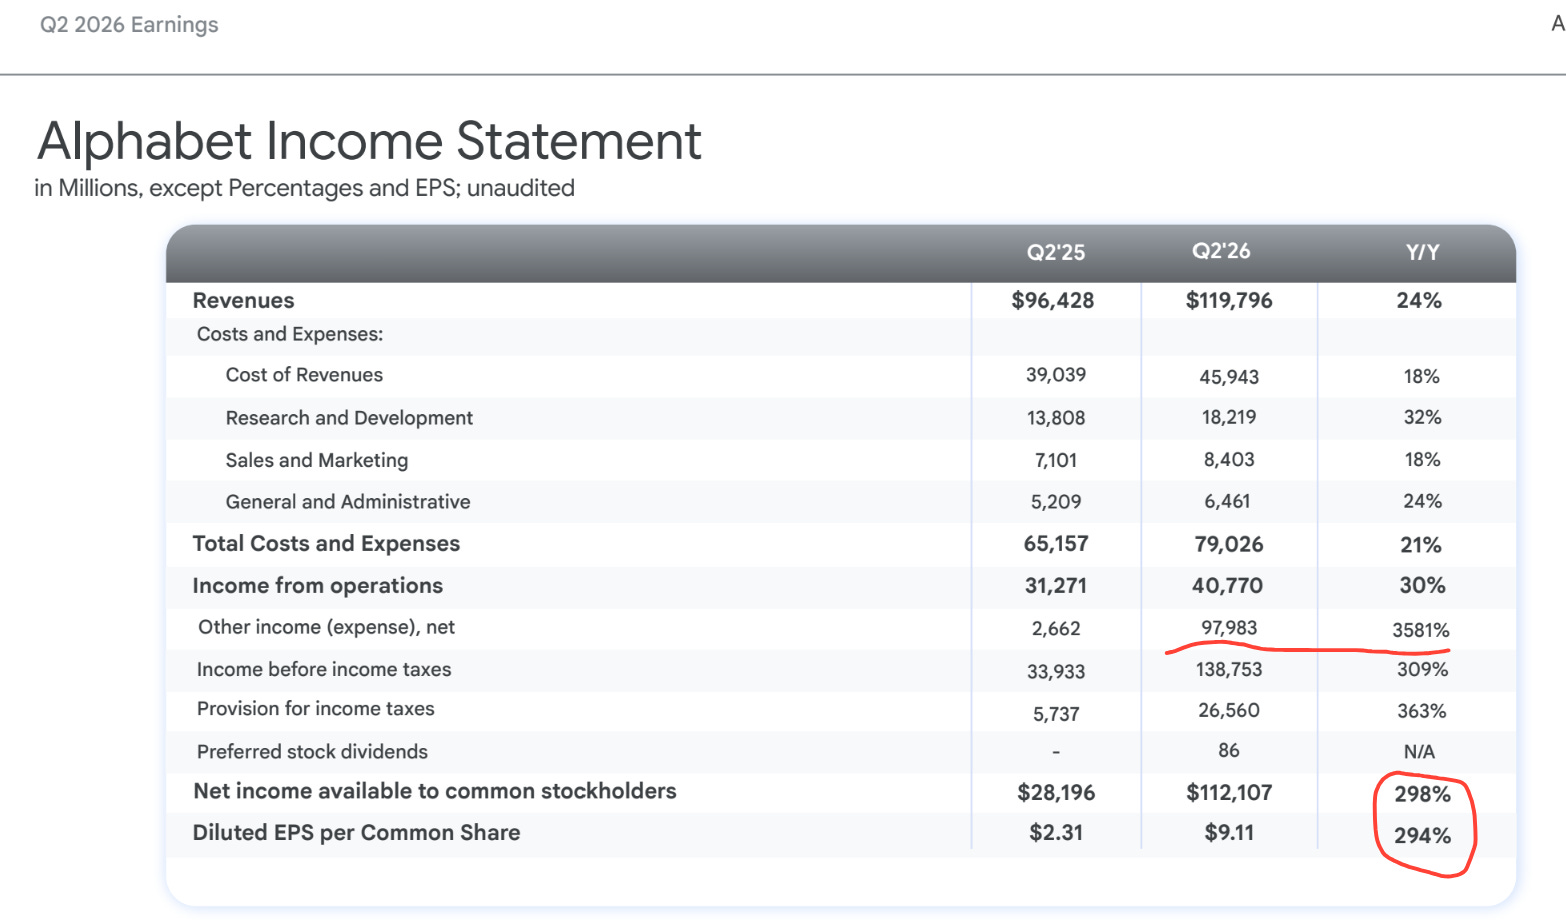
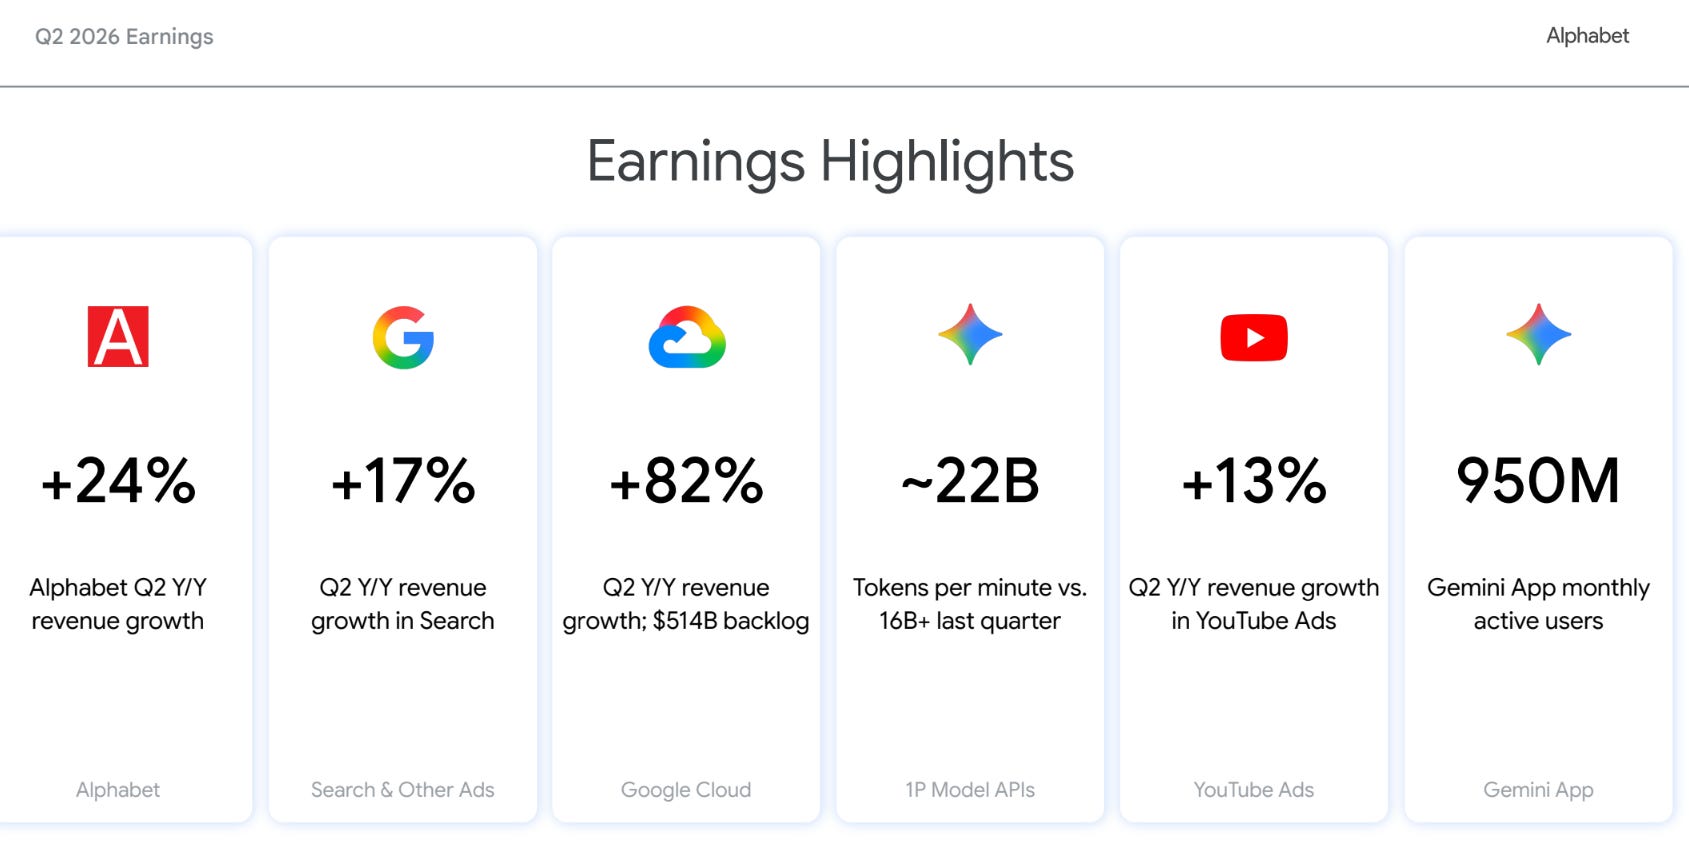
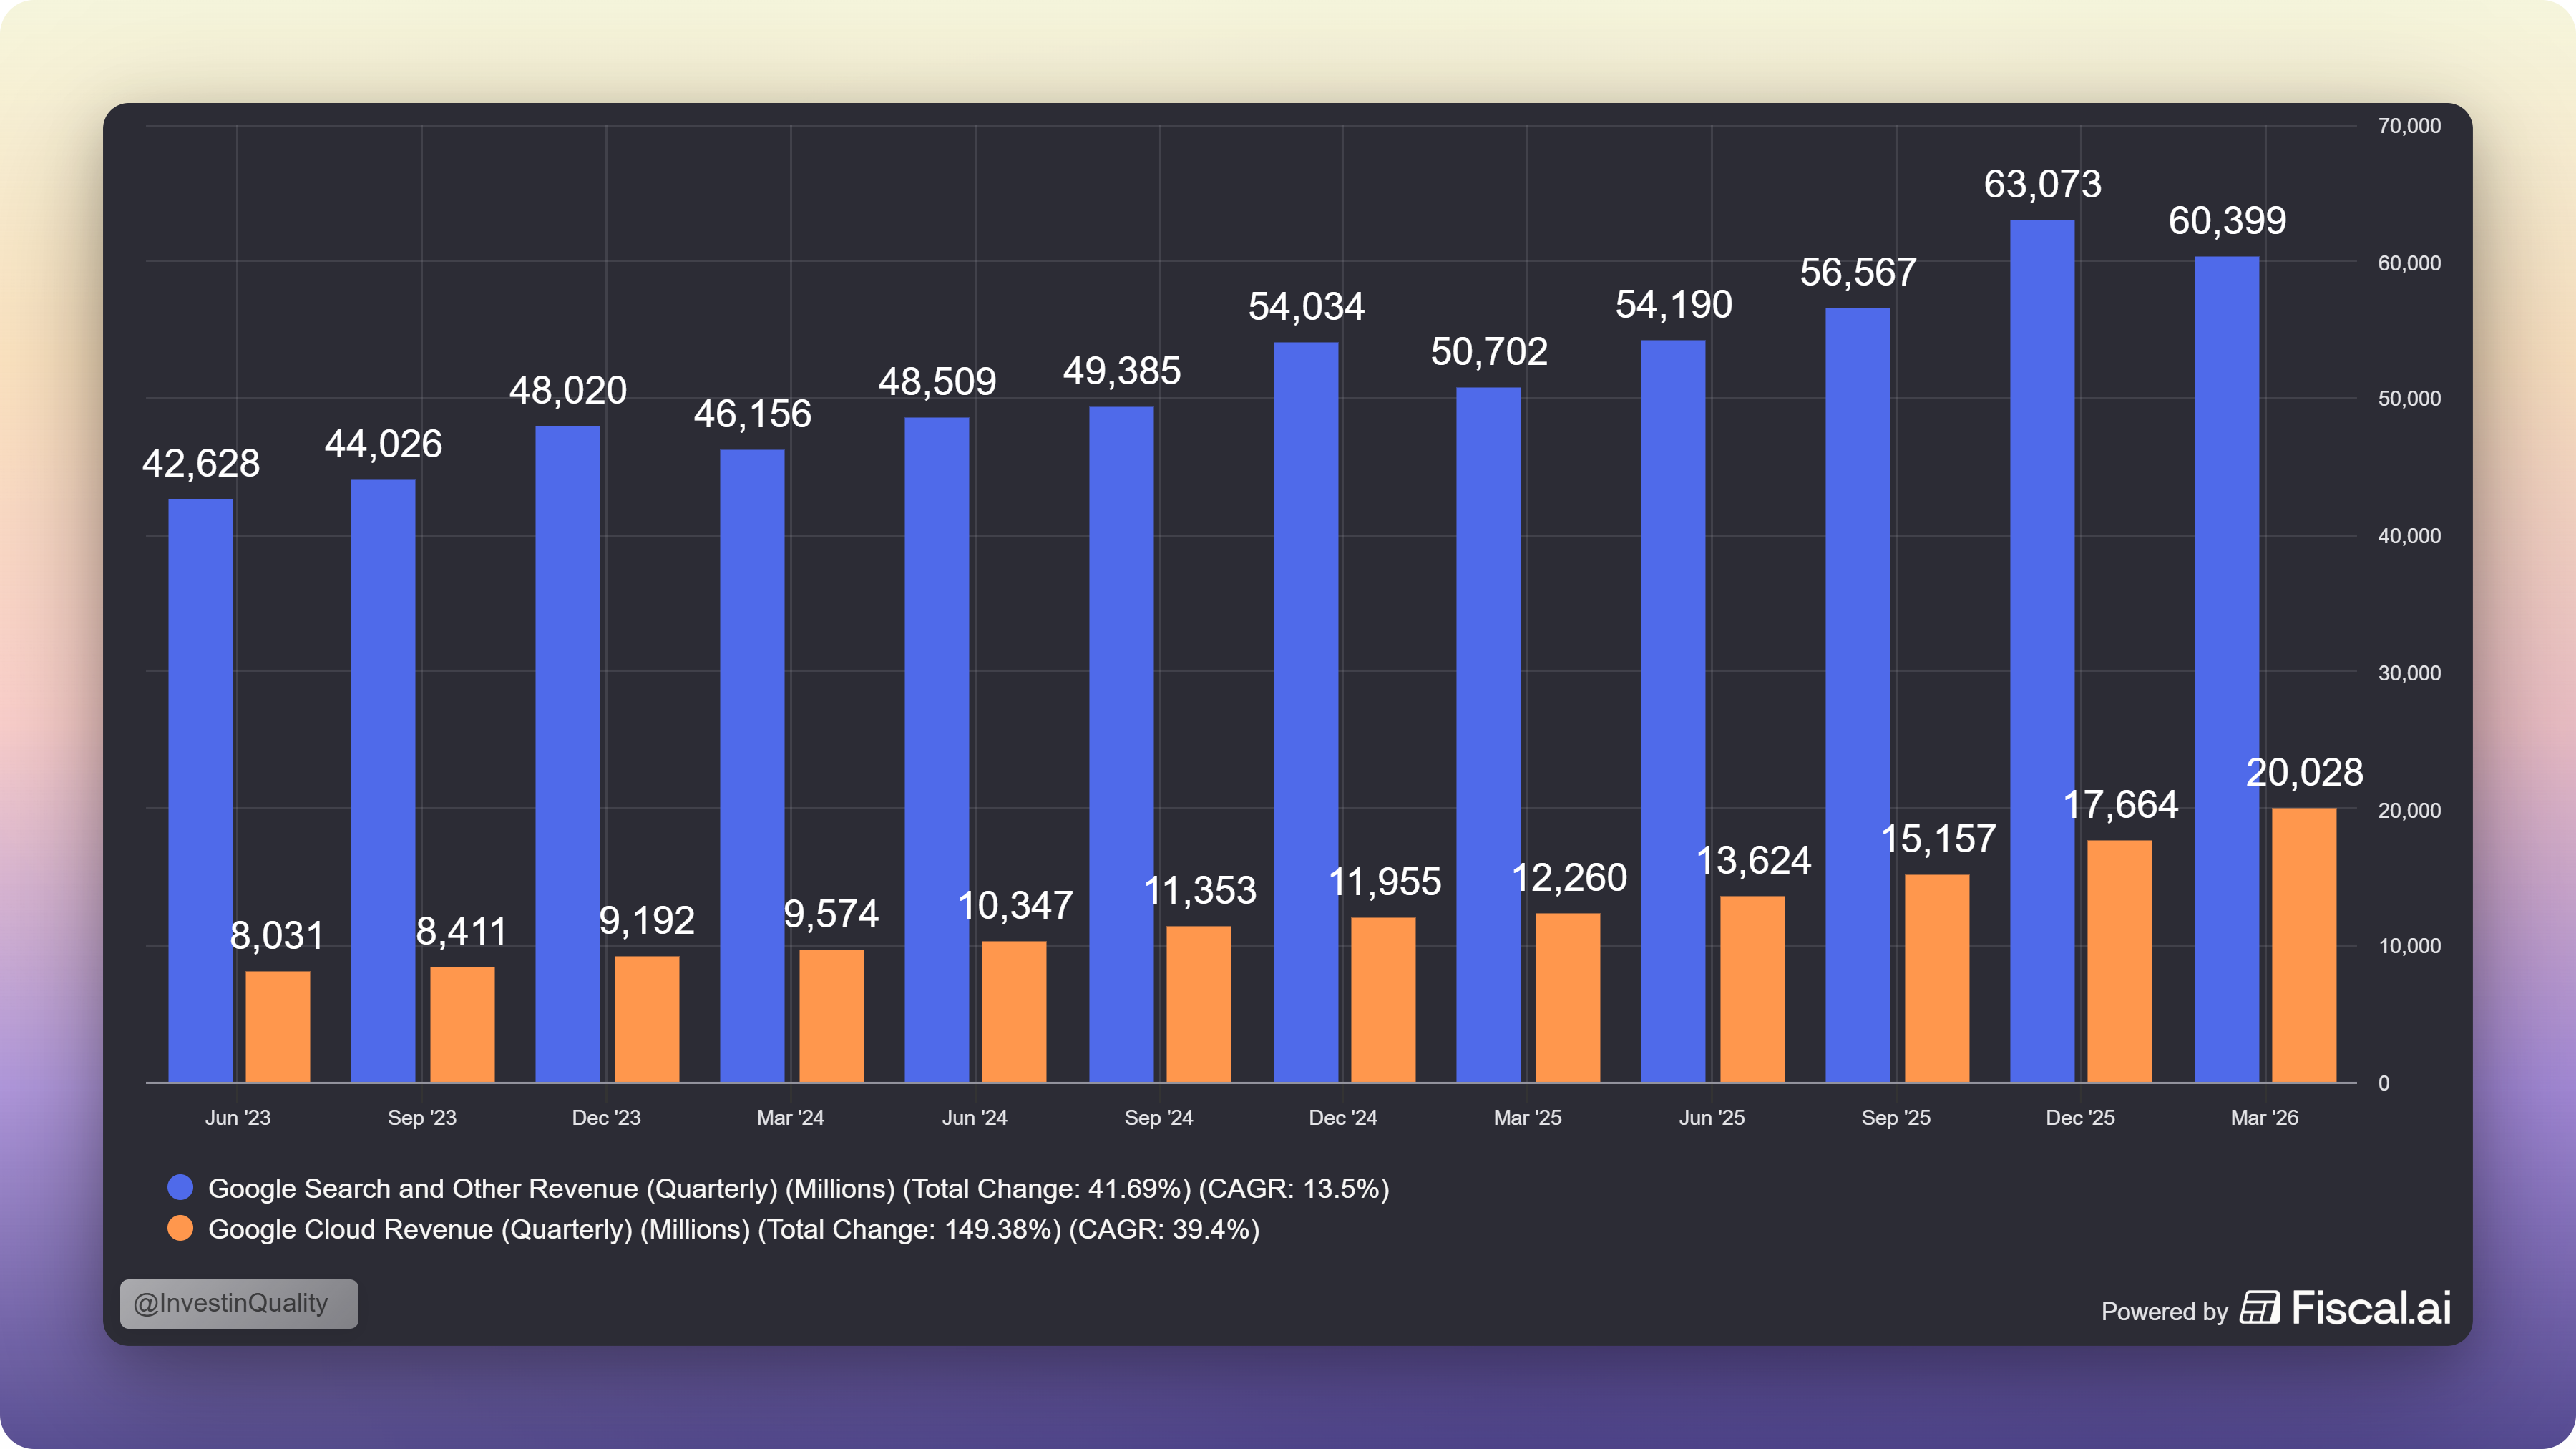
Just look at these numbers, the total revenues were up +24%, with a 17% increase in Search revenue, and 82% (!) increase in Google Cloud (With an insane, $514 billion backlog), and a +13% increase in YouTube Ads revenue.

The story of the quarter is the incredible growth of Google Cloud, but before we get into that, lets look at the other business segments.

Subscribe now

Google Services ($94.5 billion, +15%)

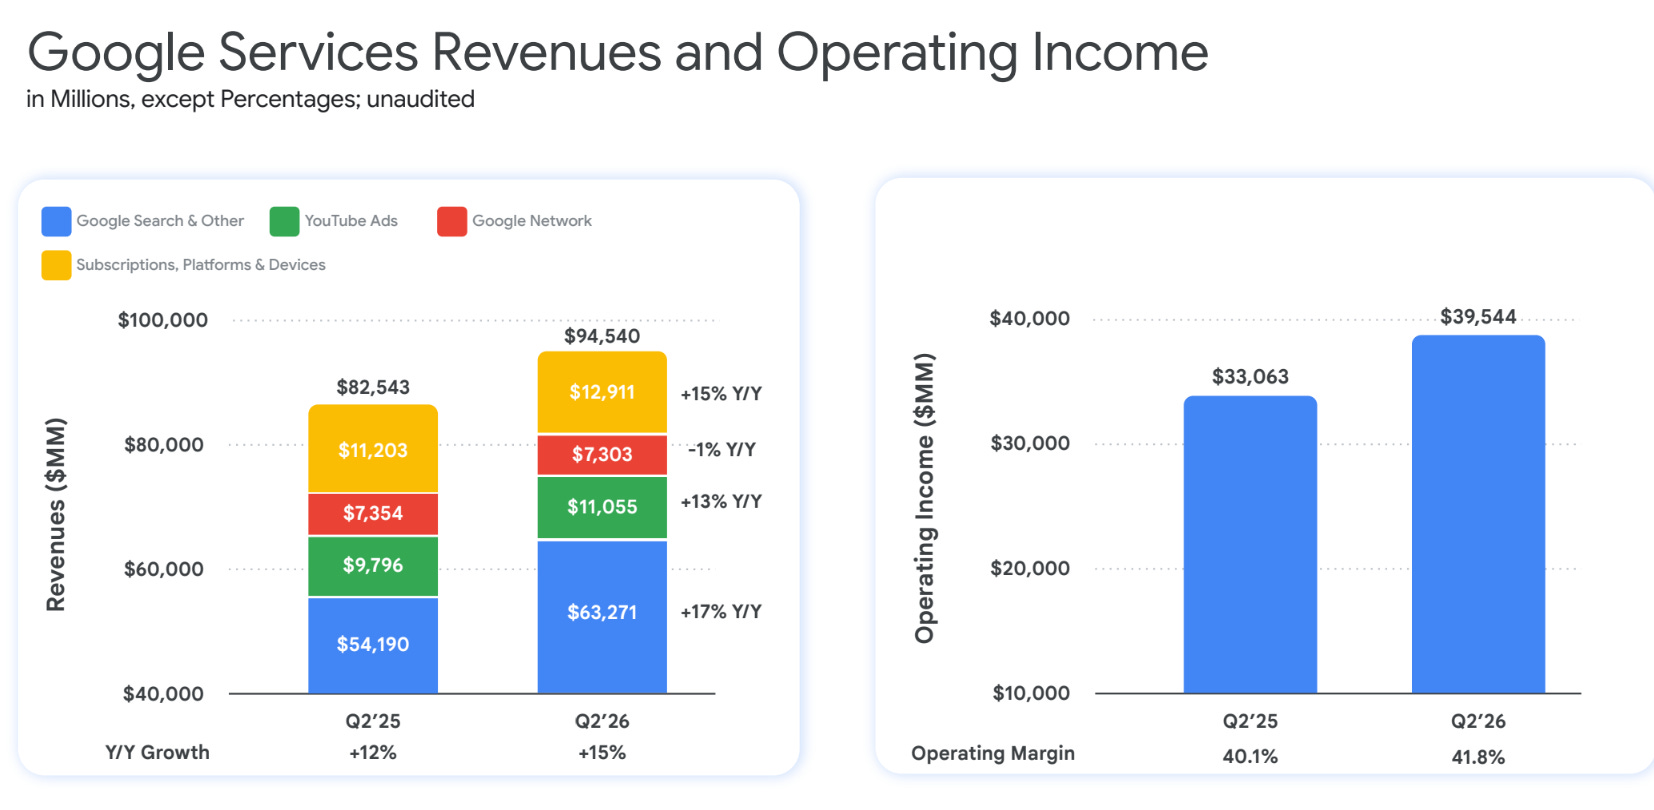
Consisting of Search that grew 17% to $63.3 billion, YouTube ads that grew 13%, to $11.1 billion, Google Network that contracted by 1%, and Subscriptions that grew 15% to $12.9 billion.

Search and Subscriptions posted a strong quarter, but we see YouTube ads and Google Network struggle more. Of course this is all overshadowed by Cloud and CapEx this quarter, but something I’m keeping an eye on moving forward.

This was said about the Subscriptions segment on the earnings call on what drove the growth:

“Due to strong growth in both YouTube subscriptions... and Google One, which was driven by demand for AI plans”

A top line growth of +15% with expanding operating margins from 40.1% to 41.8% is an excellent quarter in my book.

Google Cloud growing +82% YoY

Now, lets get into the headline story of the quarter.

Cloud is firing on all cylinders.

Not only is demand high, but this is the first quarter where Alphabet recognized revenue from TPU system sales delivered to data centres.

This is interesting, because it works as a second growth leg for Google Cloud, here is what management had to say about it:

“…we continue to expect to recognize a relatively small portion of the revenues from our existing TPU system sales agreements this year, ramping as we exit 2026... the vast majority of the revenues from these agreements will be realized in 2027.”

The TPU sales will hit the P&L in 2027, which is very interesting and could be a huge growth driver for Alphabet.

However, this is unrealized and in the future. What is true right now, is that Cloud just posted its best quarter ever.

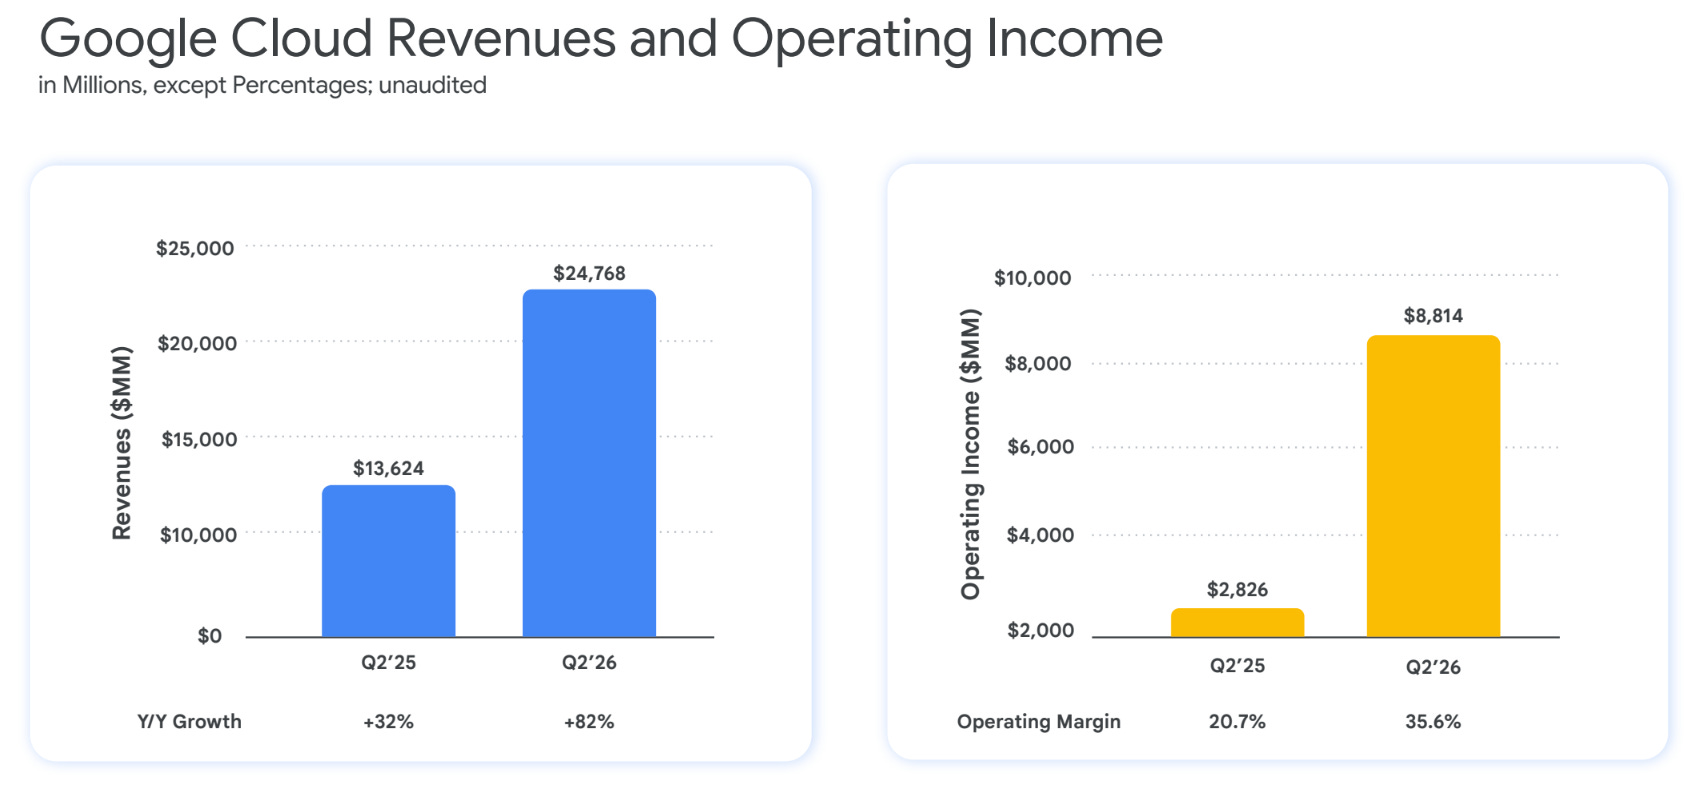
Revenues almost doubled from $13.6 billion to $24.7 billion. Operating margins expanded significantly from 20.7% in Q2 25 to 35.5% in Q2 26 (Just insane).

When I first saw these numbers, I thought it was a blowout quarter, and that the stock price would boast upwards.

But of course, there is more to the story that concerned analysts and investors.

Anat, Alphabet’s CFO, was direct on the earnings call about Cloud margin risks:

“Given the supply-constrained environment, we plan to expand the use of third-party capacity in Q3 as a bridging strategy... it will create modest margin pressure in the near term.”

What I’m reading from this, is that the strong Q2 margins is a high mark, and not necessarily the baseline.

Alphabet will be renting outside compute to keep serving demand it can’t (yet) fill internally.

This is how Sundar looks at this strategic move:

“a short-term cost over a few months may be very high, in the lifetime of the deal... highly ROI positive.”

This is a classic short-term pain for long-term gain play, but the market will always punish a business for this, as the long-term gain is uncertain.

Subscribe now

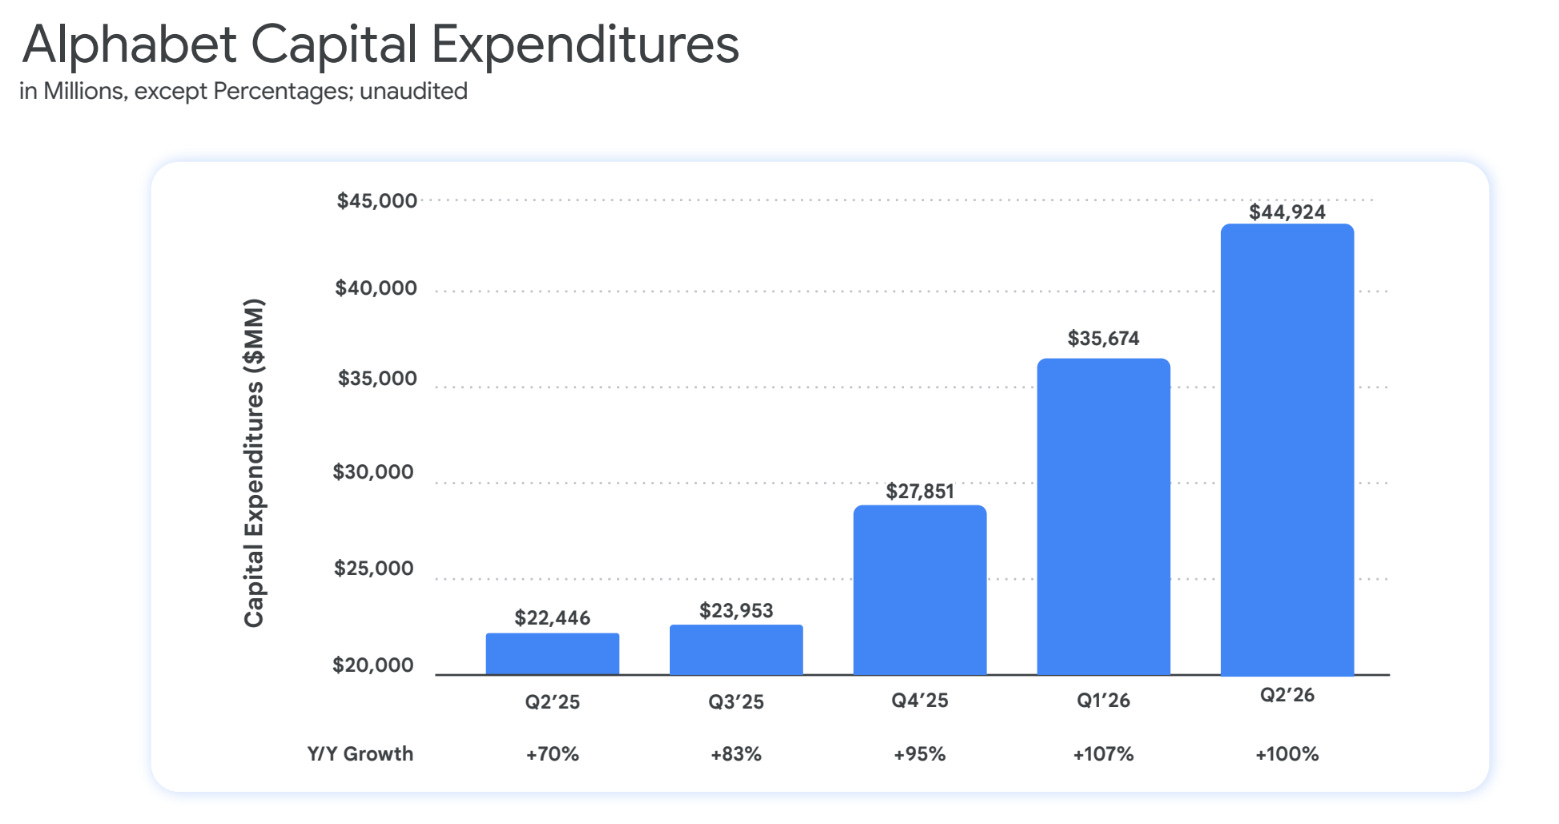
Capital Expenditure reached $44.9 billion

Another reason why the market is a bit shaky in Alphabet (And the rest of the hyperscalers), is their insane CapEx plans.

The prevailing question is: Will these hundreds of billions yield a good return on investment?

The management team expressed a growing confidence in the investments:

“I think the dynamics look healthier than where we were about a year ago, that’s what gives us the confidence to undertake those investments.”

What I think is interesting is the added commentary on the backlog:

”we expect to recognize just over 50% of the total backlog as revenue over the next 24 months”

This basically gives us a sanity-check on the CapEx, because we can easily follow this statement up in the coming earnings report to see if Alphabet manages to do practice what they preach.

Earnings goes parabolic (+298% YoY)

Another story worth mentioning is one that many investors get wrong.

I’ve seen multiple investors claim that Alphabet is severely overvalued, and point to the earnings bloating from the most recent quarter.

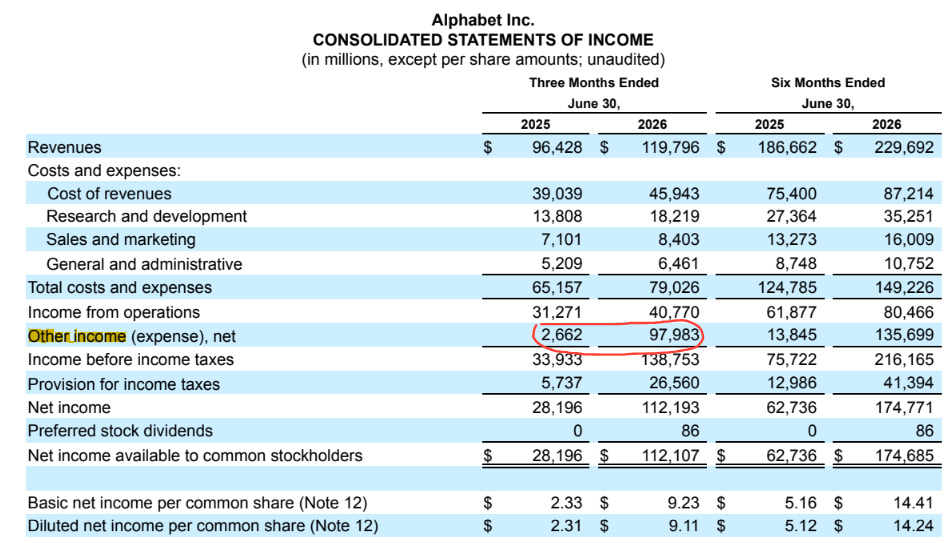
It is true that the earnings is bloated this quarter, this is because Alphabet got $97.9 billion of its Net income from “Other income (expense), net” this quarter.

Why is that? Well, Alphabet owns between 4% and 6% of SpaceX. It paid $900 million for a 7.5% stake of SpaceX in 2015 (Which has since been diluted).

SpaceX went public this quarter, and much of the gains were realized in the income statement of Alphabet. Most of the $97.9 billion is from this increase in marketable securities.

So, not from Alphabets operations, but from an (incredibly good) investment they’ve made.

This is understood by serious investors, and we should not use the headline numbers to base our valuation on.

Even if you exclude the earnings from investment gains, this was a great quarter.

Income from operations grew from $31 billion to $40.7 billion (+30.3% YoY). A great result from Alphabet which reflects the business growth.

Negative Free Cash Flows

My final point will be on FCF.

Alphabet has been a cash generating machines for decades.

However, it has taken a deliberate choice to suppress FCF to invest heavily in infrastructure to support its next leg of growth.

You can disagree with the market on punishing stock for making this move, but the market does what it always do. It discounts risk.

There is a lot of uncertainty in the investments Alphabet is making, even if it makes logical sense, it is still unproven.

When (or if) Alphabet starts posting fantastic results (In terms of growth and market share), the stock price will follow. But until that proof is here, the market remains cautious.

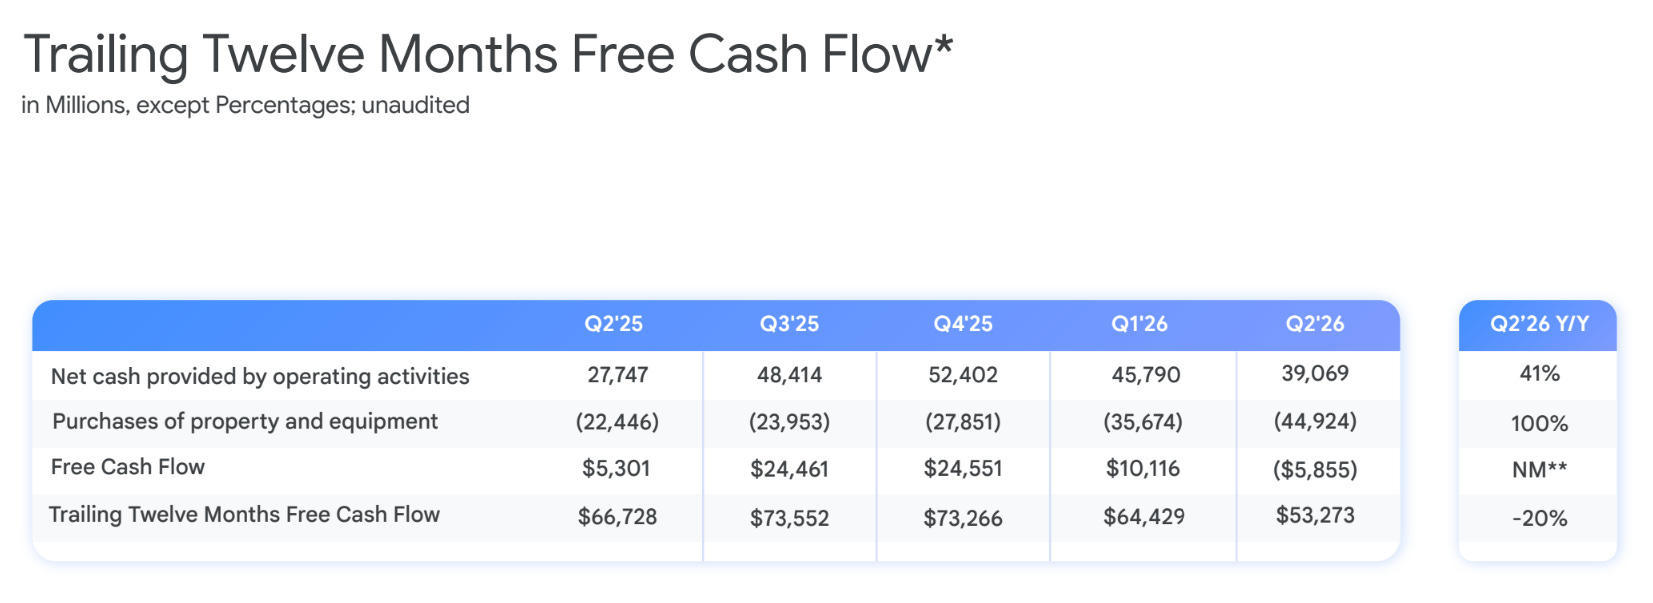
Despite this, if we just look at the operations, Alphabet’s Net cash provided by operating activities increased 41% YoY.

However, the Free Cash Flow went negative (-$5.855 billion) in Q2, due to a heavy $44.9 billion CapEx investment.

Conclusion

A record breaking quarter for Alphabet, especially from the Google Cloud business segment.

Search and subscriptions are also holding up well and continue to grow rapidly, even at its massive scale (Remember a few years ago, when Search was deemed dead?).

The fantastic operational results were overshadowed by a more cautious market, looking at:

  • Margin risk from Cloud (Due to borrowed capacity - remember, short-term pain, long-term gain).

  • Capital expenditure uncertainty. Burning $44.9 billion in one quarter is no joke, and the market has not yet decided if this is a good investment.

  • Negative free cash flows. It is deliberate, but it’s never a positive to see a cash generator post negative FCF numbers.

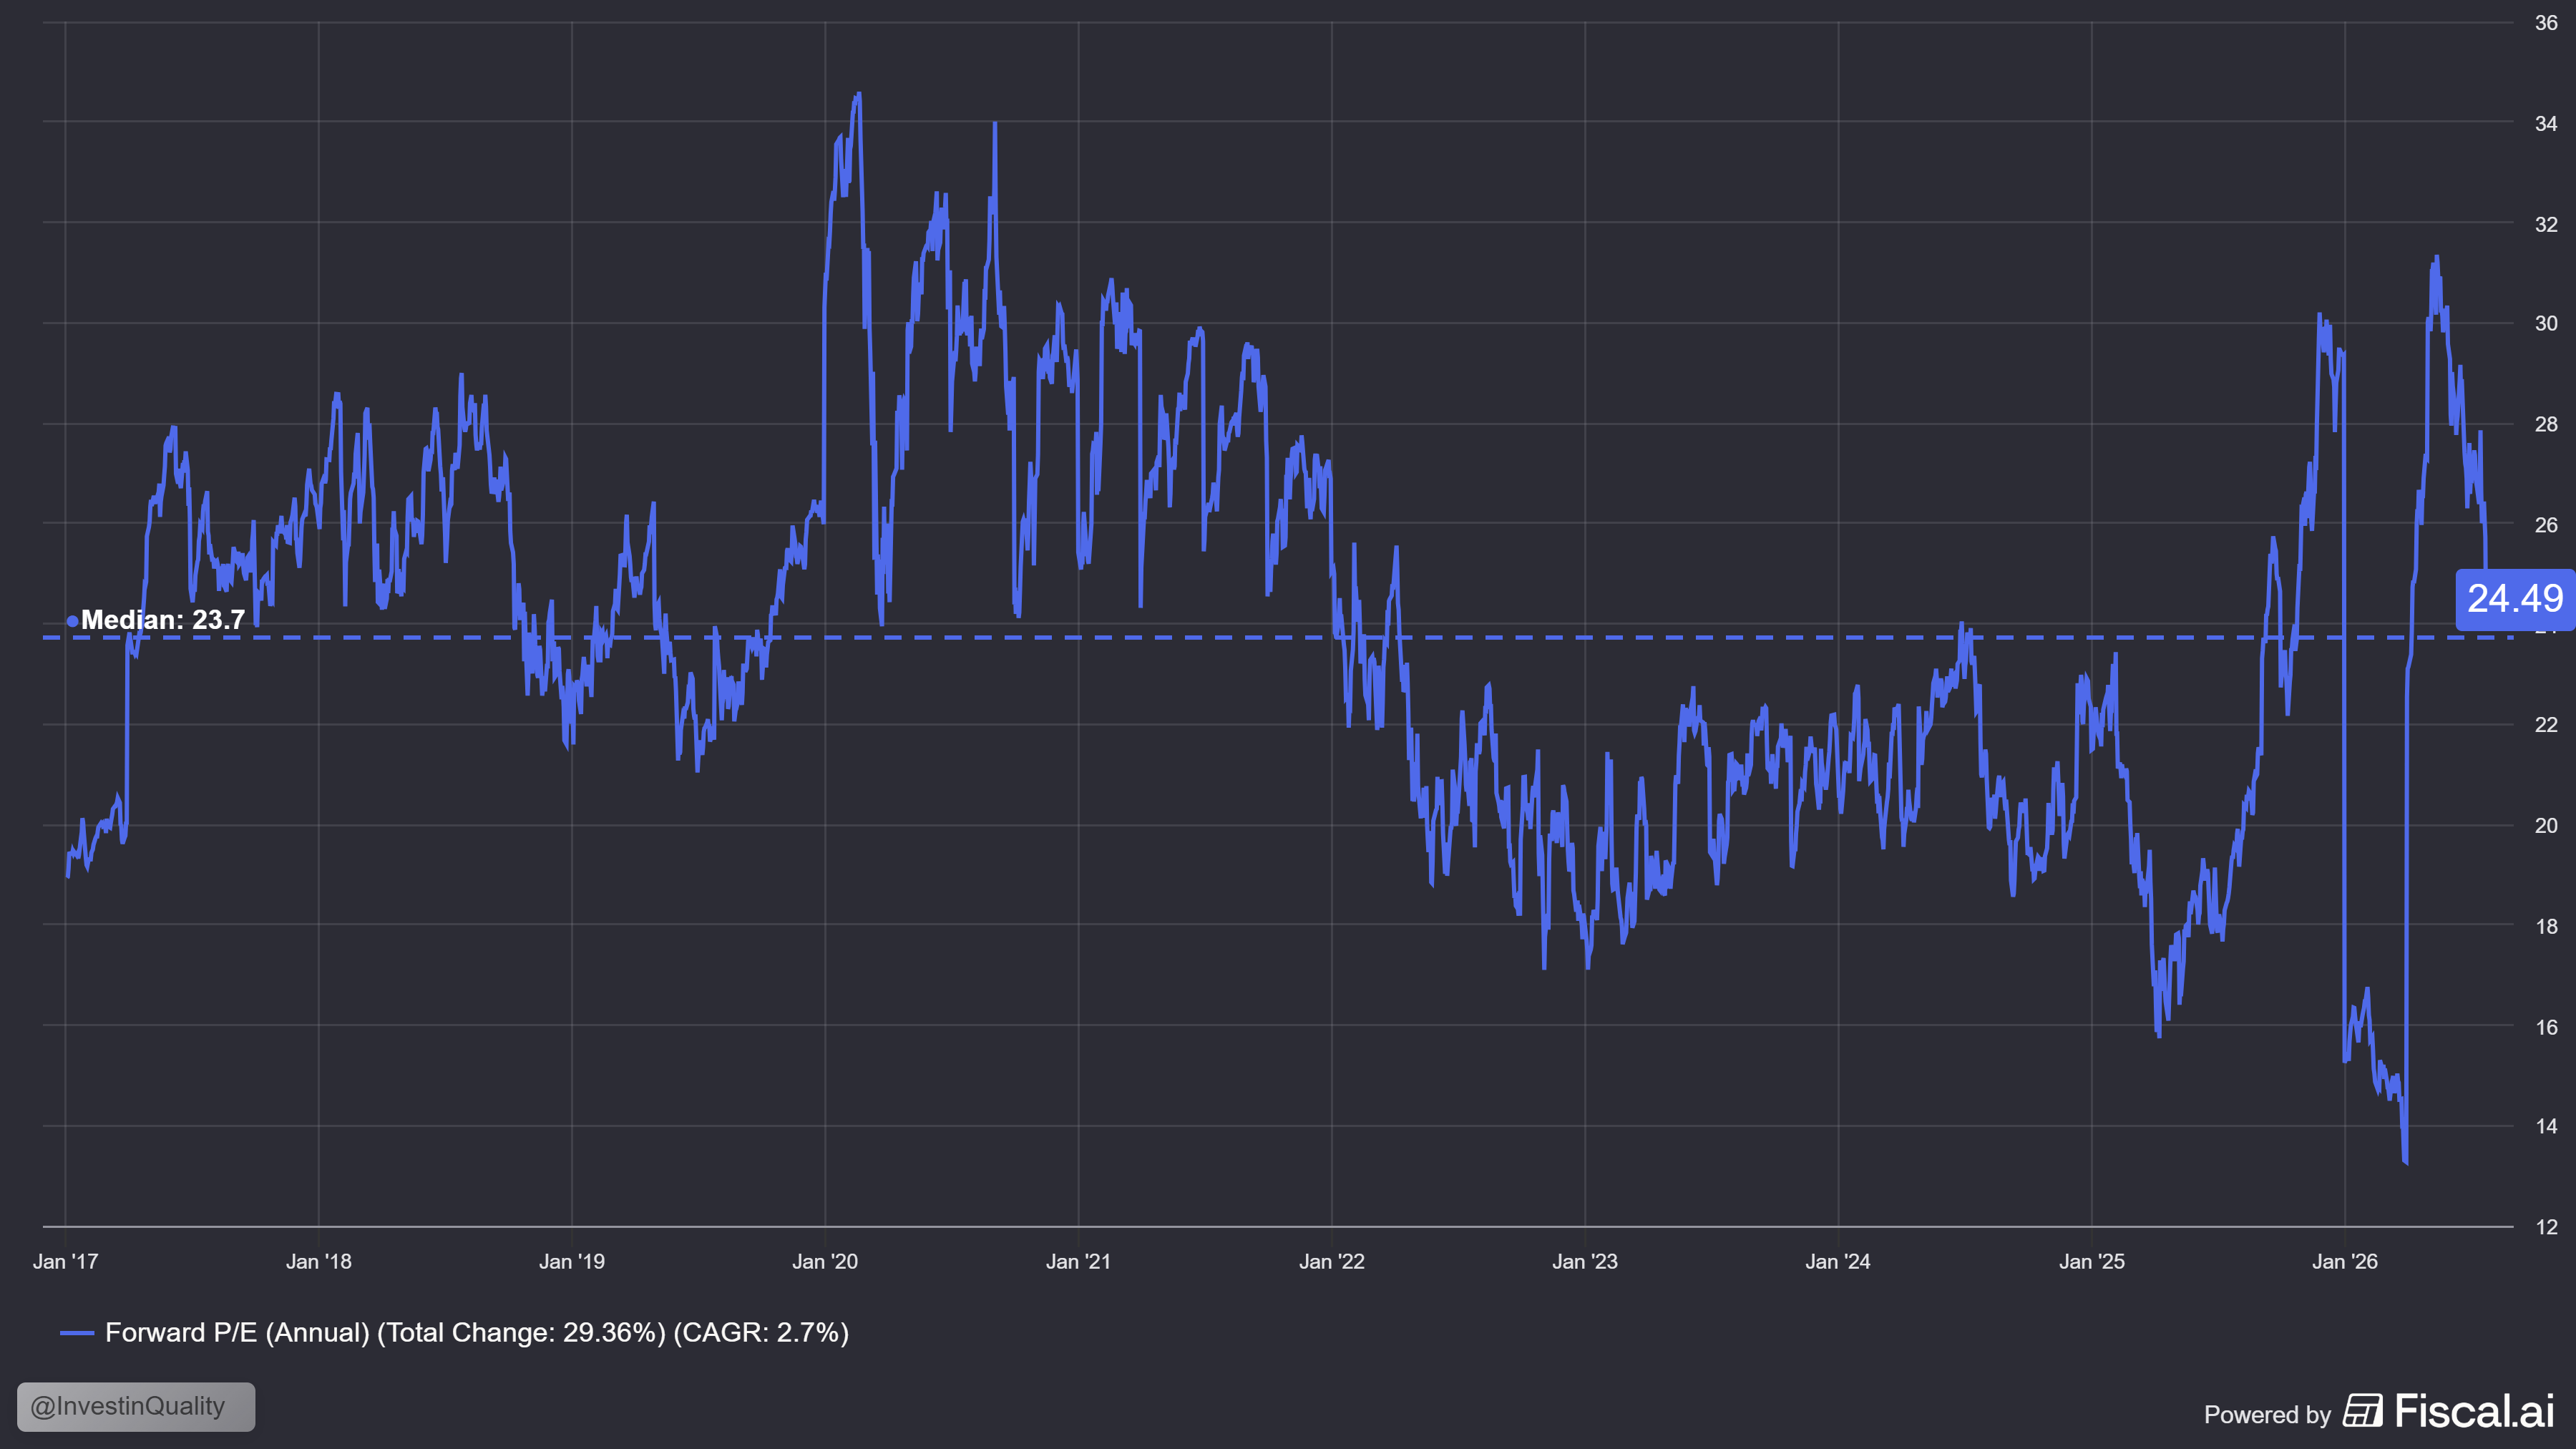
In addition, the incredible SpaceX investment has bloated the Net Income and EPS numbers. The result from this is that if we look at the current PE, it is 16.4x. This is of course without excluding the one-time effect from Alphabet’s equity investments.

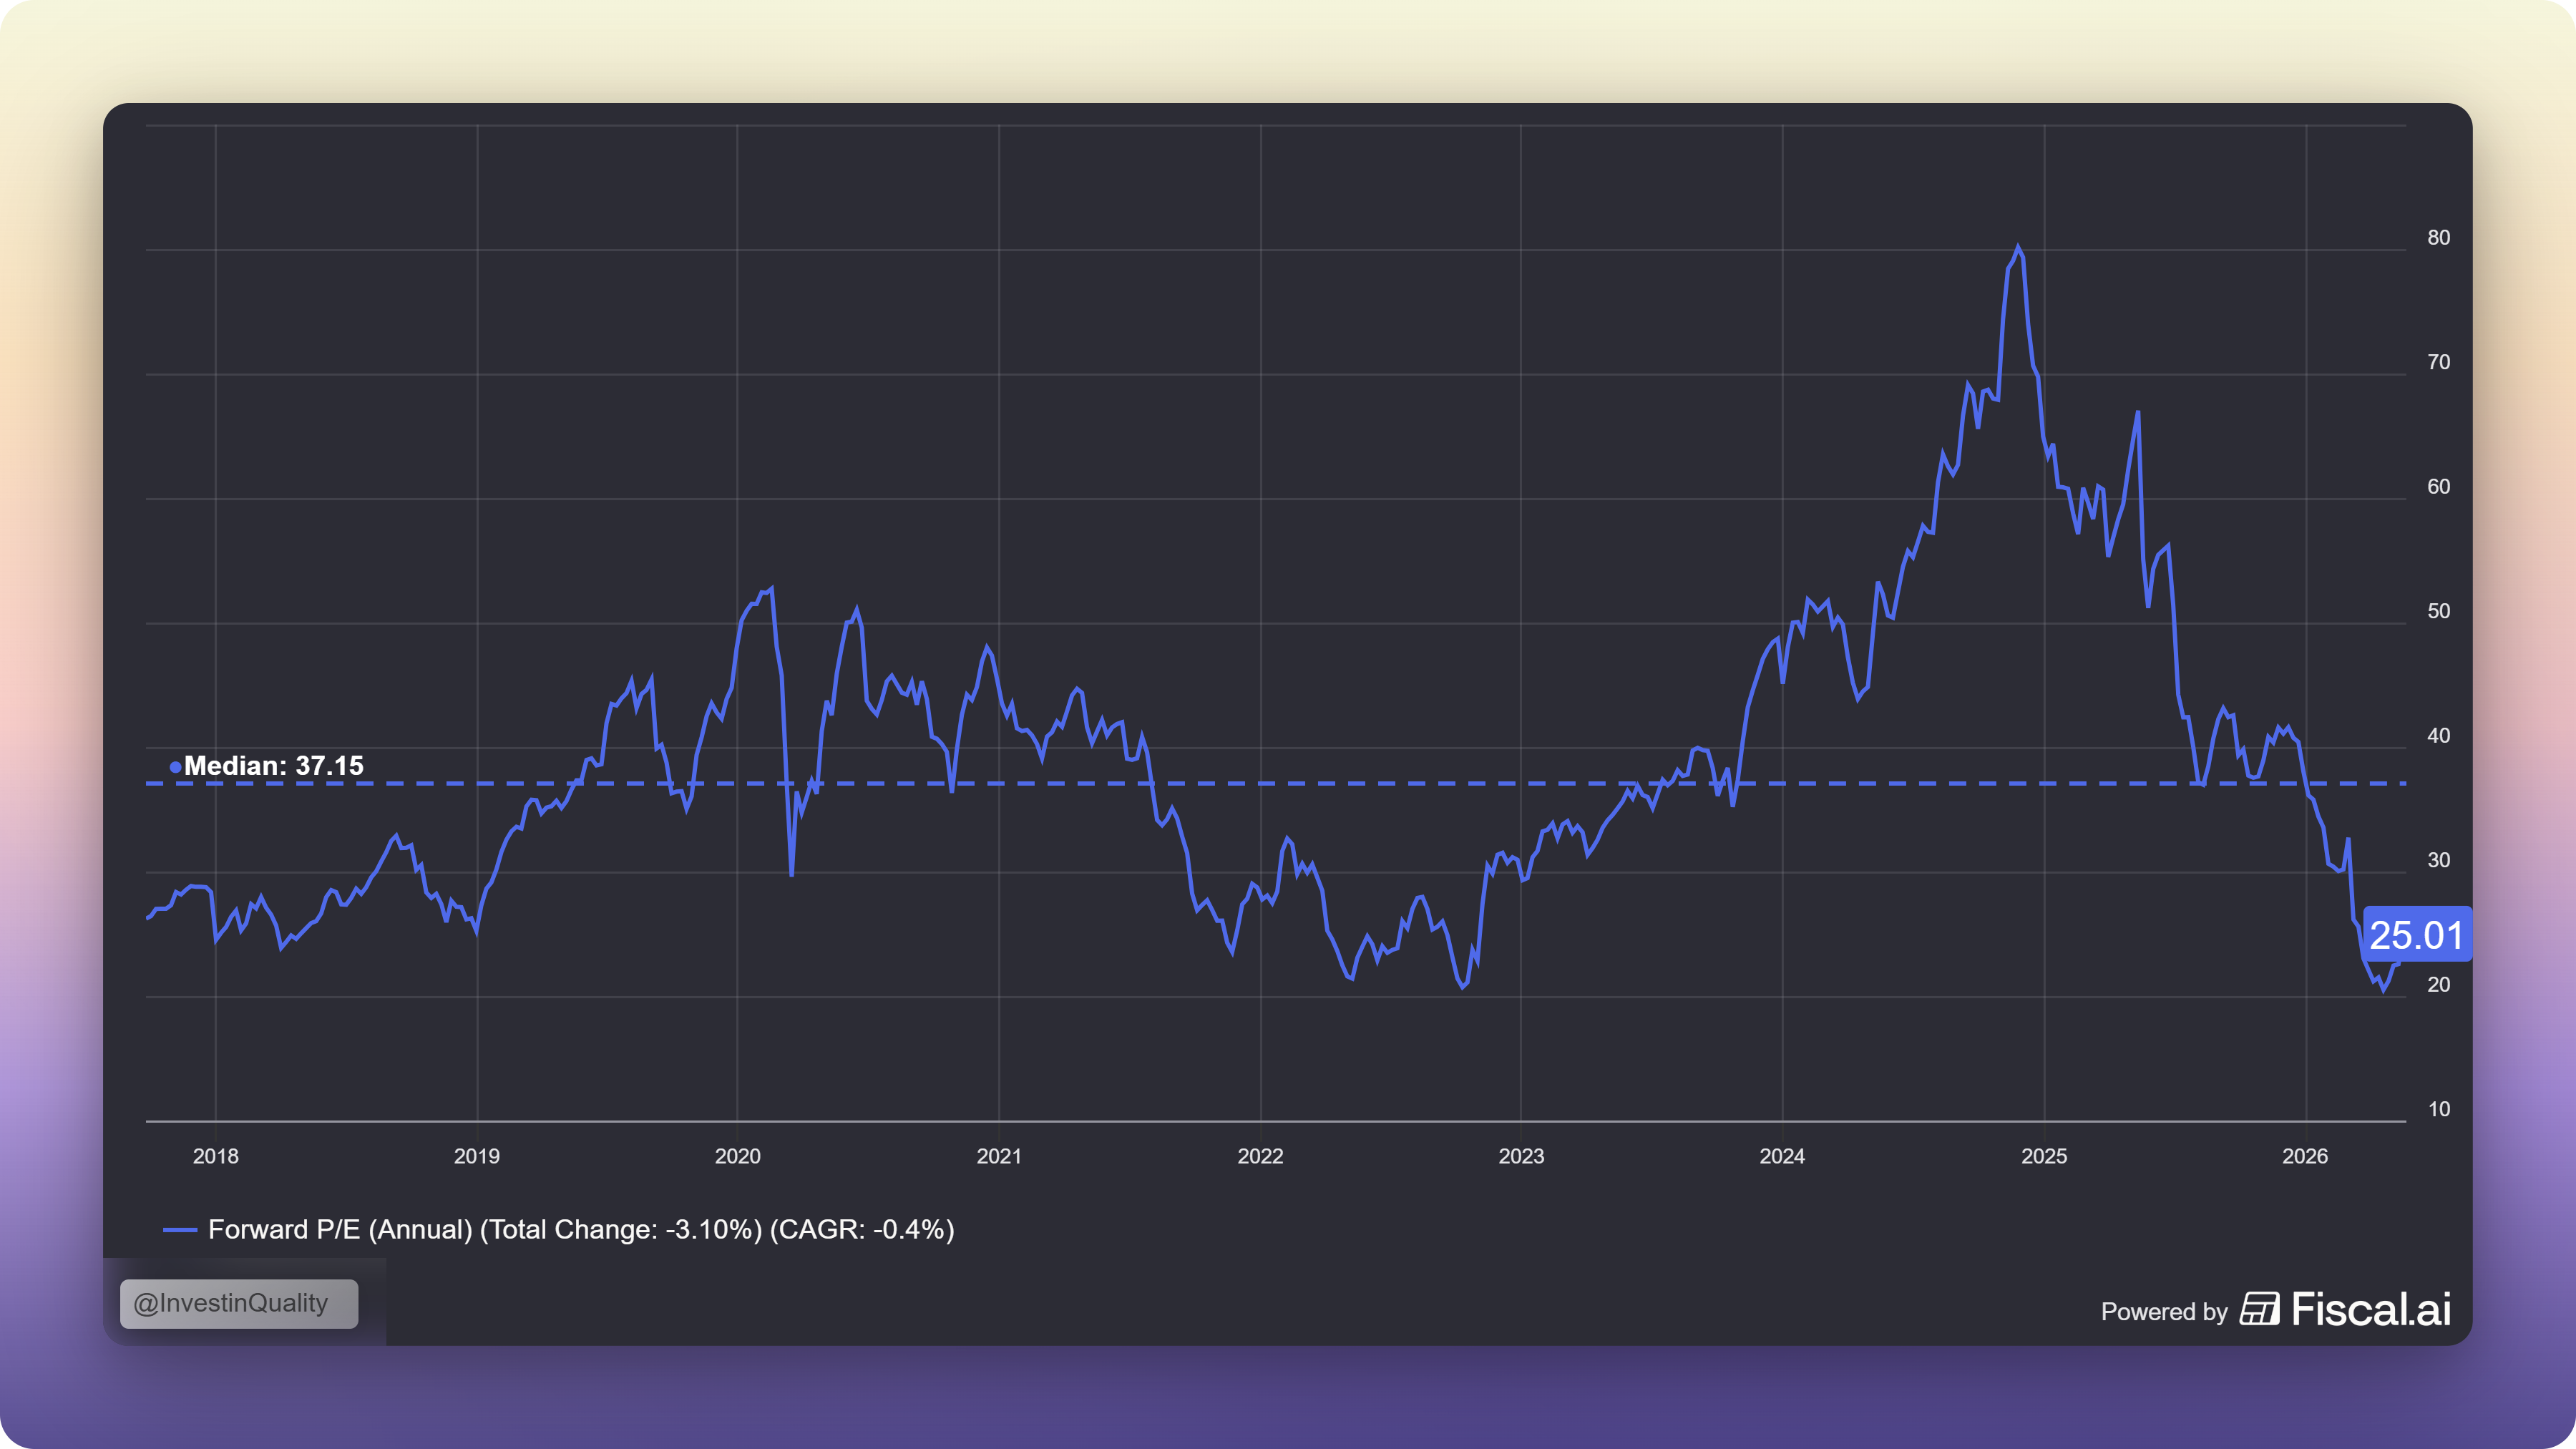
The forward PE of 24.5x is more accurate to use, and it is still in line with its 10 year median forward PE:

That’s it for today! Leave your thoughts in the comments below, or reply to this email.

Subscribe now

Ready to take the next step? Here’s how I can help you grow your investing journey:

  1. Go Premium — Unlock exclusive content and follow our market-beating Quality Growth portfolio. Learn more here.

  2. Essentials of Quality Growth — Join over 300 investors who have built winning portfolios with this step-by-step guide to identifying top-quality compounders. Get the guide.

  3. Free Valuation Cheat Sheet — Discover a simple, reliable way to value businesses and set your margin of safety. Download now.

  4. Free Guide: How to Identify a Compounder — Learn the key traits of companies worth holding for the long term. Access it here.

  5. Free Guide: How to Analyze Financial Statements — Master reading balance sheets, income statements, and cash flows. Start learning.

  6. Get Featured — Promote yourself to over 24,000 active stock market investors with a 42% open rate. Reach out: investinassets20@gmail.com

☐ ☆ ✇ Invest in Quality

SaaS-Stocks that Thrive in the Age of AI🚀

By: Invest In Assets 📈

Hi there investor 👋

Every software company that mentions “AI agents” on an earnings call gets sold off.

Invest in Quality is a reader-supported publication. To receive new posts and support my work, consider becoming a free or paid subscriber.

It doesn’t matter if the mention is a warning or a victory lap.

The market has decided that AI is coming for SaaS, and it’s pricing the entire sector with a shotgun instead of a scalpel.

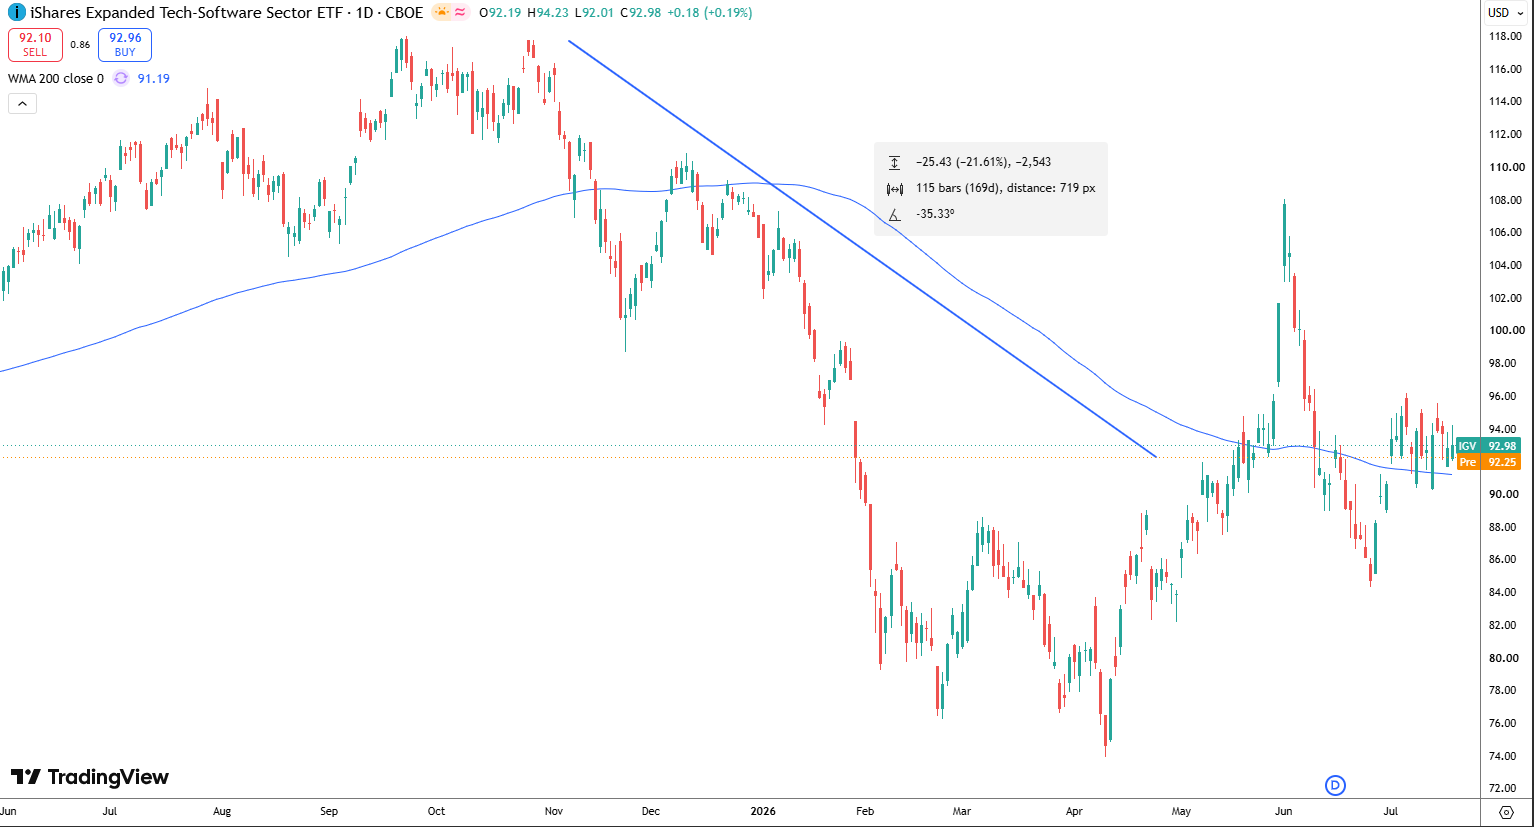
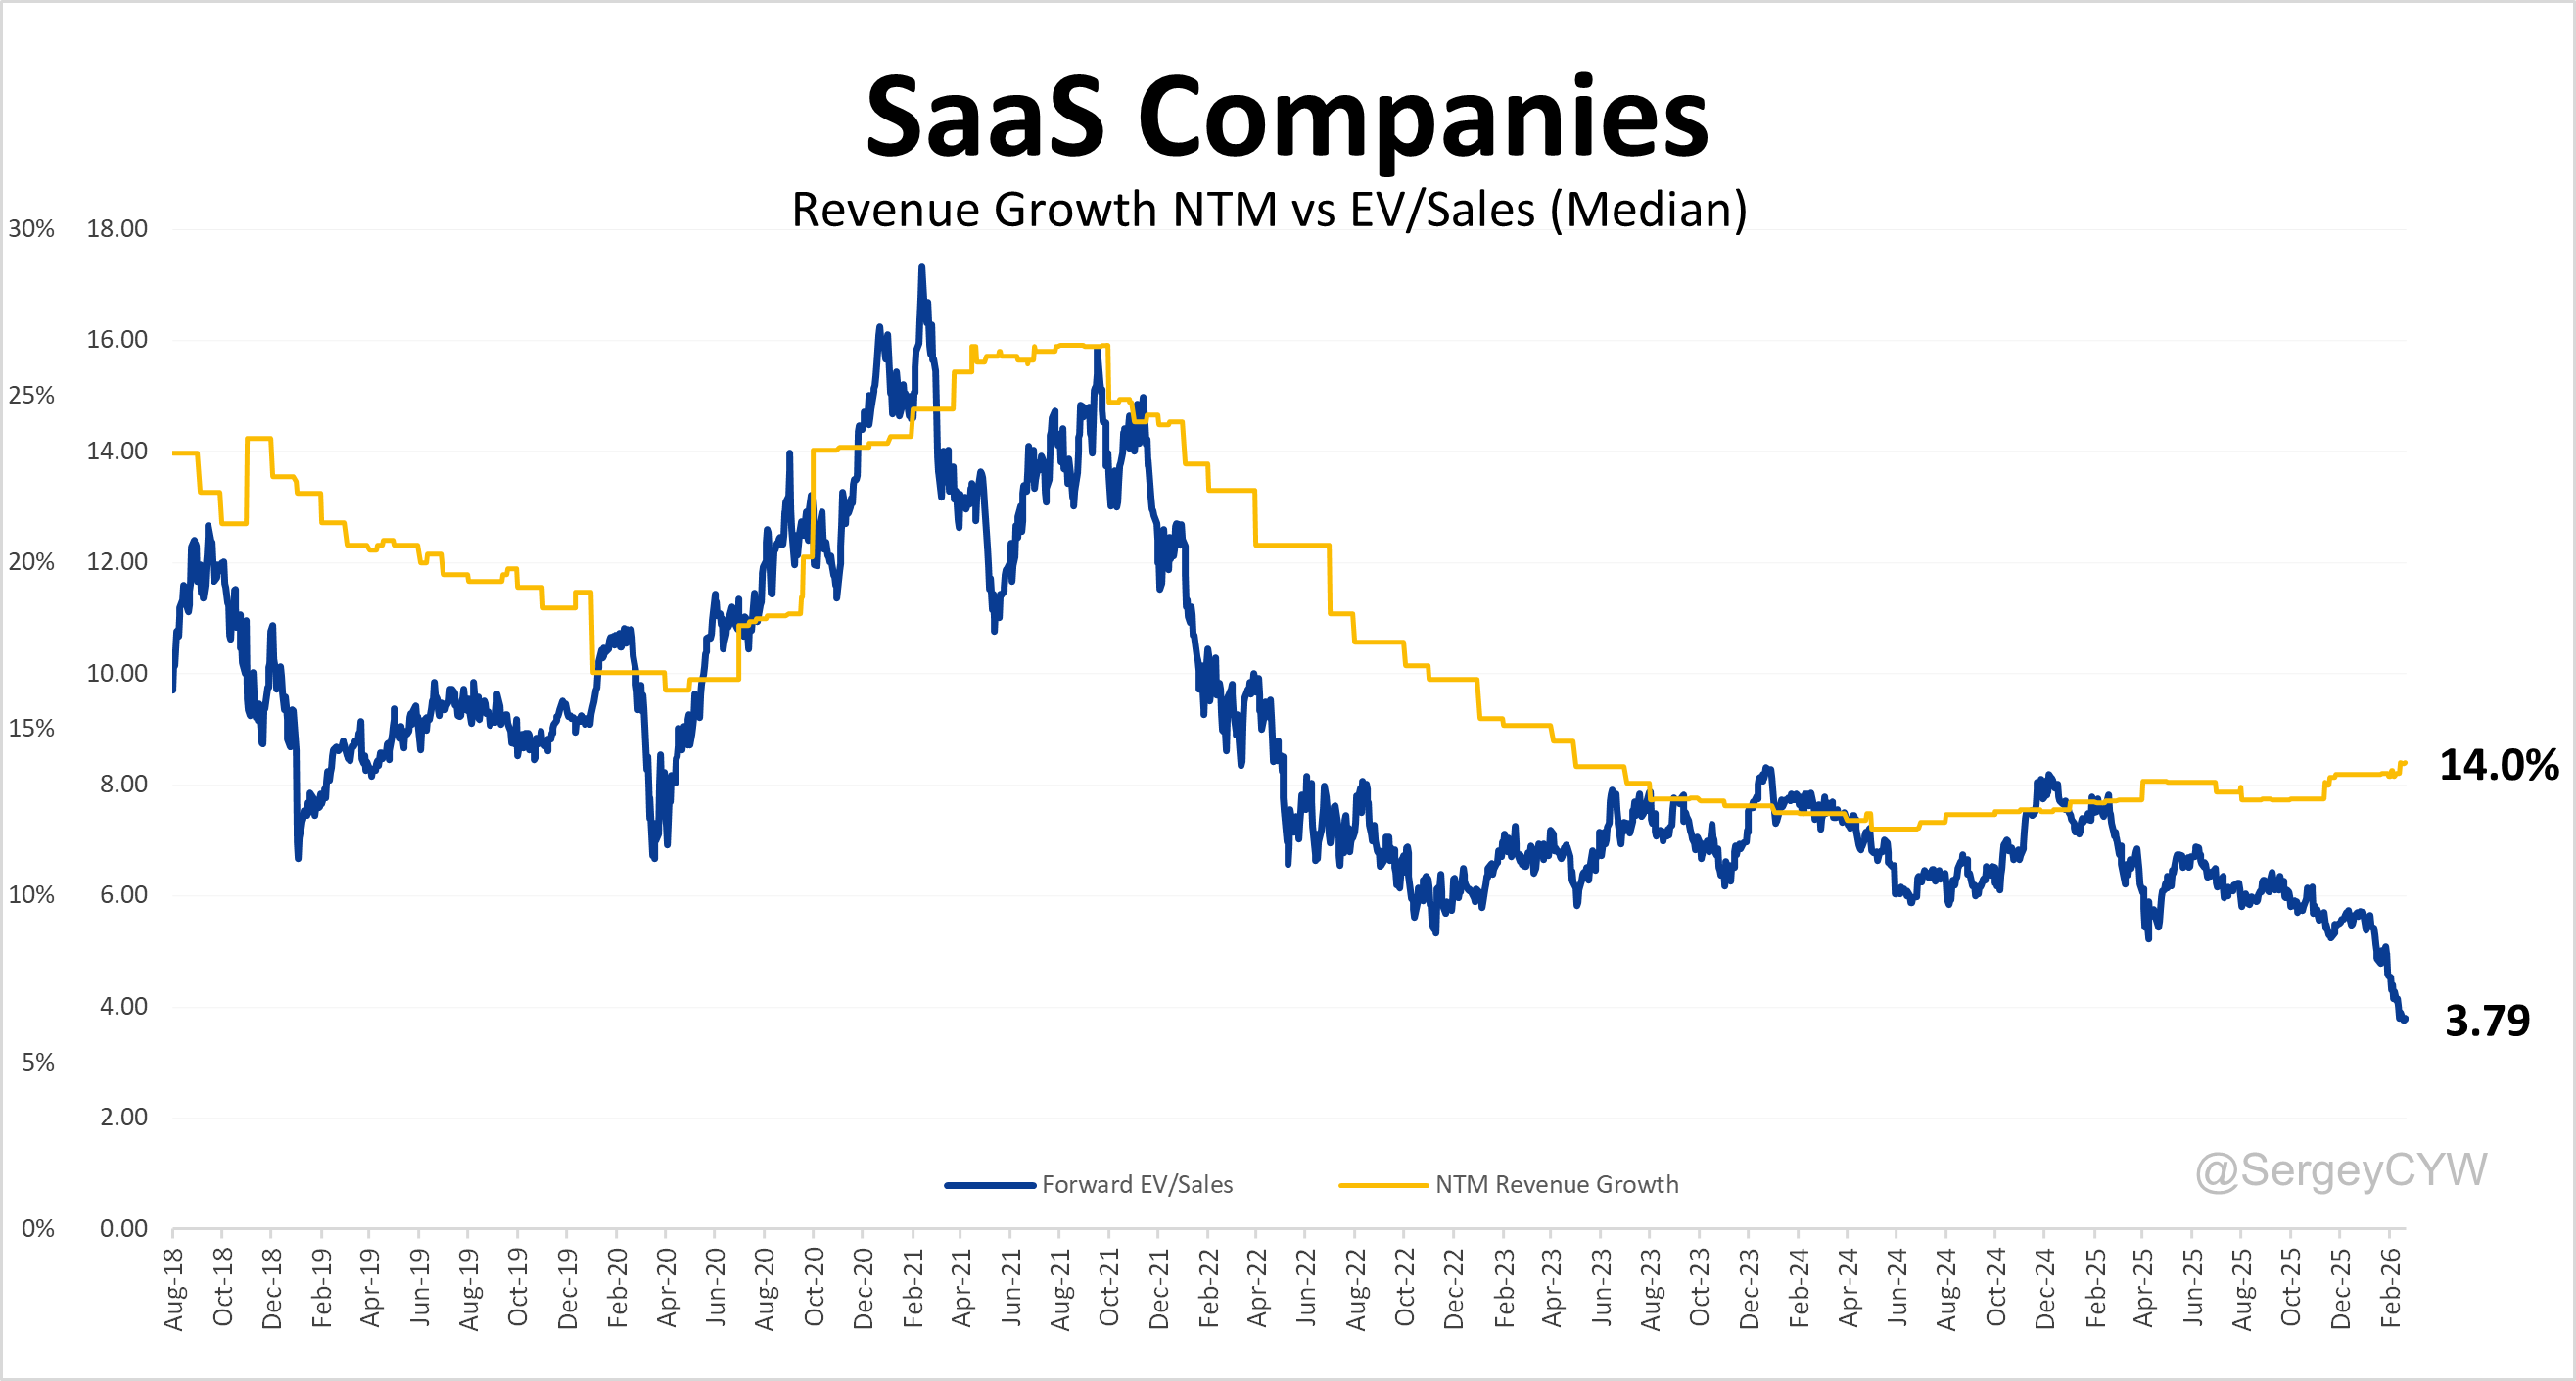
The ETF that track tech-software (Not just SaaS), is down 21.61% from its 2025 highs, and was down as much as -40% in April.

AI is clearly disruptive to the industry - but what companies carry the actual risk?

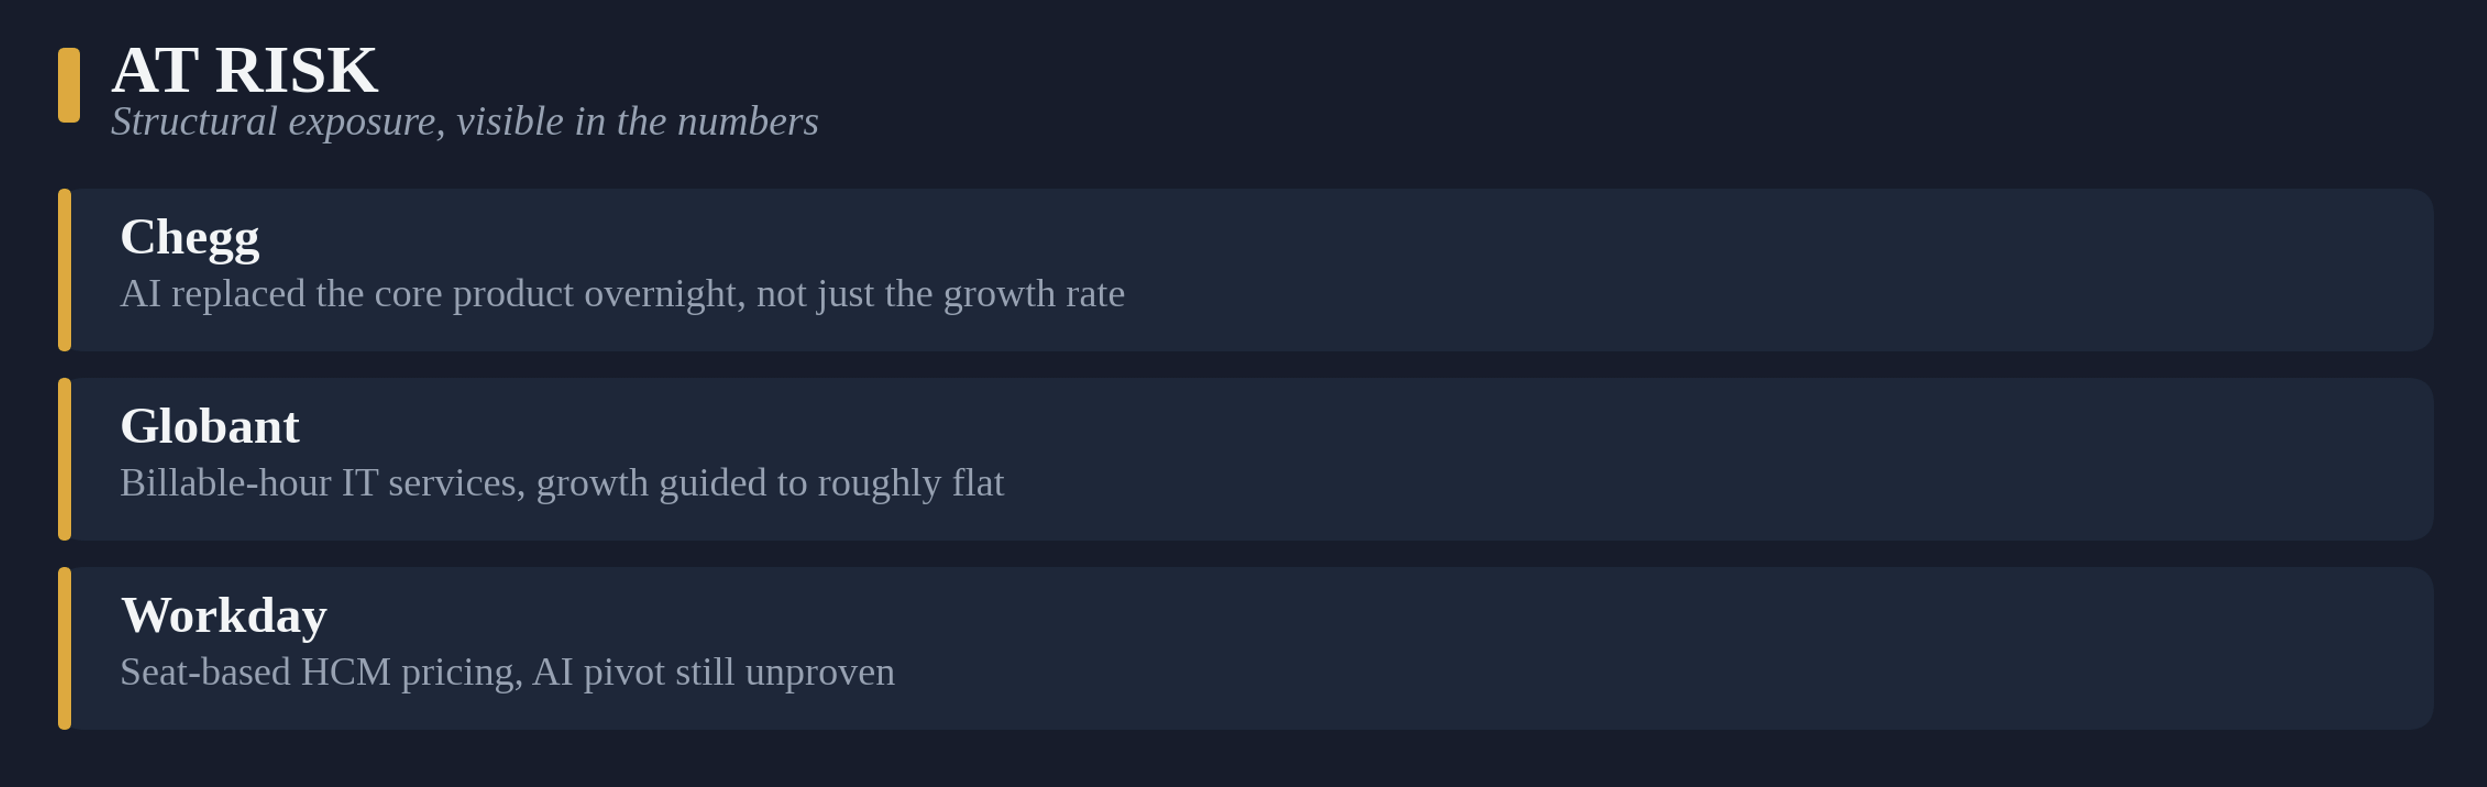
Some of the names getting punished have a real, structural problem.

Others are being dragged down by a narrative that has nothing to do with their actual business.

And a handful are becoming stronger because of AI while trading like they’re becoming weaker.

That gap, between the story and the numbers, is where the opportunity lives.

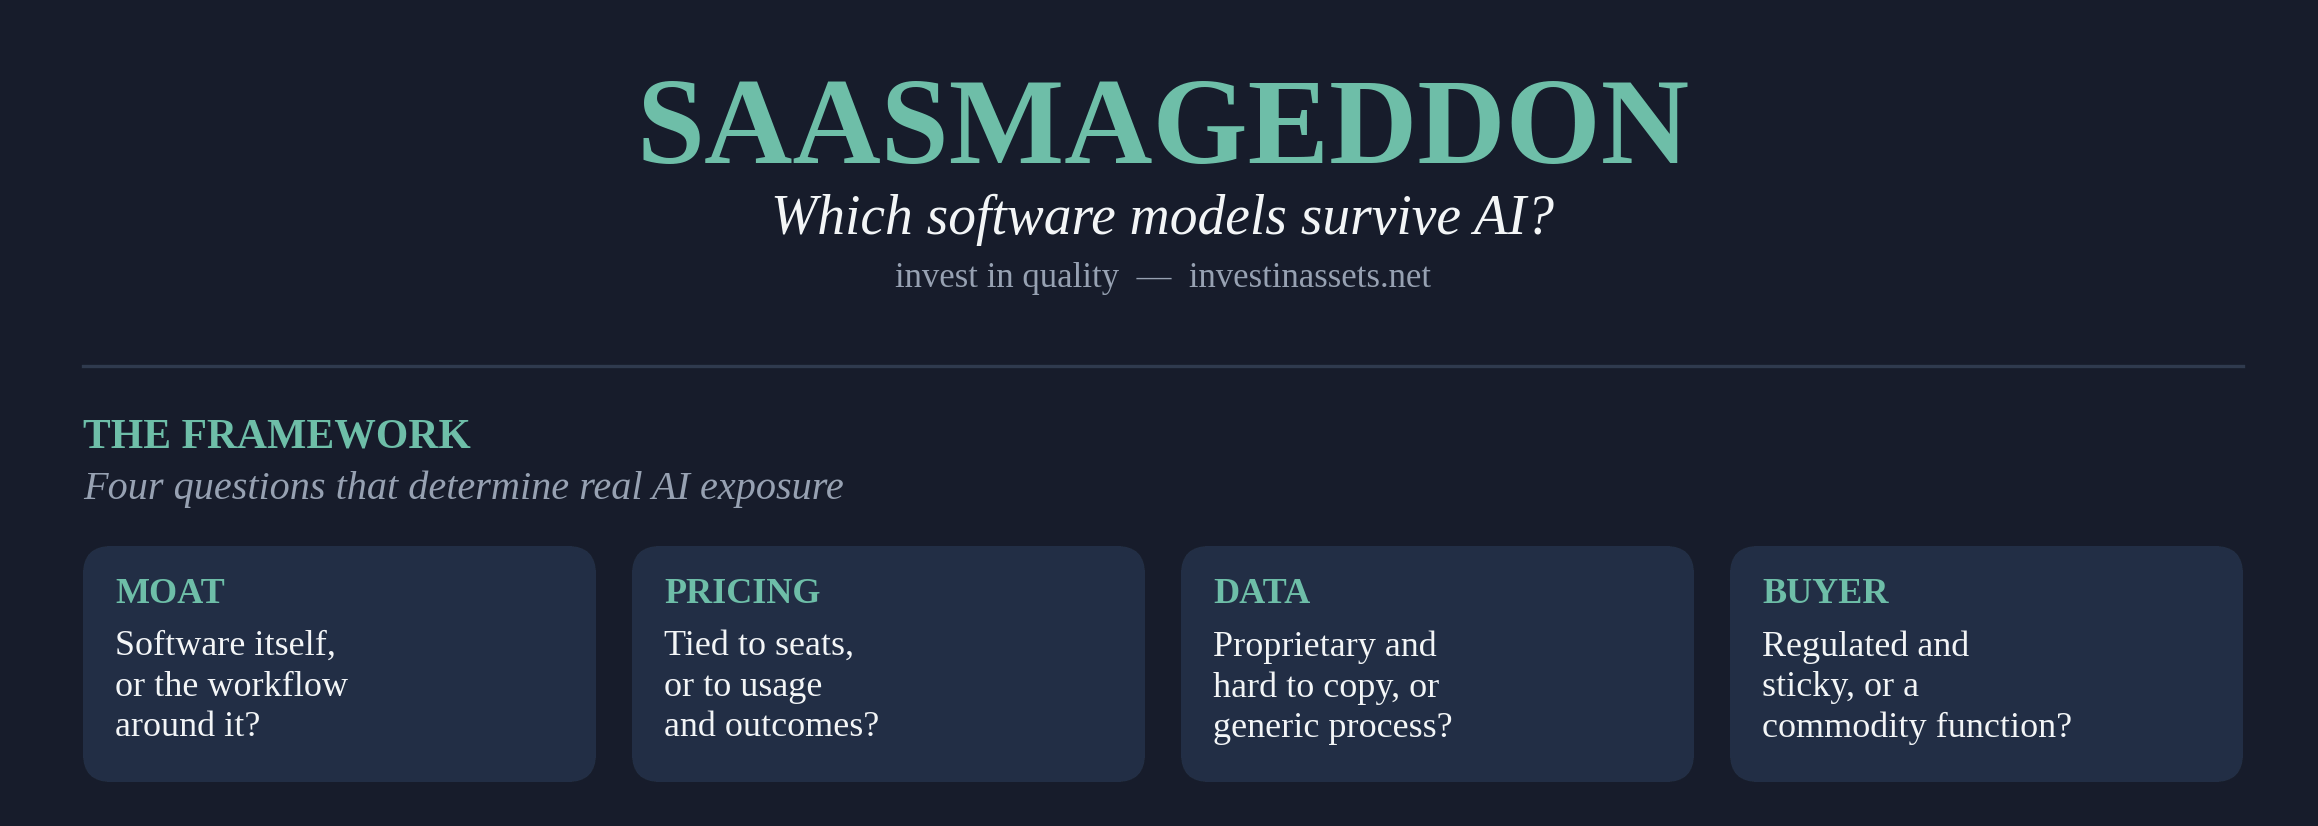
The four questions that actually matter

Here’s a repeatable way to sort any software company by real AI exposure.

Is the moat the software, or the workflow around it? A thin layer sitting on top of a general-purpose model can be rebuilt by that model’s next version. A deep integration into a regulated process, a proprietary dataset, or a switching-cost-heavy workflow can’t.

Is pricing tied to headcount or to outcomes? Seat-based pricing is a direct bet that companies keep hiring the same number of people to do the same job. AI is explicitly designed to break that bet. Consumption-based or outcome-based pricing usually grows as AI usage grows, instead of shrinking.

Is there proprietary data AI can’t replicate? A company sitting on decades of validated, regulated, or otherwise hard-to-recreate data has something a generic model can’t just absorb. A company whose “data” is really just organized public information does not.

Is the buyer risk-averse and regulated, or a commodity back-office function? Compliance-heavy buyers move slowly and hate switching vendors. Commodity functions get automated first, because there’s no regulatory or safety reason not to.

Run any SaaS stock through those four questions and you get a much clearer picture than “AI is bad for software.”


Bucket 1: Companies at Risk

The ones getting hit hard

Chegg: the cautionary tale that already happened

Chegg is the clearest case study of AI disruption that exists, because it’s no longer a debate, it’s a finished story. The stock fell 48% in a single day back in May 2023, when then-CEO Dan Rosensweig told analysts ChatGPT was hurting new customer growth. That was the first time a public company admitted, on the record, that a generative AI tool was actively damaging its business.

Chegg's Downfall Since ChatGPT [OC] : r/dataisbeautiful

It didn’t stop there. Chegg has lost over 500,000 subscribers since ChatGPT launched. Its Q1 2026 revenue fell 48% year over year to $63.3 million, with the core Academic Services segment down 57%. The company has laid off well over half its workforce across four rounds since mid-2024, and the stock has traded as low as roughly $1, down about 99% from its 2021 peak of over $113.

Run it through the framework: the moat was a searchable database of solved homework problems, exactly the kind of content a language model reproduces instantly and for free. Pricing was a flat monthly subscription with zero switching costs. There was no regulatory moat, no proprietary workflow, nothing standing between Chegg and a free alternative that got dramatically better overnight. This is what it looks like when every box in the framework is checked in the wrong direction.


Globant, and the IT-services squeeze

Globant is a harder case, because the company is executing reasonably well and the stock has still been destroyed. Shares are down roughly 60% over the past year on growing concern that AI will “disintermediate” custom software development.

Full-year 2026 revenue guidance implies growth of just 0.3% to 2.2%, essentially flat, for a company that used to compound at a much faster clip.

Management’s response has been to lean into “AI Pods,” teams that pair engineers with AI tooling, and to keep buying back stock.

Q1 2026 results actually beat guidance. But the market isn’t rewarding execution here, it’s repricing the entire IT-services model, because the mechanism is real: when an AI coding assistant does the work of several junior developers, the billable-hour model that funded this industry for two decades gets structurally smaller.

EPAM, Globant’s closest peer, tells a similar story: 2026 growth guidance was cut to 4-6.5%, and by at least one analysis its return on invested capital has fallen below its cost of capital in recent years, a sign of a business that’s having to fight harder for the same returns.

Neither company is going to zero. But the framework points to real structural pressure here, not a sentiment overreaction: seat-and-hour-based pricing, a commodifiable service (routine coding and QA work), and a buyer (enterprise IT budgets) that is actively looking for ways to spend less on exactly this.


Workday: caught in the middle, and still needing to prove it

Workday sits closer to the boundary. The stock is down 53.6% from its all time highs, triggered by conservative fiscal 2027 subscription guidance of 12-13% growth that fell short of consensus.

The mechanism is straightforward: Workday prices Human Capital Management (HCM) and payroll software per employee seat, and if AI reduces corporate headcount, the number of seats a company needs shrinks with it.

To be fair to Workday, its retention numbers are excellent: it serves roughly 65% of the Fortune 500 with a 97% gross retention rate, and displacement risk is low. But the seat-based pricing exposure is real, and unlike Salesforce below, Workday hasn’t yet shown hard evidence that its new consumption-based “Flex Credits” pricing is offsetting the risk. This is a name where the jury is still out, and the honest answer is that it belongs on a watchlist, not yet in a “buy the dip” pile.

5 More SaaS companies at risk:

  • HubSpot

  • DocuSign

  • Fiverr

  • Cognizant

  • Concentrix

Bucket 2: Insulated Companies

Built to survive

Veeva Systems

Veeva sells cloud software to life sciences companies for FDA-regulated processes: clinical trials, drug safety, regulatory submissions.

That’s about as far from a “thin AI wrapper” as software gets.

Fiscal 2026 revenue came in at $3.2 billion, up 16%, with subscription revenue up 17%, and the company still put up double-digit growth while building agentic tools (Veeva Falcon, launching for early access in November 2026) directly into those regulated workflows rather than trying to replace them.

Worth noting: Veeva wasn’t immune to the sector-wide fear either. Shares were down about 16% year-to-date heading into its Q4 report before jumping more than 10% on the earnings beat.

That’s the pattern this whole article is about: good business, dragged down by a generic narrative, snapping back once the numbers forced a correction.

Run it through the framework and the reason is obvious: regulated buyer, proprietary validated data, deep workflow lock-in. None of that goes away because a model gets smarter.

Veeva is down 35.7% from its 2025 all time highs:


Constellation Software

Constellation is close to the opposite of a thin AI wrapper by design.

It’s a collection of hundreds of decentralized, deeply niche vertical market software businesses, the kind of software that runs a specific municipal utility’s billing system or a specific type of clinic’s scheduling software.

These products are often the single system of record for a small, specific customer base that has no appetite to switch, and often no real alternative to switch to.

That’s precisely the profile the framework says should survive: the moat isn’t the software’s cleverness, it’s decades of embedded, mission-critical use inside a workflow with high switching costs and a narrow, non-generic problem to solve.

A general-purpose AI model doesn’t casually rebuild hundreds of tiny, deeply specific vertical systems, and Constellation’s capital allocation discipline means it can keep buying more of them regardless of the AI narrative swirling around big-cap SaaS.

Despite the robustness of Constellation’s portfolio, the stock is down -46.4% from its all time highs:

5 More companies that are insulated:

  • Roper Technologies

  • Tyler Technologies

  • Guidewire Software

  • SS&C Technologies

  • Fair Isaac (FICO)


Bucket 3: the gainers (the bucket that actually matters)

This is the group I think is most mispriced. These are companies where AI is a demonstrated tailwind, not a threat, but where sector-wide fear has still pulled the stock down.

Salesforce: same panic, opposite data

Salesforce and Workday got hit by the identical narrative, the “Seat-Count Crisis,” at the same time.

Salesforce shares fell as much as 54.1% from 2025 highs:

But look at what actually happened inside the business instead of the narrative around it.

Agentforce, Salesforce’s AI agent platform, grew annual recurring revenue from $800 million to $1.2 billion in a single quarter, up 205% year over year.

And here’s the detail that directly contradicts the bear case: seven of Salesforce’s ten largest deals in that quarter added seats.

Management is explicitly repricing around usage instead of defending the old seat model, shifting toward metered, consumption-based billing for agentic work through a platform called m3ter.

The stock was trading at 12x forward earnings with 13% revenue growth and expanding margins as of this writing. This is a valuation that assumes the bear case is already true.

Same fear, same sector, and different underlying data than Workday. That’s the kind of distinction the four-question framework is built to catch, and exactly why treating “seat-based SaaS” as one undifferentiated bucket is a mistake.


Alphabet: the “AI kills Google” thesis, disproven by Google’s own numbers

Most investors have most likely already forgotten that stock was trading sub $150 in April of 2025 (Now trading at $354).

The bear case and narrative on Alphabet was: “ChatGPT kills Search”.

This narrative had slowly built since November 2022, but in 2025 the narrative hit the stock price hard.

This is maybe the purest example of sector-wide fear versus company-specific reality.

The Q1 2026 numbers say the opposite happened: Google Search revenue hit $60.4 billion, up 19% year over year, with management citing search queries at an all-time high.

Google Cloud grew 63% to $20 billion, with a contracted backlog that’s nearly doubled to over $460 billion.

Alphabet still has real risks worth mentioning: capital expenditure is enormous (2026 guidance of $180-190 billion), free cash flow has compressed sharply during the build-out, and the AI model race with OpenAI and Anthropic is genuinely competitive, not a foregone conclusion.

But the specific mechanism the market feared, generative AI directly cannibalizing search traffic and ad revenue, has not shown up in the data.

Google folded AI Overviews directly into the product instead of losing users to a separate one, and it’s monetizing at a similar rate to classic search.


Synopsys: benefiting from the boom, priced like a casualty

Here’s a genuinely odd one in my opinion.

Synopsys, half of the EDA software duopoly (alongside Cadence) that every advanced chip design runs through before reaching a fab, reported Q2 fiscal 2026 revenue of $2.28 billion, up 42% year over year, directly riding the AI chip design boom.

And the stock was still down roughly 20.8% year-to-date and 41% from its all time highs.

At the same time Cadence, its closest peer with a similar growth story, was up around 19-21%.

Some of that gap is company-specific, Synopsys is digesting a roughly $35 billion Ansys acquisition, which creates real integration risk worth taking seriously rather than dismissing.

But a chunk of the underperformance looks like collateral damage from the broader “AI kills software” narrative bleeding into a company whose entire business exists because of the AI chip buildout.

Switching costs in EDA are about as extreme as software gets: engineers spend years learning a specific tool flow, and Synopsys and Cadence together dominate the market almost by default.


The data infrastructure “Fab Five”

Bank of America has grouped Snowflake, Datadog, MongoDB, JFrog, and Twilio as a basket that’s up roughly 30% on average in 2026, while the broader software sector ETF (IGV) was down about 12% over the same stretch.

The logic is simple: every AI model in production needs somewhere to store data, something to monitor performance and cost, and infrastructure to run on, and none of that shrinks when AI gets more capable, it grows.

Datadog is the clearest example: Q1 2026 revenue crossed $1 billion for the first time, up 32% year over year, with AI-linked revenue now over 10% of the total and growing faster than 100% annually.

The stock jumped over 30% in a single session on that report and pulled Snowflake and MongoDB up alongside it.

Snowflake’s product revenue grew 30% in its most recent quarter, directly tied to the volume of data enterprises are processing for AI workloads.

Worth being honest about the other side: this group isn’t cheap. Snowflake in particular has traded at 120-140 times forward earnings at various points this year, which leaves very little room for a slowdown in enterprise data spending.

But the mechanism: more AI usage requiring more data infrastructure, is the opposite of the seat-cannibalization risk facing Chegg or Globant.

5 More companies that are AI gainers:

  • Palo Alto Networks

  • Arista Networks

  • CrowdStrike

  • ServiceNow

  • Oracle


How to run this yourself

Before buying (or avoiding) any SaaS name on an AI narrative, ask:

  1. Does the moat live in the software itself, or in the data, workflow, and switching costs around it?

  2. Is revenue tied to headcount, or to usage and outcomes?

  3. Would a generic AI model actually replace what this company sells, or does it need this company’s specific data and workflow to be useful at all?

  4. Is the stock down because the business is actually impaired, or because it shares a sector label with companies that are?

That last question is the one the market keeps ignoring.


The takeaway

AI disruption in software is real, Chegg proved that beyond argument, and the IT-services squeeze on Globant and EPAM is a live, structural story happening now.

But the market is currently pricing entire categories, seat-based software, anything labeled “SaaS,” as if they share Chegg’s problem. But many don’t.

The actual opportunity isn’t avoiding AI risk, it’s owning the companies where AI is making the business stronger while the stock still trades like it’s a victim.

Salesforce with Agentforce actually adding seats, Alphabet with search revenue accelerating, Synopsys riding a chip design boom while priced like a laggard, a data infrastructure basket growing because AI needs somewhere to run.

The panic is still real, but identifying the quality SaaS businesses that have sold off is where the opportunity lies in the current market.

I hope you enjoyed the article.

Ready to take the next step? Here’s how I can help you grow your investing journey:

  1. Go Premium — Unlock exclusive content and follow our market-beating Quality Growth portfolio. Learn more here.

  2. Essentials of Quality Growth — Join over 300 investors who have built winning portfolios with this step-by-step guide to identifying top-quality compounders. Get the guide.

  3. Free Valuation Cheat Sheet — Discover a simple, reliable way to value businesses and set your margin of safety. Download now.

  4. Free Guide: How to Identify a Compounder — Learn the key traits of companies worth holding for the long term. Access it here.

  5. Free Guide: How to Analyze Financial Statements — Master reading balance sheets, income statements, and cash flows. Start learning.

  6. Get Featured — Promote yourself to over 24,000 active stock market investors with a 42% open rate. Reach out: investinassets20@gmail.com

Invest in Quality is a reader-supported publication. To receive new posts and support my work, consider becoming a free or paid subscriber.

☐ ☆ ✇ Invest in Quality

Portfolio Update: Buying an AI Compounder🏰

By: Invest In Assets 📈

Hello, partner.

Some of the capital freed up from trimming Alphabet and exiting ASML and LVMH is going here first. I’m adding to Taiwan Semiconductor, and unlike ASML, this is a bet on business momentum, not on a multiple that needs to keep expanding.

The numbers underneath the stock price

TSMC trades at 18.8x forward earnings against a long-term expected…

Read more

☐ ☆ ✇ Invest in Quality

Portfolio Update: Buying a Technology Compounder 💎

By: Invest In Assets 📈

Hi, Partner👋

I recently freed up ~15% of my portfolio’s capital to allocate to better opportunities.

I’m opening a ~5% position in Uber, on the view that the market’s biggest fear about this business, autonomous vehicles cutting it out entirely, is overblown and will eventually benefit Uber.

Read our recent analysis of Uber:

Why the AV disruption thesis…

Read more

☐ ☆ ✇ Invest in Quality

Portfolio Update: Selling 3 Positions 🏰

By: Invest In Assets 📈

Hi, partner 👋

As I’ve communicated recently, I’m making some changes to the portfolio. It’s time to free up capital and reallocate it to emerging compounders that will accelerate my compounding rate.

This is my current allocation:

Let’s get into the details.

Trimming Alphabet by roughly a third

Let’s start with the one that isn’t a conviction call. I’m n…

Read more

☐ ☆ ✇ Invest in Quality

How I Save 10 Hours of Investing Work Each Week Using AI

By: Invest In Assets 📈

Hi there, investor! 👋

I used to spend most of my investing time on work that didn’t require me.

Reading through earnings releases line by line. Scrolling through 300-page annual reports hunting for the three paragraphs that actually mattered. Manually comparing numbers across quarters to spot a trend I could have seen in 30 seconds with the right tool. Summarizing earnings call transcripts just to arrive at a conclusion I could have reached faster.

That was the job. And most of it was grunt work.

I still do all of those things. I just don’t spend 10 hours a week doing them anymore.

This article is about exactly what changed, the specific workflows, the exact prompts, and the places where AI will mislead you if you’re not paying attention.

Read my previous article on how to set up Claude as your personal AI investment analyst here:

Let’s get into it 👇

Invest in Quality is a reader-supported publication. To receive new posts and support my work, consider becoming a free or paid subscriber.


First: What those 10 hours actually look like

If you run a concentrated portfolio of quality compounders seriously, meaning you actually read filings, track your thesis per holding, and think carefully before you act, your weekly research time probably breaks down something like this:

  • Earnings processing (releases, transcripts, filings): 3–4 hours

  • Annual report deep dives on new or existing positions: 2–3 hours

  • Monitoring existing holdings across quarters: 1–2 hours

  • Research on new ideas: 2–4 hours

  • Cutting through macro and sector noise: 1 hour

That’s 8–14 hours per week for someone doing this properly. Most of it is preparation: gathering, formatting, summarizing, comparing. Almost none of it is the actual thinking that drives investment returns.

The goal isn’t to do less. The goal is to spend those hours on judgment instead of formatting.

Investment Research - Definition, History, Importance

The mindset shift that makes this work

Before we get into the workflows, this needs to be said clearly.

Claude is not an analyst. It has no skin in the game, no track record, and no judgment built from watching businesses succeed and fail over decades. It has read everything and experienced nothing. It will give you a confident-sounding answer whether it knows what it’s talking about or not.

What it is (when used correctly) is the fastest research preparation tool that has ever existed for individual investors.

Think of it this way. The 10 hours you’re about to reclaim are hours that never required your judgment in the first place. What remains is the conviction calls, the thesis judgments, the decision to hold through a painful quarter or sell when something has broken in the business, those still take exactly as long as they should. AI should not touch those decisions.

The job of AI in your investment process is to handle the preparation so you can spend more time on the thinking. Keep that distinction sharp at all times, and this becomes enormously useful. Blur it, and you’ll make worse decisions than you did before.

Caveat: There is a value to reading all the documents yourself, you might find something that AI misses. So let me be clear, the best possible scenario is that you do everything yourself. But let’s be real, very few have the time, the discipline, and the fortitude to do that consistently over time. I prefer to spend my energy and cognition where it matters most: Judgement around specific investment decisions.


Workflow 1: Processing earnings in 20 minutes instead of 2 hours

Saves approximately 2–3 hours per week during earnings season

Earnings season is the most time-intensive period in any fundamental investor’s calendar. You own 12-20 positions. Each one reports. Each report has a press release, a set of financials, and a +60-minute earnings call transcript. Doing this properly, the old way, takes hours.

Here’s the new way.

What you do: Paste the documents of the earnings press release and the full earnings call transcript into Claude. Before you do, paste your investment thesis for that holding, the reasons you own it and the specific metrics you’re watching. Then run this prompt:


PROMPT 1: Earnings Processing

You are analyzing an earnings report for a company I own in my long-term quality growth portfolio. I am going to give you three things: my original investment thesis, the earnings press release, and the earnings call transcript. Your job is not to tell me whether the stock is a buy or sell. Your job is to help me understand whether my thesis is intact.

Here is my thesis for [COMPANY]: [Paste your thesis — 3–5 sentences on why you own it and what has to be true]

Here is the earnings press release: [Paste]

Here is the earnings call transcript: [Paste]

Please give me the following, structured clearly:

1. THESIS CHECK: For each assumption in my thesis, tell me whether this quarter confirmed it, contradicted it, or gave no clear signal either way.

2. NUMBERS THAT MATTER: Pull out the 5–6 metrics most relevant to my thesis. Show me the current quarter, the prior quarter, and the same quarter last year. Flag any meaningful changes.

3. LANGUAGE SHIFTS: Compare the tone and specific language used by management this quarter vs. what I would expect from a business performing well. Flag any topics that received noticeably more or less emphasis than usual, any hedging language, or any guidance that was vaguer than in prior periods.

4. WHAT I SHOULD THINK ABOUT: Based purely on the information in these documents, not your own opinion about the company, what are the two or three questions a long-term investor should be sitting with after this report?

Do not give me a buy or sell recommendation. Do not tell me what the stock might do. Focus entirely on the business.


What this looks like in practice

When Constellation Software reported Q1 2026, I pasted my thesis, which centers on their ability to deploy capital at high returns through vertical market software acquisitions, sustain mid-single-digit organic growth, and grow free cash flow per share over time by +15% annually alongside the release and transcript.

Claude flagged immediately that organic recurring revenue growth had decelerated to approximately 4%, that management used notably more cautious language around M&A multiples than in prior calls, but that free cash flow available to shareholders had jumped 44% and the acquisition pipeline commentary remained constructive. It surfaced exactly the tension I needed to think about, in about four minutes.

What you still do yourself

Decide what the verdict means for your position. Claude told me organic growth was decelerating. It cannot tell me whether 4% organic growth at Constellation Software is a problem or a feature of their model at scale. That judgment is mine, built from years of following the business.

Looking at the data since 2017, a 4% organic growth is actually in the higher range of what Constellation has delivered:

Where this goes wrong

Claude will sometimes misread numbers from a pasted document, particularly when tables are involved. Always verify the specific figures it pulls against the actual press release. Never trust a number Claude gives you without checking the source.

Subscribe now


Workflow 2: Annual report deep dives in under an hour

Saves approximately 2 hours per company

The annual report is the most important document a public company produces. It is also, for most companies, 80% repetitive. Risk factor sections that haven’t changed in four years. Legal disclosures. Compensation tables. Pages of accounting policy notes that apply to almost no investment decision you will ever make.

The skill in reading an annual report is knowing what to look for. Claude doesn’t develop that skill for you, but once you have it, Claude can find the relevant sections faster than any human.

What you do: Upload the annual report PDF directly into Claude, or paste the sections most relevant to your analysis. Then run this prompt:


PROMPT 2: Annual Report Deep Dive

I am a long-term quality growth investor analyzing the annual report for [COMPANY]. I am going to upload the full report. I want you to help me extract the information most relevant to a fundamental long-term investor.

Please work through the report and give me the following:

1. BUSINESS MODEL CLARITY: In 150 words or fewer, explain how this business makes money, who its customers are, and what makes them come back. Use only the language from the report, do not add your own assumptions.

2. ROIC AND CAPITAL ALLOCATION: Find every reference to return on invested capital, return on equity, capital expenditure, acquisitions, and buybacks. Summarize how management is allocating capital and whether there is any commentary on the returns they expect from that allocation.

3. COMPETITIVE POSITION: Pull the specific language management uses to describe their competitive advantages. Do not paraphrase, quote the exact phrases they use. Then flag any language that sounds defensive, hedged, or notably weaker than you would expect from a business with a strong moat.

4. RISK FACTORS THAT ARE ACTUALLY NEW: Compare the risk factors section against what a standard company in this industry would typically disclose. Flag any risks that appear specific to this company’s current situation, not generic industry risks that every company lists.

5. WHAT CHANGED FROM LAST YEAR: If I provide last year’s annual report as well, identify the three to five most meaningful changes in language, emphasis, or disclosure between the two years.

Flag any sections where the document quality made it difficult to extract reliable information.


What this looks like in practice

When I was going deeper on MercadoLibre ahead of their Q1 2026 results, I used this prompt against their most recent 20-F. Claude pulled out the specific language management used around their fintech flywheel, the way Mercado Pago and the credit business reinforce the commerce platform, and flagged that the risk factor language around credit portfolio quality had become meaningfully more specific than in the prior year’s filing. That was a signal worth investigating further. It would have taken me two hours to find it manually. It took Claude four minutes.

What you still do yourself

Evaluate whether what Claude found is good or bad. It can tell you that credit risk language became more specific. It cannot tell you whether that reflects prudent disclosure or a genuine deterioration in the underlying portfolio. That requires your own judgment, your own reading of the fintech lending environment, and your own view of management’s track record.

Where this goes wrong

Two places. First, Claude sometimes misreads PDFs, particularly tables, footnotes, and anything in a non-standard format. Always check the numbers it extracts against the source document.

Second, and more importantly: Claude has a bias toward sounding thorough. It will give you a confident summary even when the source material is ambiguous or the answer isn’t clear. If you ask it whether the competitive position is strong, it will give you a structured answer. That answer may or may not reflect reality. The confidence of the output is not evidence of its accuracy. Read the sections that matter yourself. Use Claude to find them faster.


Workflow 3: Monitoring your existing holdings without drowning

Saves approximately 1–2 hours per week

This is the part of investing that almost no one covers, and the part where most individual investors are genuinely weakest. Not finding stocks. Holding them.

You own a portfolio of stocks. Each one has a thesis. Each one reports every 90 days. The question every single quarter is the same: did anything change? And it’s hard to answer consistently, because your memory of why you bought something three years ago is imperfect, and the quarterly noise makes it easy to drift from your original reasoning without noticing.

The solution is a thesis document for each holding that you update quarterly. Claude makes this both easier to build and faster to use.

Step one: Build the thesis document. For each holding, run this prompt:


PROMPT 3A: Extract My Core Thesis Assumptions

I own [COMPANY] as a long-term holding in my quality growth portfolio. Here is why I bought it: [Paste your original investment notes, even if rough]

Based on what I’ve written, identify the three to five core assumptions that have to be true for this investment to work out over a five to ten year horizon. Be specific, not “the business needs to keep growing” but the actual mechanisms and metrics that would tell me whether the thesis is intact or broken.

For each assumption, tell me: what would confirming evidence look like in a quarterly earnings report? What would contradicting evidence look like?

Present this as a structured checklist I can use every quarter.


Save that checklist. Then every quarter, after earnings, run this:


PROMPT 3B: Quarterly Thesis Check

Here is my thesis checklist for [COMPANY]: [Paste the checklist from Prompt 3A]

Here are the Q[X] 2026 earnings results: [Paste the press release and any relevant transcript sections]

For each assumption on my checklist, tell me:

CONFIRMED: evidence from this quarter that supports the assumption

CONTRADICTED: evidence from this quarter that challenges the assumption

NO SIGNAL: the quarter gave no clear information either way

At the end, give me a one-line verdict:

THESIS INTACT / THESIS WEAKENED — WATCH / THESIS BROKEN — REQUIRES DECISION.

Do not tell me what to do with the position. Tell me what the evidence says.


What this looks like in practice

My thesis on Kinsale Capital rests on three things: their ability to underwrite non-standard E&S risks at a combined ratio well below the industry, their cost advantage relative to larger competitors, and premium growth that reflects both market share gains and pricing power. When Q1 2026 showed commercial property premiums falling 28% on heightened competition, Claude flagged it immediately as a contradiction of the market share assumption, while also noting the combined ratio had improved to 77.4% and reserve development remained favorable, both confirmations of the underwriting discipline assumption. The verdict: THESIS WEAKENED — WATCH. That’s exactly right. Not broken. But worth monitoring closely.

Where this goes wrong

The thesis checklist is only as good as the thesis you give Claude to start with. If your original investment notes are vague, like “Kinsale is a great compounder with a good management team”, the checklist will be vague too. Garbage in, garbage out. The discipline of writing a specific, falsifiable thesis for each holding is the work. Claude just helps you track it.


Workflow 4: First-pass screening on a new idea in 30 minutes

Saves approximately 1–2 hours per new idea

Every serious investor has the same problem with new ideas: there are more interesting businesses than there is time to investigate them properly. The first-pass filter, is this worth two weeks of serious research? Is itself time-consuming.

Claude helps with the workload.


PROMPT 4: Cold-Start Business Assessment

I am a long-term quality growth investor. I look for businesses with durable competitive advantages, high and consistent returns on invested capital (above 15%), the ability to reinvest a large proportion of earnings at high rates of return, and management teams with a track record of excellent capital allocation.

I have just come across [COMPANY] and know very little about it. I am going to paste the two most recent quarterly reports, and the most recent annual report, and other relevant information I have. I want you to help me decide whether this deserves serious further research.

Please give me:

1. BUSINESS MODEL: How does this company make money? Who are its customers and why do they pay?

2. INITIAL QUALITY FILTER: Based on the financials provided, what do the ROIC, gross margins, operating margins, and FCF conversion look like? Are these consistent over time or volatile?

3. POTENTIAL MOAT: Based on the business description, what are the possible sources of competitive advantage? Be honest, if the moat is unclear or weak, say so.

4. REINVESTMENT RUNWAY: Is there an obvious long runway for reinvesting earnings at high rates of return? What would drive that reinvestment?

5. INITIAL RED FLAGS: What are the two or three things about this business that a quality growth investor should be most concerned about?

6. VERDICT: On a simple scale — PASS (not worth further research), INTERESTING (worth a deeper look), COMPELLING (this has the hallmarks of a quality compounder) where does this sit? Explain your reasoning in two sentences.

Be direct. I would rather you tell me a business doesn’t qualify than dress it up.


Where this goes wrong, and this is important

This is the workflow where AI is most dangerous. Claude will give a confident assessment of a business’s competitive advantages based entirely on the information you give it and its training data. It has no ability to assess whether a moat is real in practice, whether customers actually stay, whether pricing power holds under pressure, whether the culture that drove the returns is still intact. A confident “COMPELLING” verdict from Claude on a new idea means almost nothing without your own independent judgment. Use this as a filter, not a conclusion. The serious work still starts after this prompt.


Workflow 5: Cutting through macro and sector noise

Saves approximately 1 hour per week

The financial internet produces infinite content. Most of it is on the interest rate takes, the tariff commentary, the recession probability estimates. This will often never matter for the long-term value of the businesses you own. The trap is reading all of it anyway.

When something from the macro might matter for a specific holding, use Claude to assess the actual business-level impact quickly, rather than reading twelve articles that all say the same thing.


PROMPT 5: Business-Level Macro Impact Assessment

I own [COMPANY] as a long-term holding. Here is a brief description of their business model and the key drivers of their economics: [2–3 sentences on the business]

[MACRO EVENT] is being widely discussed as a potential risk or opportunity for businesses like this. Please help me think through the actual business-level impact.

1. DIRECT EXPOSURE: Does this company have direct revenue, cost, or operational exposure to [MACRO EVENT]? Be specific, what percentage of revenue, what cost lines, what geographies?

2. SECOND-ORDER EFFECTS: What are the less obvious ways this could affect the business, customer behavior, competitor positioning, input costs, regulatory response?

3. WHAT WOULD HAVE TO BE TRUE: For [MACRO EVENT] to materially impair this company’s earnings power over a five-year horizon, what would have to happen? How likely does that chain of events seem?

4. WHAT MANAGEMENT HAS SAID: If I paste recent earnings call commentary, identify exactly what management said about this topic and whether their response sounds prepared and thoughtful or vague and evasive.

Give me a one-paragraph conclusion on whether this macro event deserves to change my view of the long-term thesis.


What this looks like in practice

When tariff concerns were dominating financial media in early 2026, I ran this prompt for LVMH. Claude quickly surfaced that Fashion & Leather Goods had direct exposure to transatlantic goods flows, that China recovery remained the bigger driver of the thesis, and that management’s Q1 commentary had been notably vague on the North America impact. That was a useful 10-minute framing that let me stop reading tariff articles and focus on the actual questions that mattered for the position.


What the reclaimed time is actually for

Saving 10 hours a week sounds like the goal, but its not.

The goal is to spend those 10 hours on the work that actually drives investment returns over decades. The reading that builds pattern recognition, the thinking that develops conviction, the uncomfortable questions about what you might be wrong about in your highest-conviction positions.

The investors who compound wealth seriously over a long period aren’t faster at grunt work. They spend more time thinking clearly about fewer, better questions. AI just gets you there faster.


What you should never use AI for

This section matters as much as everything above it.

Never use AI to decide whether to buy or sell. Claude will give you a structured answer to any question you ask, including “should I add to this position?” That answer is worthless. It has no skin in the game, no understanding of your portfolio construction, no memory of what you paid, and no ability to weigh qualitative factors that only come from years of following a business. The buy and sell decisions are yours. Permanently.

Never trust a number Claude gives you without checking the source. Claude fabricates figures with complete confidence. It will cite a ROIC of 23% for a company whose actual ROIC is 14%. It will pull a revenue figure from the wrong quarter. It will confuse operating income with net income. Every single number that matters (every number you might act on) needs to be verified against the primary source.

Never use AI as a substitute for reading the filings yourself. Claude’s summaries flatten nuance. An earnings call transcript has texture, the pause before an answer, the question that gets deflected, the topic that the CEO rushes past. You only catch that if you’ve read enough transcripts to know what normal sounds like. Claude has never read a transcript with skin in the game. You have. Use Claude to find the sections worth reading carefully. Then read them carefully.

Never use AI on questions where the answer requires judgment about the future. “Will Novo Nordisk maintain its competitive position in GLP-1s?” is not a question Claude can answer. It will give you a confident framework and a balanced conclusion. That conclusion is constructed from patterns in its training data, not from any genuine understanding of pharmaceutical competitive dynamics, patent cliffs, or the likelihood that oral Wegovy changes the category. On questions of qualitative judgment about the future, Claude is confidently mediocre. Your own reading, thinking, and pattern recognition (Even if its not perfect) is more valuable.

Never let AI make you feel like you’ve done the work when you haven’t. This is the most subtle and dangerous failure mode. Running five prompts and getting five structured outputs feels like research, but its not. It’s “organized preparation”. The research is what happens when you sit with the questions those outputs raise and think hard about what you actually believe.


Invest in Quality is a reader-supported publication. To receive new posts and support my work, consider becoming a free or paid subscriber.

Final Thoughts

Investing well is a craft. It rewards patience, judgment, and the ability to think clearly about businesses over long periods of time. None of that can be automated. None of it should be.

But the hours you spend reformatting tables, skimming risk factors, and manually comparing numbers across eight quarters? Those hours were never doing the work. They were just the cost of accessing the work.

AI eliminates that cost. What you do with the time it gives back is still entirely up to you.

The prompts above are a starting point, not a system. Your system will develop as you use them, refine them, and figure out where they work for your process and where they don’t. Start with the earnings processing prompt this quarter. Build from there.

Ten hours is a lot of thinking time to give back to yourself every week. Use it well.


The prompts from this article, ready to copy:

  • Prompt 1: Earnings Processing

  • Prompt 2: Annual Report Deep Dive

  • Prompt 3A: Extract My Core Thesis Assumptions

  • Prompt 3B: Quarterly Thesis Check

  • Prompt 4: Cold-Start Business Assessment

  • Prompt 5: Business-Level Macro Impact Assessment

(Save these to a text file and customise them to your own portfolio and investing philosophy before your first use.)


Ready to take the next step? Here’s how I can help you grow your investing journey:

  1. Go Premium — Unlock exclusive content and follow our market-beating Quality Growth portfolio. Learn more here.

  2. Essentials of Quality Growth — Join over 300 investors who have built winning portfolios with this step-by-step guide to identifying top-quality compounders. Get the guide.

  3. Free Valuation Cheat Sheet — Discover a simple, reliable way to value businesses and set your margin of safety. Download now.

  4. Free Guide: How to Identify a Compounder — Learn the key traits of companies worth holding for the long term. Access it here.

  5. Free Guide: How to Analyze Financial Statements — Master reading balance sheets, income statements, and cash flows. Start learning.

  6. Get Featured — Promote yourself to over 24,000 active stock market investors with a 42% open rate. Reach out: investinassets20@gmail.com

☐ ☆ ✇ Invest in Quality

Factsheet June 2026 🏰

By: Invest In Assets 📈

Hello, partner 👋

June was a solid month for the Quality Growth Portfolio. Positive development in 3 of the portfolio’s ‘laggards’ and FX tailwinds sent the portfolio up 5.21%, marking a solid return since the March sell off.

Kinsale Capital, Novo Nordisk, and Mastercard have been a drag on the portfolio for most of the past year. Not because the underly…

Read more

☐ ☆ ✇ Invest in Quality

Top 5 Buys June 2026 💎🏰

By: Invest In Assets 📈

Hi partner! 👋🏻

Welcome to the June edition of Top 5 Buys ✅

You can access our Top 25 Buys for 2026 list as a premium member here.

Top 25 Buys

In this article, we will discuss our top stock picks for June 2026.

Let’s get into it 👇


The Market Sentiment: Fear

A month ago, the market was flirting with Greed, then the Strait of Hormuz situation escalated, the oil price spiked, and the Fear & Greed Index dropped to Fear territory at 35:

This is the overarching trend of 2026 so far. The fear and greed cycle on steroids. Tariff scares in April, recovery in May, geopolitical shock in June, and whats next?

Every few weeks the market finds a new reason to panic, sells off, then mostly forgets about it a few weeks later.

I don’t trade the index. But I do pay attention to what it tells me: when fear shows up, prices move before fundamentals do. That gap is where buying opportunities exist.

This month’s five picks all share something in common. Each one reported strong fundamental momentum recently, and each one has seen its share price disconnect from that momentum, for reasons that have little to do with the actual business.

Here are this month’s Top 5 Buys 👇

This is not investment advice. Always conduct your own due diligence and make your own investment decisions.


Top 5 Quality Buys June 2026 🚀

Meta Platforms 📱

The preferred digital advertisements platform is building its own AI infrastrucutre.

Social Media & AI Infrastructure

Meta just delivered one of its strongest quarters in years, and the stock is still down roughly 17% over the past 52 weeks. Q1 2026 revenue grew 33% year-over-year to $56.3 billion, beating estimates. Net income reached $26.7 billion. And the market’s response has been to focus almost entirely on the capex number.

Meta guided 2026 capital expenditure up to a range of $125 billion to $145 billion to fund AI infrastructure and data centers. That’s a lot of money.

But despite the result from the AI investment, the fundamental business of Meta is throwing off enormous free cash flow from an advertising engine that is getting more efficient (And more effective with the use of AI).

The market is pricing Meta like an AI cost center. The Q1 numbers say it’s still primarily an advertising compounder that happens to be investing heavily in its next potential leg of growth.

The Model: Distribution First, Monetization Second

Meta’s core business has always followed the same playbook: build the platform people spend the most time on, then monetize that attention better than anyone else.

Facebook, Instagram, WhatsApp, and Threads collectively reach close to half the world’s population. That distribution is the moat, and it creates a lot of optionality and new potential revenue streams for Meta.

AI is simply the newest lever for squeezing more value out of it; better ad targeting, better ranking algorithms, and now entirely new product surfaces like AI-powered Business Agents inside WhatsApp, Instagram, and Messenger.

Growth Drivers

Ad efficiency from AI: Better targeting and creative generation tools are lifting advertiser ROI, which supports continued pricing power even as impression growth moderates.

According to Meta, “For every $1 advertisers spent using Advantage+ shopping campaigns, they saw 17% more purchases compared to advertisers who used manual shopping campaigns.” (Source: Meta for Business)

Business Agents: A global AI-powered agent now operates across WhatsApp, Instagram, and Messenger, aimed at small and medium businesses that previously couldn’t afford a dedicated marketing or customer service function. This is a new revenue stream for Meta.

Instagram Plus and AI subscriptions: Meta is testing premium, ad-light tiers, an early step toward diversifying revenue beyond pure advertising. Meta expects a 1-2% conversion rate on Instagram and Facebook plus. The two platforms have 2.35 billion and 3.07 billion monthly active users.

Let’s do the math at $3.99 per month:

1% conversion = 5.42 x 0.01 x 3.99 = $216 million monthly recurring revenue

2% conversion = 5.42 x 0.02 x 3.99 = $432 million monthly recurring revenue

This growth comes at very low additional operational costs, as Meta already has the infrastructure in place, they just monetize the distribution they’ve already built.

The Numbers

Meta trades at a forward P/E of 16.76x, a meaningful discount to where it traded for most of the past two years, despite revenue growth accelerating.

Return on invested capital sits at 24.3%, exceptional for a company spending this aggressively on infrastructure.

The PEG ratio is 0.8, which tells you the market isn’t pricing in much credit for growth at all right now. That’s unusual for a business compounding earnings the way Meta currently is.

Bottom line: Why now?

Meta is a high-quality compounder trading at a discount because the market can’t decide whether to treat the AI buildout as an opportunity or a threat to margins. The Q1 numbers already answered that question: revenue accelerated, margins held up, and entirely new monetization surfaces are opening up. Patient investors who can tolerate capex headlines are being offered a re-rating opportunity here.

I’m not sure about the AI investment for Meta, I believe it’s the wrong strategic bet for the business. But, as we’ve seen in the past, even poor capital allocation decisions (Like the Metaverse, buybacks at aggressive all time highs and so on) the digital advertisement engine of Meta can’t be held down. It is a pristine business, and all marketers I know always go back to spending more on Meta ads as opposed to other digital ad services.


S&P Global SPGI 🏛️

S&P Global finally trading at a reasonable price.

Financial Data, Ratings & Indices

S&P Global just posted a 10.4% revenue increase and a 28% jump in net income, and the stock is trading at one of its lowest valuations in over a decade. If you’ve ever wondered what a wide-moat business mispriced by macro noise looks like, this is a prime example.

The Model: Three Toll Booths

S&P Global sells judgment, data, and benchmarks that the entire financial system relies on to function.

The Ratings division prices the creditworthiness of nearly every major bond issued globally; you cannot easily route around a credit rating that institutional investors require.

Market Intelligence sells data, analytics, and workflow tools on subscription, recurring revenue that barely notices fluctuations in the market.

Indices earns asset-linked fees on trillions of dollars sitting in S&P-benchmarked ETFs and mutual funds, growing automatically as markets rise over time.

This is a duopoly business (alongside Moody’s) operating in a market with almost no real substitutes.

Growth Drivers

Bond issuance reacceleration: Billed issuance jumped 28% in the most recent quarter, driving double-digit Ratings revenue growth. Corporate borrowers refinancing into a more stable rate environment is a direct tailwind for SPGI.

Indices growing fastest of all five segments: Indices revenue grew 17% last quarter, the fastest of any division, powered by rising ETF and mutual fund AUM. This segment scales almost for free.

Capital return acceleration: Management now expects to return 100% or more of adjusted free cash flow to shareholders in 2026 through dividends and buybacks, up from prior guidance.

Mobility spin-off: S&P Global is on track to separate its Mobility division in 2026, a move that should sharpen the remaining business’s growth and margin profile and may unlock value the market isn’t currently crediting.

The Numbers

S&P Global trades at a forward P/E of 20.11x, well below its 3-year and 5-year average multiples, which have run closer to 30-35x.

The free cash flow yield is also at its highest level only seen a few brief times over the past decade:

Full-year guidance calls for 6-8% organic revenue growth, with adjusted EPS guided to $19.40-$19.65.

Bottom line

In my opinion, S&P Global isn’t cheap because the business got worse, but because the stock had a difficult year on sector rotation and general financial-sector pressure. Looking at the numbers, the underlying engine kept compounding. A toll-booth business with this kind of pricing power rarely trades at a meaningful discount to its own history. Right now, it does.

SPGI is set to return all free cash flows to investors. This is a double edged sword - on one hand it is great to get a dividend and buyback yield, but I ideally want to invest in businesses that can reinvest the proceeds at a high return.

Despite this, SPGI is a great defensive quality compounder to bring stability to ones portfolio.


The rest of this article, including our next three picks is for Premium subscribers only.

Read more

☐ ☆ ✇ Invest in Quality

Emerging Compounder 💎

By: Invest In Assets 📈

Sea Limited business breakdown

Sea’s stock is 53.6% below its recent high. The bear case is that TikTok Shop is dismantling Shopee, gaming peaked, and margins are collapsing. The bull case is that three businesses running simultaneously at 40%+ revenue growth, for the first time in company history, suggests something very different is happening.

Revenue grew 46.6% in Q1 2026. Net income grew 6.7%. The market is looking at that gap and concluding the business model is broken. I think it’s doing something else entirely, confusing deliberate reinvestment with structural deterioration.

Invest in Quality is a reader-supported publication. To receive new posts and support my work, consider becoming a free or paid subscriber.


Sea Limited is made up of 3 primary businesses:

Business 1: Shopee

Southeast Asia’s Amazon (+Brazil)

Shopee is the dominant e-commerce marketplace across Southeast Asia and the #2 platform in Brazil. In Q1 2026 it generated $37.3 billion in GMV (up 30.2%), $5.1 billion in revenue (up 45.1%), and processed 4 billion orders. The most important number: revenue is growing faster than GMV. Shopee is taking a larger cut of every transaction, not just doing more transactions.

Shopee Q1 2026 key metrics vs prior year:

How is the take rate rising?

Advertising. Shopee’s ad revenue grew 80% year-over-year in Q1 2026, sellers paying to appear first in search results. This is structurally identical to how Google monetises search: high-margin, defensible, and nearly pure profit at the margin.

The VIP program is the detail most analysts skip. Launched in Indonesia in early 2025, it now has 3.5 million subscribers across Indonesia, Thailand, and Vietnam. Those members are 2.5% of all buyers but generate roughly 20% of all GMV. In Indonesia, VIP members spend 40% more after subscribing than they did before. That is not a loyalty program. That is a flywheel lock-in.

The TikTok Threat

Southeast Asia e-commerce market share Q1 2026:

TikTok Shop is a real competitor. It holds 18% of Southeast Asian e-commerce GMV, is growing at 40–55% annually, and its Tokopedia partnership gives it serious infrastructure in Indonesia, the region’s largest market. By 2027–2028, it could reach 25%+. This is a real threat for SE.

What TikTok Shop wins: impulse purchases, fashion, beauty, discovery-driven, low-ticket categories. What Shopee dominates: electronics, home goods, FMCG. These are categories where customers care about delivery guarantees, returns, and warranties. These are meaningfully different shopping occasions.

The scenario that should concern investors is not TikTok Shop at 18%, but TikTok Shop at 28% with a fintech stack that competes with SPayLater. That is the product Shopee’s moat actually depends on preventing.

Lazada, Alibaba’s bet on Southeast Asia, has essentially conceded. After spending over $7.4 billion, it has repositioned as a premium brand platform. One less serious competitor for mass-market GMV.


Business 2: Garena

The cash engine nobody models correctly

Garena operates Free Fire, one of the most downloaded mobile games in history, plus licensed titles including EA Sports FC and Call of Duty: Mobile. It exists inside a company known for e-commerce and fintech, which means most analysts look at it wrong.

A 61.6% EBITDA margin. On $931 million in quarterly bookings. Garena generated over $500 million in operating profit in a single quarter, and that cash is flowing directly into Shopee’s logistics build-out and Monee’s loan book. This is the engine that makes Sea’s reinvestment cycle possible without raising external capital or diluting shareholders.

The user base has been roughly flat for two years (620–670 million quarterly). What’s changing is how those users spend. The paying user ratio has climbed from 8% to 10.9%. Average spend per paying user has risen from $0.83 to $1.40. This is a fundamentally healthier growth trajectory than buying cheap installs.

However, the concentration risk is real. If Free Fire faded sharply, it would hurt badly. The evidence so far points toward an evergreen franchise, IP collaborations with Jujutsu Kaisen, Naruto, and Squid Game have kept the game current, and Arena of Valor just hit record quarterly bookings in its tenth year of operation. But this risk is on the table.


Business 3: Monee

The fintech stack that makes Shopee defensible

Formerly SeaMoney, Monee is Sea’s financial services arm. It lends to Shopee shoppers via SPayLater and to small businesses on the platform, and operates digital banks: SeaBank in Indonesia, Philippines, and Brazil, plus MariBank in Singapore.

Growing a loan book at 71% annually while improving credit quality is not something you see often. The NPL of 1.1% declining year-on-year tells you the underwriting model works at scale.

The competitive advantage for Monee is data. Every Shopee purchase, every payment, every return generates a transaction trail. Monee uses that to assess creditworthiness with far more precision than a bank that only sees salary and credit score. A regional bank cannot replicate this without first building a marketplace with hundreds of millions of buyers. A fintech startup cannot replicate it either, they don’t have the data.

SeaBank Indonesia ended 2025 with 28 million customers. It is the only Indonesian digital bank generating returns on assets comparable to conventional retail banks. Most digital banks are still burning cash acquiring customers.

Brazil is the next major growth vector. Monee obtained a new financial licence in Brazil in Q1 2026. The Brazilian loan book crossed $1 billion, up 250% year-over-year. SPayLater penetration in Brazil is roughly 10% of GMV versus significantly higher in mature Southeast Asian markets.

Monee is not just a fintech business. It is the moat that makes Shopee harder to leave. The moment a customer starts using SPayLater, switching to TikTok Shop means giving up their credit line. That is a strong lock-in.


The Flywheel

Each business makes the others stronger. Shopee generates buyers and transaction data. Monee uses that data to lend profitably, and its credit products, SPayLater, digital banking, make Shopee harder to leave. Garena generates cash that funds Shopee’s logistics build and Monee’s loan book growth. No external capital required, resulting in no dilution.


What Is Sea Worth?

Sum-of-the-parts

Sea’s balance sheet holds $11.1 billion in cash and investments against less than $800 million in debt, roughly $10.3 billion in net cash, nearly 20% of the entire market cap. In November 2025, the company announced its first-ever $1 billion share buyback, a signal that management believes the stock is undervalued.

Sum-of-parts valuation bridge vs current market cap.

At $86/share, the market implies Shopee and Monee are almost free. That is the opportunity, or the warning sign, depending on your view of TikTok Shop.

I love to look at the sum of all parts, but we almost never see a business being fully valued from this perspective, there is always a ‘conglomorate discount’. Look at Mercadolibre and Amazon as an example.

Despite this, Sea Limited is in a strong position in a very interesting market. If SE can continue to prove its profitability while keeping their Shopee market share, the result for investors can be lucrative.

Here is what needs to be true for our bear, base, and bull case to play out:


The Risks You Need to Own

Shopee margin compression

Management guided Shopee’s profit margin at ~0.6% of GMV for all of 2026, versus a long-term target of 2–3%. This is deliberate investment, but patience is required. The re-rating catalyst is the first quarter where this metric inflects upward year-over-year.

Garena concentration

Free Fire is extraordinary. It is also a single game. A better replacement could erode it faster than IP collaborations can offset. The franchise looks evergreen, but that assessment has to be revisited every quarter.

Untested credit cycle

Monee’s 1.1% NPL looks pristine today. The loan book has only existed at scale during a period of relative economic stability. A sharp consumer downturn in Southeast Asia or Brazil is the real test, and that test has not yet arrived.

Governance concentration

Forrest Li holds ~59% of voting rights. Minority shareholders have limited ability to influence governance. You are backing the founder, and the founder alone. That is a feature for some investors and a dealbreaker for others.

Currency risk is also real and underappreciated. Sea earns in Indonesian Rupiah, Brazilian Reals, Thai Baht, and Vietnamese Dong, and reports in USD. FX moves add volatility that has nothing to do with operational performance and can distort quarter-to-quarter comparisons significantly.


Concluding Thoughts

Sea is a company where three distinct businesses compound each other, all running at 40%+ revenue growth simultaneously, on a balance sheet with $10+ billion in net cash, at a valuation that implies the flywheel stops spinning.

The market’s central fear, that TikTok Shop structurally impairs Shopee’s profitability, is a legitimate risk, not a dismissible one. TikTok Shop at 25%+ with a fintech layer would be a materially different competitive environment. What the market is getting wrong in my opinion is treating that as the current reality rather than a tail risk to monitor.

The single metric to watch: Shopee EBITDA as a percentage of GMV. The moment that starts inflecting upward year-over-year, the re-rating begins. Until then, you are being paid in growth while you wait, in a business where the underlying flywheel is turning faster than the stock price reflects.


Ready to take the next step? Here’s how I can help you grow your investing journey:

  1. Go Premium — Unlock exclusive content and follow our market-beating Quality Growth portfolio. Learn more here.

  2. Essentials of Quality Growth — Join over 300 investors who have built winning portfolios with this step-by-step guide to identifying top-quality compounders. Get the guide.

  3. Free Valuation Cheat Sheet — Discover a simple, reliable way to value businesses and set your margin of safety. Download now.

  4. Free Guide: How to Identify a Compounder — Learn the key traits of companies worth holding for the long term. Access it here.

  5. Free Guide: How to Analyze Financial Statements — Master reading balance sheets, income statements, and cash flows. Start learning.

  6. Get Featured — Promote yourself to over 24,000 active stock market investors with a 42% open rate. Reach out: investinassets20@gmail.com

Disclaimer:

This newsletter is for informational purposes only and does not constitute financial, investment, or other professional advice. The views expressed are solely the author’s opinions and may change without notice.

Investing in securities involves risk, including the potential loss of capital. Past performance is not indicative of future results.

The author may hold positions in securities mentioned. Readers should do their own research and consult a licensed financial advisor before making investment decisions.

Invest in Quality is a reader-supported publication. To receive new posts and support my work, consider becoming a free or paid subscriber.

☐ ☆ ✇ Invest in Quality

Quality Growth Portfolio Update: Top 5 position review

By: Invest In Assets 📈

Hi partner 👋

The Quality Growth Portfolio had a strong first quarter.

Capital being deployed at unprecedented scale, free cash flow compounding, acquisition machines running.

But one position is sitting differently from the rest. And that tension is worth addressing.

Let me start there👇

Read more

☐ ☆ ✇ Invest in Quality

The True Value of a Stock Market Portfolio 🏰

By: Invest In Assets 📈

Hi there, investor 👋

Today we’re looking at what the true value of a portfolio is.

Invest in Quality is a reader-supported publication. To receive new posts and support my work, consider becoming a free or paid subscriber.

Many view the price as the true value of the portfolio, but is that fair?

Mr. Market is a manic depressive that changes his mind constantly.

We’ve seen it hundreds of times, a high quality business sells off due to a prevailing narrative.

Meta Platforms traded at a single digit multiple in 2022 after a series of bad news:

The stock sold off big time. So what did Meta do to change the trend? Nothing special, it continued to deliver solid growth, high margins, and produce high levels of free cash flows.

The price went up +700% in less than 3 years… Same business, but a radical different price.

This begs the question: Is price really a good measure of the true value of a portfolio?

If we look at the business, it most often hasn’t changed at all, even if the stock price has changed significantly.

After all, we’re trying to buy great businesses and be long-term business owners, not stock traders.

So, today, I want to show you how I look at the true value of the portfolio, and more importantly, how I evaluate if a purchase was successful or not.

A better way to look at the true value of a stock portfolio

The true value of the portfolio: earnings and free cash flows per share

I look at both, because free cash flows can be temporarily depressed due to large capex investments. And earnings can be more easily manipulated by accounting shenanigans.

Why focus on earnings and free cash flow per share?

The short answer: Earnings & free cash flows is the weighing machine, stock price is the voting machine. And in the long-term, the weighing machine wins.

In the long-run, the stock price will follow the growth in earnings. In the short-term, you have no control over how the market will price that growth.

Of course, we have to look at a broader picture, to consider how our portfolio is rated compared to other indexes like the S&P 500, MSCI world index and the ‘risk free rate’ of the 10 year treasury bond.

Factors worth tracking for your portfolio:

  • The PE and FCF yield

  • Compare PE and FCF to the S&P 500 and the MSCI world index

  • Compare FCF yield to the risk free rate (10 year treasury bond yield)

  • The expected future growth

  • Compare it to the expected growth of the S&P 500, MSCI world index, and expected GDP growth globally or for the US.

Here is a overview how I compare my portfolio to the S&P 500:

Successful investments

So, we can’t control how the market rates our businesses, but we can control our entry price, or what multiple we purchase the business at.

Buying a great business at a high multiple is a high risk endeavors, we have the classic example of Microsoft, that used 16 years to regain its dot com bubble highs:

But buying a business at a low multiple can be just as unprofitable as buying Microsoft in 2000.

There are plenty of examples of former darlings that the market used to love, but just keep rating lower and lower.

A well known examples is Evolution AB. The market used to look at the business like an unstoppable force in a growing global market, rating the business at ~90x earnings at its peak.

90x, became 30x, 30x became 10x.

So, buying a business at low (or lower) multiples is not enough, we have to be right about the business, and the discount the market applies to the stock has to be overestimated.

So, entry price is important, and buying a quality business that will continue to grow its earnings and free cash flows per share over time is important.

In periods of multiple contraction, or when the stock price is selling heavily off, like we see in the software industry right now, how should we think about tracking the real performance of our portfolio?

Look-through earnings: The real scorecard

This brings us to a powerful tool for evaluating your portfolio: look-through earnings.

Warren Buffett introduced this idea in his 1989 annual report, specifically to help Berkshire Hathaway shareholders understand the true performance of their equity portfolio. The logic is simple: Rather than looking at what the market says your stocks are worth today, you add up your proportional share of the earnings of every business you own.

Warren Buffett still thinks the market's too expensive. Look at his $381  billion cash pile.

François Rochon, founder of Giverny Capital, has applied this framework for decades. As he explains:

“A stock portfolio is the same thing as a holding company, with fractional ownership (even if very small) instead of total ownership.”

This means that if you own 50 shares of a company, you are not holding a ticker symbol. You are a part-owner of a real, cash generating business.

These businesses have real customers, employees, and make real money.

The stock price only tells you what the market is willing to pay for one slice of this business on this day.

Look through earnings tells you what your slice of the business actually produces.

Rochon illustrates this with a simple example.

Imagine a $100,000 portfolio made up of:

  • 2,000 shares of ABC (trading at $25 a share). Total value: $50.000

  • 500 shares of XYZ (trading at $100). Total value: $50.000

ABC earned $2 per share, XYZ earned $8.

Multiply each by the shares you own, and your total owner’s earnings were $8,000.

The following year, ABC earned $2.40 and XYZ earned $9. Your owner’s earnings grew to $9,300.

This is a 16% growth rate, regardless of what either stock did in the market that year.

That 16% is the real scorecard. Not what Mr. Market said your portfolio was worth on any given Tuesday.

Why price alone is a terrible measure of performance

Buffett put it plainly:

“In the short run, the market is a voting machine. In the long run, it is a weighing machine.”

The voting machine can be wildly irrational.

Rochon points to Coca-Cola as a perfect case study. In 2000, Coke traded at a PE of 41. 10 years later, the stock had barely moved:

Over that same period, earnings nearly tripled, a nine percent annual growth rate. The business did its job. The stock didn’t move, because investors in 2000 had massively overpaid.

As Charlie Munger said:

“All intelligent investing is value investing, acquiring more than you are paying for. You must value the business in order to value the stock.”

Two factors that determine intrinsic value

Rochon is direct about what actually drives intrinsic value, and he identifies two factors that the market frequently gets wrong.

The first is the future prospects of the business.

Earnings can grow 20% in a year, but if the underlying business model does not look sound over the next five years, that growth will prove temporary and should not be considered a true increase in intrinsic value.

This is why great investors spend most of their time on qualitative analysis: the moat, the management, the competitive dynamics, not just the spreadsheet or discounted cash flow analysis.

Determining future prospects is inherently subjective and imprecise, but it is the work.

The second factor is the price you pay.

If you pay too high a price relative to intrinsic value, even if intrinsic value grows at a good rate, you will not be rewarded by the market.

The Coca-Cola example above is the proof. Overpay at 41x earnings, wait twelve years as earnings triple, and still earn almost nothing. The valuation contraction absorbed all the compounding.

This is why entry multiple is something you can and must control. You cannot control how Mr. Market rates your businesses next year. You can control what you pay today.

How to use this in practice

Each year, calculate your portfolio’s total owner’s earnings. Add up your share of earnings across every position you hold.

Owner earnings can be calculated as follows:

  • Earnings or FCF per share + dividend per share x # of shares

This can (And should) be done every quarter to keep track of your holdings.

Then compare that number to the prior year. That growth rate is your real return on the underlying businesses, independent of market noise.

Rochon does exactly this at Giverny Capital. As he writes:

“Each year, in the letter I write to our partners, I include a section called ‘owner’s earnings’ with a long-term table of annual results of the companies we own compared to the performance of the underlying stocks. By adding dividends to the growth rate of earnings, I can come up with a combined intrinsic value performance of the companies we own.”

For your own portfolio, you want to see:

  • Owner’s earnings growing faster than your benchmark index (E.g. S&P 500 or MSCI World Index) underlying earnings growth

  • A PE and FCF yield that is reasonable relative to the index and the risk-free rate

  • Expected future growth that justifies the multiple you paid at entry

If those three things are true, you are in good shape, even if the market hasn’t recognized it yet.

Rationality in the face of volatility

The deepest benefit of looking through earnings is psychological. When you know your businesses are compounding earnings at 12-15% per year, a 30% market drawdown stops being terrifying and starts being an opportunity. You are no longer at the mercy of Mr. Market’s mood swings, because you have an independent measure of whether your investments are working.

Rochon makes this point directly:

“This helps us in two ways. First, we can be much more rational with market fluctuations by focusing on the intrinsic performance of the companies we own instead on their quoted prices. Also, it helps us focus on our long-term objective.”

Buffett has said the same thing for fifty years. The stock market exists to serve you, not to instruct you. If it offers you a great business at a silly price, buy more. If it prices your existing holdings at a premium to intrinsic value, enjoy the quotation and do nothing.

Concluding Thoughts

The true value of your portfolio is not the number on your brokerage screen this morning. It is the sum of what your businesses are earning on your behalf, growing year after year, compounding quietly regardless of what any market does on any given day.

Get the entry multiple right. Own businesses with durable earnings power and strong future prospects. Track your look-through earnings annually, not your portfolio price daily.

Do that consistently, and the market will eventually do the weighing, and the price will follow the earnings.

Ready to take the next step? Here’s how I can help you grow your investing journey:

  1. Go Premium — Unlock exclusive content and follow our market-beating Quality Growth portfolio. Learn more here.

  2. Essentials of Quality Growth — Join over 300 investors who have built winning portfolios with this step-by-step guide to identifying top-quality compounders. Get the guide.

  3. Free Valuation Cheat Sheet — Discover a simple, reliable way to value businesses and set your margin of safety. Download now.

  4. Free Guide: How to Identify a Compounder — Learn the key traits of companies worth holding for the long term. Access it here.

  5. Free Guide: How to Analyze Financial Statements — Master reading balance sheets, income statements, and cash flows. Start learning.

  6. Get Featured — Promote yourself to over 24,000 active stock market investors with a 42% open rate. Reach out: investinassets20@gmail.com

Invest in Quality is a reader-supported publication. To receive new posts and support my work, consider becoming a free or paid subscriber.

☐ ☆ ✇ Invest in Quality

Factsheet May 2026 💎

By: Invest In Assets 📈

Hi there, partner 👋

May was a quiet month for the portfolio, up +2.05%.

After April’s strong recovery, May felt like the market taking a breather. The businesses we own kept doing what they do: compounding earnings, taking market share, and building their moats. The stock prices mostly moved sideways to slightly up, and that’s fine.

No positions were adde…

Read more

☐ ☆ ✇ Invest in Quality

Top 5 Buys May 2026 🚀

By: Invest In Assets 📈

Hi partner! 👋🏻

Welcome to the May edition of Top 5 Buys ✅

You can access our Top 25 Buys for 2026 list as a premium member here.

Top 25 Buys 2026

In this article, we will discuss our top stock picks for May 2026.

Let’s get into it 👇


The Market Sentiment: Greed

After the chaos of April, tariff announcements, geopolitical noise, and a brief detour into Extreme Fear, the market has bounced back with surprising speed. Investor sentiment has settled around Greed, as the S&P 500 reclaims ground near all-time highs.

The investors who acted in April have already been rewarded. Now the question is whether this recovery holds, or whether the underlying uncertainty reasserts itself.

Honestly? It doesn’t matter that much. What matters is finding businesses that compound regardless of what the macro throws at them.

I can’t predict the future, but I can point to 5 quality growth businesses that continue to compound regardless of macro economics.

Here are this month’s Top 5 Buys 👇

This is not investment advice. Always conduct your own due diligence and make your own investment decisions.


Top 5 Quality Buys May 2026 🚀


#1 of 5🏛️ Kinsale Capital

Technology-Driven Insurance Compounder · $KNSL · Richmond, Virginia

E&S Insurance

Kinsale Capital ($KNSL) is the best business model in insurance. A pure-play Excess & Surplus (E&S) lines specialist that has turned underwriting into a competitive advantage. Since IPO in 2016, Kinsale has compounded shareholder returns 33.6% annually by doing something deceptively simple: insuring risks that standard carriers won’t touch, faster and cheaper than anyone else.

The E&S market exists because some risks are too unusual, complex, or volatile for standard insurance markets. Think cannabis businesses, cyber liability, construction projects in difficult environments, and emerging industries. It’s a great business to be in, if you can underwrite like Kinsale Capital does.

Kinsale Capital Deep Dive Part 1 - Compounding Quality

The Model: Tech Advantage in a Legacy Industry

The insurance industry runs on legacy IT. Old systems, slow quoting, manual underwriting. Kinsale built its entire platform from scratch, proprietary technology enabling faster quoting, better data capture, and more granular risk selection than any competitor. The result is a structural cost advantage. Kinsale’s expense ratio sits around 20–21%, this is one of the lowest in the E&S market. Combined with disciplined underwriting producing a combined ratio in the mid-to-high 70s, Kinsale is generating ROE consistently above 25–30%. Legacy competitors can’t close this gap. Their infrastructure is too expensive to replace.

Growth Drivers

  • E&S market expansion: The E&S market has been taking share from standard lines for years as risk complexity grows. Kinsale is perfectly positioned as a pure-play operator.

  • Technology flywheel: As Kinsale writes more policies, its data advantage improves. Better data → better pricing → better loss ratios → more capital to grow.

  • Small-to-mid market focus: Kinsale targets smaller, more fragmented accounts where broker relationships are stickier and competition from large carriers is weaker.

  • Investment income: A growing float invested at improving rates adds a compounding tailwind to earnings.

The Numbers

Kinsale is trading at its lowest forward PE in over a decade, of 14.77x.

Despite the historical low levels, it still trades at a premium to other insurance businesses, as it should, with much higher combined ratio, return on equity and growth.

The unit economics for Kinsale Capital is one of the most durable in financial services.

Bottom line

Kinsale is a rare investment case, a financial company with a genuine technological moat. Insurance is typically a commodity. Kinsale has made it a compounding machine by building technology that incumbents can’t replicate without tearing down everything they have. The E&S market is growing, the advantage is durable, and management has been disciplined throughout. This is the kind of business you want to own for a decade.


#2 of 5 🌸 Interparfums

Asset-Light Fragrance Compounder · $IPAR · New York, USA

Luxury Fragrance

Interparfums ($IPAR) is one of the best-kept secrets in consumer goods. It’s not a luxury house. It doesn’t own the brands. It licenses them, and that distinction is crucial.

The model is elegant: Interparfums signs long-term exclusive licensing agreements with prestigious fashion brands (Coach, Jimmy Choo, Montblanc, Kate Spade, Karl Lagerfeld, and more), then handles the creation, manufacturing, and global distribution of fragrances under those brands. The brand owner gets royalties without operational headaches. Interparfums captures the economics of luxury fragrance with a fraction of the capital intensity.

Interparfums gets playful with MCM fragrance collection

The Model: Licensing as Leverage

The fragrance business is incredibly attractive. Gross margins are thick, products have long shelf lives, gifting occasions are recurring, and prestige brands command premium pricing. The Coach license was just renewed through June 2031. A new license with Longchamp (through 2036) was signed in July 2025. The portfolio is diversifying and lengthening.

Growth Drivers

  • Jimmy Choo franchise strength: The “I Want Choo” franchise is a genuine hit. Jimmy Choo is growing around 16% annually.

  • New license pipeline: Longchamp launches in 2027. New brands entering the portfolio add future growth optionality.

  • Global prestige fragrance tailwind: Consumer demand for prestige and luxury fragrance remains robust even as consumers become more selective elsewhere.

  • Geographic expansion: North America, Western Europe, and Asia/Pacific all strengthened in 2024–2025.

The Numbers

2026 is a consolidation year by management’s own guidance, they’re laying the groundwork for a strong 2027 as new brands ramp. For long-term investors, that creates a window.

Combine this with the drop in valuation over the past years. Interparfums is now trading at a 7.92% forward free cash flow yield, and a 18.7x fwd. PE ratio, it’s cheapest valuation in over a decade:

Bottom line

Interparfums is a textbook asset-light compounder. It has captured the economics of luxury fragrance without the capital intensity of building a luxury brand. The licensing model is misunderstood by investors who worry about renewal risk, but the track record of renewals and an expanding portfolio makes this business far more durable than it appears. Patient investors who look through the 2026 consolidation year will likely be rewarded in 2027 and beyond.

Read more

☐ ☆ ✇ Invest in Quality

FICO: Moat Deterioration or the Buying Opportunity of the Decade? 📈

By: Invest In Assets 📈

Hi there investor 👋

Today we’re breaking down one of the most controversial quality compounders in the market right now.

FICO (Fair Isaac Corporation) is a company most people interact with every time they apply for a mortgage, a car loan, or a credit card. The three-digit number that determines whether you get approved, at what rate, is almost certainly a FICO score.

The company has averaged more than 30% annual returns since 2008, trouncing the Nasdaq 100. It runs one of the most capital-light, high-margin business models in American finance.

And right now, the stock is down 42% from its 2024 peak.

The bear case: regulators broke the monopoly and a $1 competitor is coming for its most lucrative product.

Here’s the full breakdown. Let’s figure out who’s right. 👇


How FICO Makes Money

FICO is best understood as a toll booth on the American credit system.

Every time a bank, mortgage company, or auto dealer pulls a credit score to make a lending decision, there is a very high probability they are paying FICO a royalty. FICO invented credit scoring in 1989. The score became the industry standard because it works. It has been validated against hundreds of millions of loans over 35 years. And 90% of top US lenders still use it today.

The business has two parts:

Scores (about 55% of revenue)

FICO licenses its algorithm to the three credit bureaus (Equifax, Experian, TransUnion), who pass it on to lenders. FICO charges a royalty per score. The Scores business runs an operating margin of roughly 89%. Almost every dollar of price increase falls straight to the bottom line.

Software (about 45% of revenue).

The FICO Platform is an AI-powered cloud system used by banks, insurers, and telecoms to automate lending decisions, fraud detection, and collections. Platform ARR is growing fast and is the company’s reinvestment engine.

FICO has compounded by 21.9% annually since its inception in 1990, despite its recent -48% sell off:


The Moat: Toll Booth

The core of the FICO moat is what investors call standard-setting lock-in. When a product becomes so embedded in an industry’s processes, regulations, and infrastructure that switching becomes expensive, even when a cheaper alternative exists.

Layer 1: Woven into regulation

The FICO Score is not just widely used. It is built into federal lending guidelines, Fair Housing Act compliance frameworks, and the investor documentation behind the $10+ trillion US mortgage-backed securities market.

When a fund manager in Tokyo buys a US mortgage security, credit quality is expressed in FICO scores. When a bank’s compliance officer certifies lending standards, FICO is the measuring rod. Replacing it requires re-underwriting historical loan performance, retraining models, renegotiating investor documentation, and convincing regulators. None of this happens quickly.

Layer 2: 70 years of proprietary data

FICO has been in credit analytics since the 1950s. Its models have been trained and refined against more loan outcomes than any competitor can replicate. An independent study published in 2025 found FICO Score 10T is the most predictive score for first-time homebuyer mortgages. In finance, that edge matters. A slight improvement in default prediction saves large lenders hundreds of millions per year.

Layer 3: Extraordinary Pricing power

This is the clearest proof that the moat is real. FICO has raised its mortgage royalty repeatedly and aggressively, with lenders complaining the entire time. And yet the price keeps going up.

Why can FICO keep raising prices? Because the math is simple. On a $400,000 mortgage, a $15 credit fee is not the variable that drives the decision. As FICO’s own EVP put it: their royalty represents approximately two-tenths of one percent of total mortgage closing costs.

The lobbyists complain, but lenders pay.

Invest in Quality is a reader-supported publication. To receive new posts and support my work, consider becoming a free or paid subscriber.


The Risk You Cannot Ignore

Here is the real bear case, and it deserves a serious hearing.

On July 8, 2025, the FHFA officially allowed mortgage lenders to use VantageScore 4.0 alongside Classic FICO when originating loans for Fannie Mae and Freddie Mac. FICO stock fell nearly 19% in a single session. In March 2026, another 9% drop followed as the credit bureaus (who own VantageScore) began offering it at $1 per score versus FICO’s $4.95.

VantageScore is a joint venture of Equifax, Experian, and TransUnion. The same bureaus that distribute FICO scores own a direct competitor. Their economic incentive to steer lenders toward VantageScore is obvious.

This is a legitimate, structural risk. Not a temporary headwind.

What makes it more complicated:

The FHFA mandate allows VantageScore, but it does not require it. Re-tooling mortgage underwriting systems, retraining credit analysts, and updating compliance frameworks takes years. CEO Will Lansing has faced this question publicly for 15 years:

“We compete with VantageScore every day. We always win.”

The numbers still back him up. B2B Scores revenue grew 42% in Q3 FY2025 even after the VantageScore announcement.

The concern is trajectory, not today’s share. The bureaus pricing VantageScore at $1 is predatory. If lenders start accepting it for non-GSE lending first, and then GSE lending, the long-term price ceiling for FICO scores comes down. This is a multi-year risk to watch, not an immediate catastrophe, but a real challenge to the pricing power that has driven so much of FICO’s earnings growth.


The Software Business: What the Bears Miss

When people debate FICO, they focus almost entirely on Scores. The Software segment is becoming very interesting.

FICO Platform is an enterprise AI decisioning system. Banks use it to automate loan origination, fraud detection, and collections. Insurers use it for underwriting. Telecoms use it to manage credit exposure. T-Mobile recently deployed a FICO Platform solution it says transformed its onboarding capabilities for connected device financing.

Platform Dollar-Based Net Retention Rate is 136%. That means existing Platform customers spend 36% more each year, on average. Enterprise software companies with NRR above 120% are considered elite. FICO Platform is delivering at a level that suggests real product-market fit, not just price increases.

The migration story matters too. Non-platform software ARR is declining as legacy customers move to Platform. This creates a short-term ARR headwind but a long-term margin expansion story, as SaaS recurring revenue is more predictable and higher lifetime value than old-school licenses.

FICO’s financial profile is unusual. The company carries net debt, largely from aggressive share buybacks. But the Scores business generates so much free cash flow that this is manageable.

In fiscal year 2025:

  • Revenue: $1.99 billion, up 15.9%

  • Free cash flow: $769.9 million, up 23.4%

  • Diluted EPS: $26.54, up 29.78%

  • Shares bought back: $1.58 billion worth

Note the share count. FICO has been buying back stock aggressively for years. The per-share economics compound faster than the headline revenue numbers suggest. Aggressive buybacks works out great when the stock price is fair, but when multiples get extreme (like in 2024-2025) the capital allocation is questionable.

In Q2 FY2026, FICO deployed $606 million in buybacks in a single quarter, the largest in company history, plus $170 million more after quarter-end. At a stock price around $1,100 at the time, that is a significant signal from management.

The Scores segment runs at roughly 89% operating margins. The non-GAAP operating margin for the company overall reached 58% in recent quarters. Trailing four-quarter free cash flow as of Q2 FY2026 was $867 million, up 28%.


Growth: Where Does It Come From Here?


FICO’s revenue growth has three drivers.

Volume

More credit pulls as the economy grows, housing activity recovers, and auto financing continues. This is modestly positive and relatively predictable.

Price

FICO has raised mortgage royalties four times in its history, three of them in the last three years. The VantageScore threat limits how aggressively this continues in mortgages, but there is real runway in auto, card, and personal loan markets, where pricing has been flat for years. B2C direct consumer pricing is also under monetized.

VantageScore 4.0 And AI Fundamentally Threaten Fair Isaac (NYSE:FICO) |  Seeking Alpha

Platform growth

With Platform ARR growing 49% and NRR at 136%, this segment is in the early stages of its potential. FICO’s installed base of enterprise clients is enormous. Attaching more Platform use cases to existing relationships is a multi-year growth driver that doesn’t depend on credit cycle dynamics at all.

Consensus estimates point to roughly 15 to 18% EPS growth over the next two years. Given the buyback program reducing the share count by about 2.5% annually, free cash flow per share growth will run above headline revenue growth.

Subscribe now


Valuation

At roughly $1,236 per share (May 2026), FICO trades at:

  • 25x forward earnings

  • 32% below its 10-year average multiple of 37x

  • 69% below the September 2024 peak

Here are my scenarios for FICO:

The base case: continued double-digit growth from scoring volume and Platform expansion, with a modest re-rating toward (but not back to) historical averages, generates attractive returns from today’s price.

The bear case requires a collapse in Scores pricing power AND the Software segment stalling AND the market assigning a sub-25x multiple to a still-cash-generative business. That’s a lot going wrong simultaneously.

Three Assumptions for a Fantastic Outcome (+15-20% CAGR) 🚀

For FICO to compound at 15 to 20% per year from here, three things need to go right.


Assumption 1: VantageScore adoption stays slow for 5+ years.

The regulatory door is open, but building a new standard takes decades. If mortgage lenders move slowly (which history strongly suggests), FICO’s B2B Scores revenue continues to grow even at flat pricing. Price increases in auto and card scoring (where VantageScore has no regulatory mandate) provide an additional tailwind. This alone could add 8 to 10 percentage points to annual EPS growth.


Assumption 2: FICO Platform becomes a $1B+ ARR business by 2028.

Platform ARR is $349 million today, growing at 49% with 136% net retention. If growth slows to a still-excellent 30% per year, Platform hits $1 billion ARR by late 2027 or early 2028. At Software margins that are expanding as the mix shifts to SaaS, this would add meaningful earnings power and justify a higher quality multiple across the whole business.


Assumption 3: Management keeps returning capital aggressively at depressed prices.

The Q2 FY2026 buyback of $605 million in a single quarter (when the stock was near multi-year lows) is the kind of capital allocation that creates enormous per-share value. If management continues deploying $1+ billion per year in buybacks at depressed prices and the business keeps growing, the per-share earnings math becomes very compelling very fast. EPS in FY2028 in this scenario could reach $55 to $60, versus ~$32 today.

None of these assumptions require anything extraordinary. They require the business to keep doing what it has done for 30 years, while management continues to be disciplined with the cash it generates.

What Must Be True for the Base Case

Even for the base case to work, you need to believe:

FICO’s VantageScore headwind plays out slowly, not suddenly. The operating evidence today: 42% B2B Scores growth in Q3 FY2025, strong Q1 FY2026 results, supports the slow-transition view.

Pricing power survives in non-mortgage markets. Auto, card, and personal loan scoring have seen almost no price increases. These are large markets where FICO’s position is equally dominant.

The FICO Platform compounds. With 136% NRR and 49% ARR growth, this is the kind of business that can grow for years inside an existing customer base.

Management keeps allocating capital well. Will Lansing has run this company since 2007. The buyback program has been consistent and value-accretive for years.

The Bear Case Simply Put

The bureaus own VantageScore. They will subsidize it at $1 per score because every FICO score they displace is economics that stays inside their ecosystem. Over 5 to 10 years, lenders adopt VantageScore for more and more use cases. FICO’s pricing power erodes. Revenue growth slows from mid-teens to mid-single digits. The stock, previously priced as a quality compounder at 40 to 50x earnings, re-rates to 20 to 25x. You get a decade of flat returns.

This scenario is what the stock is partially pricing today. It is not crazy. It requires close monitoring.


Concluding Thoughts

FICO invented credit scoring, became the universal language of creditworthiness in the world’s largest economy, and spent three decades building a pricing moat so strong it can charge $4.95 for something that costs almost nothing to produce.

The VantageScore threat is real. The regulatory environment is hostile. The stock got expensive at the peak.

But at 25x forward PE, 48% below its peak in 2024, with an $867 million free cash flow machine, management buying back stock at the fastest pace in the company’s history, and a Platform business growing at nearly 50% per year, the risk-reward looks more interesting than the narrative suggests.

This is not a set-and-forget holding. The VantageScore situation requires active monitoring. If adoption accelerates and Scores pricing starts to compress meaningfully, the thesis weakens. But the bears are pricing in a level of structural decline that the current operating numbers do not support.

FICO is not a broken business, yet. Currently it is discounted. Whether that discount is temporary or permanent is a question that will take 3 to 5 years to answer fully.

Whether I decide to start a position in FICO remains to be decided, you can follow the Quality Growth portfolio and get premium content by becoming a member today:

Subscribe now

Ready to take the next step? Here’s how I can help you grow your investing journey:

  1. Go Premium — Unlock exclusive content and follow our market-beating Quality Growth portfolio. Learn more here.

  2. Essentials of Quality Growth — Join over 300 investors who have built winning portfolios with this step-by-step guide to identifying top-quality compounders. Get the guide.

  3. Free Valuation Cheat Sheet — Discover a simple, reliable way to value businesses and set your margin of safety. Download now.

  4. Free Guide: How to Identify a Compounder — Learn the key traits of companies worth holding for the long term. Access it here.

  5. Free Guide: How to Analyze Financial Statements — Master reading balance sheets, income statements, and cash flows. Start learning.

  6. Get Featured — Promote yourself to over 24,000 active stock market investors with a 42% open rate. Reach out: investinassets20@gmail.com

Disclaimer:

This newsletter is for informational purposes only and does not constitute financial, investment, or other professional advice. The views expressed are solely the author’s opinions and may change without notice.

Investing in securities involves risk, including the potential loss of capital. Past performance is not indicative of future results.

The author may hold positions in securities mentioned. Readers should do their own research and consult a licensed financial advisor before making investment decisions.

☐ ☆ ✇ Invest in Quality

5 Quality Compounders I'm Watching Right Now 🏰

By: Invest In Assets 📈

Hi partner 👋

I don’t buy stocks I’m not ready to own for a decade. But that doesn’t mean I stop looking.

There’s a list I keep of companies that have passed my initial quality filter, that I’ve spent real time understanding, but that I haven’t pulled the trigger on yet. Either the price isn’t right, or I’m still working through a question I can’t fully answer, or I’m simply being patient.

Today I want to share five names sitting on that list right now. These aren’t speculative ideas. Every one of them has a durable competitive advantage I can articulate clearly, a management team that allocates capital like an owner, and a business model I’d be comfortable holding through a downturn.

What they don’t all have yet is the right entry point.


1. FICO: The toll road nobody talks about

If you’ve ever applied for a mortgage, a car loan, or a credit card in the United States, FICO scored you. You probably didn’t think about it. Neither did the lender. That’s exactly the point.

Fair Isaac Corporation sits in one of the most enviable competitive positions in American finance. Its FICO Score is embedded so deeply into the credit decisioning infrastructure of US lenders that replacing it isn’t a technology problem, it’s a coordination problem. Every major lender uses it. Every regulator references it. Every consumer knows their number. The network is the moat.

What makes FICO genuinely interesting right now isn’t the scoring business alone. It’s the transition happening underneath it. The company has been transforming its software division into a subscription-based SaaS platform. Revenue from this segment is becoming stickier, more recurring, and higher margin. And then there’s the pricing story: FICO charges mortgage lenders a fee each time a score is pulled, and that fee has been going up, meaningfully, year after year. The lenders complain. They always complain. But they keep paying.

Put all three together, the scoring monopoly, the software platform transition, and demonstrated pricing power, and you get a business that has compounded both earnings and free cash flow at a remarkable rate for nearly a decade.

The SaaS platform ARR tells an equally compelling story. Platform ARR has grown from $47.7M in 2021 to $348.8M LTM, a near 7x increase in four years.

Meanwhile, Dollar-Based Net Retention on the platform sits at 136% LTM, meaning existing customers are spending significantly more each year.

FICO has traded at astronomic multiples in the last few years, but now FCF yields are at multi year highs, giving investors a opportunity to both get earnings/fcf growth and multiple expansion if the investment case turns out bullish.


Read more

☐ ☆ ✇ Invest in Quality

How I Built a Personal AI Analyst in 30 Minutes (And How You Can Too)

By: Invest In Assets 📈

Hi there, investor 👋

Here’s something I used to do every time I started researching a new stock.

I’d open the annual report. Read 40 pages of reporting jargon. Open a competitor’s filing. Try to hold both in my head simultaneously. Build a rough DCF in a spreadsheet. Go back and re-read the sections I’d already forgotten.

It worked. But it took forever. And the result was only great if I spent significant time and effort to make it happen.

Now I do most of that groundwork in Claude. Not because AI replaces my thinking (it definitely doesn’t), but because it dramatically accelerates the legwork so I can spend more time on what actually matters: forming a strategic long-term view of the business and if it fits into my portfolio.

This guide shows you exactly how I set it up. You can steal every prompt if you want to. I’ll use Constellation Software (CSU) as the running example throughout, since it’s a stock many of you know well and it’s a great test case for quality compounder analysis.

The setup in Steps 1–2 takes about 10 minutes once. After that, each new stock research session takes 5 minutes to get to a point that used to take 3-5+ hours.

Invest in Quality is a reader-supported publication. To receive new posts and support my work, consider becoming a free or paid subscriber.

Why Most Investors Use AI Wrong

If you’ve opened Claude or ChatGPT and typed “Tell me about Constellation Software,” you’ve experienced the problem.

You get a fluent, confident, surface-level summary. It reads well. It tells you nothing you couldn’t find on the Wikipedia page. It’s almost useless for serious investing.

Claude out of the box is a general-purpose assistant. It doesn’t know you’re a quality-focused investor who cares about ROIC, capital allocation, and durable competitive moats. It doesn’t know what you already know, what your investment horizon is, or what you’re trying to decide.

The difference between a generic AI response and a genuinely useful research session is context and structure. That’s what this guide is about.

The 5-Step Setup

Step 1: Choose the Right Tool and Plan

I use Claude’s pro plan to get access to the most powerful AI model. This guide will revolve around Claude. I’ve used multiple AI Models, but nothing comes close to Claude in my opinion.

Here’s why this matters for investors:

  • Claude handles very long documents better than most alternatives. You can paste or upload an entire 100+ page annual report and have a coherent conversation about it.

  • The Pro plan gives you access to Claude’s most capable models with a significantly larger context window. This is critical when you’re working with 10-Ks, earnings transcripts and competitor filings simultaneously.

  • Claude tends to be more careful about expressing uncertainty than alternatives, which matters when you’re making real financial decisions.

Important caveat

Claude’s knowledge has a training cutoff. It will not know last quarter’s earnings. Always provide recent documents yourself rather than relying on Claude’s own knowledge of current financials.

Step 2: Write Your Investor Identity Prompt

This is the most important step in the entire guide. If done right, it transforms Claude from a generic assistant into something that thinks like your analyst and provides tremendous value.

At the start of every research session, paste this prompt (customised to you) before you do anything else. It primes Claude with your investing philosophy, your framework, and the level of analysis you expect.

PROMPT 1: Your Investor Identity (customise and save this)

You are my personal investment research analyst. Here is my investing philosophy and framework. Please apply this throughout our entire conversation.

INVESTING PHILOSOPHY:

  • I am a long-term, quality-growth-focused investor with a 5-10 year holding horizon

  • I focus on businesses with durable competitive advantages (moats) and high returns on invested capital (ROIC consistently above 15%)

  • I look for companies that can reinvest a large proportion of earnings at high rates of return (compounders)

  • Capital allocation quality is a primary filter. I want management teams that think like owners

  • I am willing to pay a fair price for an exceptional business, but I am valuation-conscious

WHAT I CARE MOST ABOUT:

  1. Quality and durability of the competitive moat

  2. ROIC trends and reinvestment runway

  3. Management incentives and capital allocation track record

  4. Unit economics and margin structure

  5. Key risks that could impair the thesis

WHAT I DO NOT WANT:

  • Surface-level summaries I could find on Wikipedia

  • Overly bullish framing, I want balanced, honest analysis

  • Vague qualitative statements without backing evidence

  • Financial projections stated as facts

Please ask clarifying questions if you need more context. When I give you a document or company to analyse, apply this framework throughout.

Save this as a text file and paste it at the start of every new conversation. It takes 10 seconds and it changes everything.

Step 3: The Annual Report Deep-Dive

Now the real work begins. Upload or paste the company’s most recent annual report (or 10-K for US companies). For CSU, this is their annual letter to shareholders plus the full financial statements.

Don’t ask Claude to “summarise” it. That’s the generic approach that gives you generic results that are low value. Instead, use a structured prompt that mirrors how a good analyst actually reads a filing.

PROMPT 2: Annual Report Deep-Dive

I have uploaded Constellation Software’s [YEAR/QUARTER X] report. Please analyze it using my investing framework and answer the following:

1. MOAT ASSESSMENT

  • What are the primary sources of competitive advantage?

  • What evidence in this report supports or challenges the moat thesis?

  • Has the moat strengthened or weakened compared to prior years? If any change, what is the reason?

2. CAPITAL ALLOCATION

  • How did management deploy capital this year (acquisitions, buybacks, reinvestment)?

  • What is the ROIC on recent acquisitions, and how does this compare to historical returns?

  • Are there any signs of capital allocation discipline deteriorating?

3. FINANCIAL QUALITY

  • Summarise the key metrics: revenue growth, Gross/Operating/FCF margins, free cash flow conversion, ROIC

  • Are there any accounting choices that warrant scrutiny (revenue recognition, capitalised costs, goodwill treatment)?

  • How does FCF compare to reported earnings?

4. MANAGEMENT COMMENTARY

  • What did management say about the business that was notably honest, straight-forward, or forward-looking?

  • Were there any significant omissions or areas where they were evasive?

5. KEY RISKS MENTIONED (OR NOT MENTIONED)

  • What risks did management acknowledge?

  • What risks do you think are underemphasised or absent from their discussion?

Please be specific and cite the relevant sections of the report where possible.

This prompt alone will get you 80% of the way through a first-pass analysis. The output won’t be perfect, but it will be structured, consistent to the framework you want, and far faster than reading the full document yourself from scratch.

Step 4: The Red Flag Check (Steelman the Bear Case)

This is a crucial step, and will often be extremely valuable.

After you’ve built a positive view of a company, confirmation bias kicks in hard. You start reading everything through a bullish lens (I’ve fallen into this trap many times). Claude can help you fight this by being instructed to argue against you.

PROMPT 3: Steelman the Bear Case

Now I want you to switch roles. Forget the positive framing. Your job is to build the strongest possible bear case for Constellation Software.

Specifically:

  1. What are the 3-5 most credible risks that could permanently impair the thesis?

  2. Is there any evidence in the annual report that the moat is narrowing or that reinvestment returns are declining?

  3. What would have to be true for CSU to be a value trap rather than a compounder?

  4. Are there any red flags in the financial statements that a bull might rationalise away?

  5. If you were a short seller, where would you focus your research?

Be direct and don’t soften the analysis. I want to understand what could go wrong.

The quality of Claude’s bear case will depend heavily on the quality of the document you gave it. If you also upload a short-seller report or a critical analyst note, add that to the conversation before running this prompt.

Step 5: Build Your Valuation Scenarios

I don’t use Claude to build my actual discounted cash flow. I do that in a spreadsheet where I control the inputs. But I use Claude to stress-test my assumptions before I build it, this catches lazy thinking before it manifests into a valuation model.

PROMPT 4: DCF Assumption Stress Test

Based on your analysis of Constellation Software, help me stress-test my valuation assumptions.

My base case assumptions:

  • Revenue growth: 12% per year for 5 years, then 3% terminal

  • EBIT margins: expanding from 16.3% to 17% over 5 years

  • Reinvestment rate: 80% of NOPAT

  • WACC: 8%

Please:

  1. Challenge each assumption. Are they consistent with the company’s historical trajectory?

  2. Define a realistic bull case and bear case for each key input

  3. Identify which single assumption has the biggest impact on intrinsic value

  4. Flag any assumptions that seem inconsistent with each other

Present this as a structured table with three columns: Bear / Base / Bull, with brief rationale for each.

Fill in your own numbers before running this. The output gives you a structured framework you can take directly into your spreadsheet model.

The result from my Constellation Software examples 👇

Claude acts as my sparring partner for my assumptions, giving me pointers to consider for each of the assumption I have given it.

This is how I would proceed:

What would be the FCF per share growth for CSU in each of the scenarios?

Claude then does the calculations based on my inputs, and creates visuals and graphs to make it more professional looking.

I would follow this up with a sensitivity analysis to better understand how movements in FCF per share growth and FCF yield will affect the return.

Note: Always give Claude current numbers like today’s stock price, or for this case, today’s FCF yield.

My prompt (Claude now has all the context, and you can ask it to do what you want and get accurate results):

Create a sensitivity analysis with different valuation and growth points (FCF per share growth and FCF yield). Today’s FCF yield is 7%.

How awesome is that?

I now have a well put sensitivity analysis on Constellation Software that is basically ready for presentations or a report.

If you want it in excel or Power Point format, you can just ask Claude to create the document for you with the proper formatting.

This used to take an analyst hours to do. Claude can now do this for you in a few minutes, with the right prompts and correct reporting documents.

After you’ve done this one time, this process will take you less than 5 minutes, and you can refine the prompts over time to fit your style or needs.

Invest in Quality is a reader-supported publication. To receive new posts and support my work, consider becoming a free or paid subscriber.

The Prompt Playbook: Save These

Here are three additional prompts I use regularly that didn’t fit into the five steps above. These are worth saving to a text file alongside your identity prompt.

Competitive Comparison

PROMPT 5: Head-to-Head Competitor Analysis

Compare Constellation Software and [COMPETITOR] across the following dimensions:

  1. Business model and moat source

  2. ROIC and capital allocation approach

  3. Revenue quality (recurring vs. transactional, switching costs)

  4. Management quality and incentive structure

  5. Valuation: what growth and returns are currently priced in for each?

Where the two companies differ most significantly, explain why that difference matters for long-term compounding.

Earnings Call Analysis

PROMPT 6: Earnings Call Deep-Read

I am uploading the transcript from Constellation Software’s most recent earnings call. Please:

  1. List the 3 most important things management said (that weren’t already in the annual report)

  2. Identify any language changes from prior quarters — are they more cautious, more confident, or evasive on any topic?

  3. What questions from analysts were most revealing, and how did management respond?

  4. Were there any non-answers or deflections that warrant follow-up research?

  5. Does anything in this call change the thesis materially? If so, how?

Initial Screening

PROMPT 7: 5-min analysis (before deep research)

I am considering researching [COMPANY NAME] more deeply. Before I invest significant time, please give me a rapid quality screen:

  1. What business does this company operate, and what is the proposed source of competitive advantage?

  2. Is there publicly available evidence that ROIC is consistently above the cost of capital?

  3. What are the two or three biggest reasons this might NOT be a quality compounder?

  4. Is this a business I would need to monitor quarterly (high execution risk) or one where the moat is structural and durable?

Based on this screen, give me your honest assessment: is this worth a deep dive, or are there structural issues that make it unlikely to meet a quality compounder framework?

What Claude Can’t Do (Very important)

This section matters as much as the prompts.

  • Claude can hallucinate specific numbers. Always verify financial figures against the source document. Never use a number Claude states without checking the original filing.

  • Claude doesn’t know what happened last quarter. Its training has a cutoff date. For anything recent, you must provide the documents yourself (I prefer to always provide documentation).

  • Claude can’t tell you what a stock is worth. It can help you stress-test assumptions, but the judgment call on valuation is yours.

  • Claude is susceptible to the quality of what you give it. A well-written, honest annual report produces better analysis than a PR-heavy one. Garbage in, garbage out.

  • Claude doesn’t replace pattern recognition built over years of reading businesses. It accelerates research. The decision maker and analyst is still you.

  • Claude and AI is a tool that can enhance a great thinker into an exceptional one. By taking the grunt work for you, it frees up time to focus on the truly important questions.

The right mental model

Think of Claude as a very well-read intern who has read everything but experienced nothing. They can synthesise documents faster than any human, structure frameworks clearly, and challenge your thinking. But they have no skin in the game, no track record, and no judgment built from watching businesses succeed and fail over decades. That judgment is yours.

Where to Start Today

Don’t try to implement all five steps at once. Here’s the minimum viable version:

  1. Copy Prompt 1 and customise it to your own investing philosophy. Save it as a text file.

  2. Pick a stock you already know well and upload its latest annual report.

  3. Run Prompt 2 and Prompt 3 back to back. See whether the analysis surprises you, and whether it catches anything you missed.

That’s it. The whole thing takes 25 minutes for a stock you’re already familiar with. Once you’ve done it once, the workflow becomes second nature.

If you build something useful on top of this, a prompt I haven’t included, a workflow that works better for a specific type of business, leave it in the comments below or reply to this email.

Subscribe now

Marius

Whenever you are ready, this is how I can help you:

  1. Go Premium to access exclusive content & follow our market-beating Quality Growth portfolio. Read more here.

  2. Essentials of Quality Growth — Join more than 300 investors who have bought the guide. Essentials of Quality Growth Investing is a multi-step guide for building a stock market portfolio of 10-20 high-performing quality compounders.

  3. (Free) Valuation Cheat Sheet — Learn an easy and reliable method of valuing a business. Learn how to set a margin of safety for your investments.

  4. (Free) How to identify a compounder — Learn how to effectively look for great companies that you can buy and hold for the long term.

  5. (Free) How to analyze the financial statements — Learn how you read & analyze the balance sheet, income statement, and cash flow statement.

  6. Promote yourself to +15.000 stock market investors (42% open rate) — Contact us via: investinassets20@gmail.com

Invest in Quality is a reader-supported publication. To receive new posts and support my work, consider becoming a free or paid subscriber.

☐ ☆ ✇ Invest in Quality

5 Steps to Identify a Strong Moat 🏰

By: Invest In Assets 📈

Hi there, investor 👋

Warren Buffett has spent decades looking for one thing: businesses that can stay profitable for years, even when competitors try to steal their customers.

Invest in Quality is a reader-supported publication. To receive new posts and support my work, consider becoming a free or paid subscriber.

He calls this advantage a “moat.”

Think of medieval castles. The wider and deeper the moat around the castle, the harder it was for invaders to get in. Same with businesses. The stronger their competitive advantage, the harder it is for rivals to chip away at their profits.

4 Types of 'Moats' to Make Your Product/Business Bulletproof! — Ant Murphy

Here’s the thing most investors miss: not every successful company has a moat. Some businesses are great today but vulnerable tomorrow. Others look boring but are practically impossible to displace.

The difference? Five questions.

Question 1: Can Competitors Easily Copy This?

This is where most companies fail the moat test.

If a rival can replicate your business model in six months, you don’t have a moat. You have a head start. And head starts evaporate fast.

Take restaurants. You can copy almost anything—the menu, the decor, the service style. That’s why most restaurants struggle to maintain high margins. There’s always another spot opening down the street.

What Percentage of Businesses Fail Each Year? (2025 Data)

Compare that to Visa. Good luck building a competing payment network. You’d need to convince millions of merchants and billions of consumers to switch. Even with unlimited money, it would take decades.

The pattern: Patents, proprietary technology, massive scale, or network effects create moats. Execution alone doesn’t.

Question 2: Would Customers Care if This Company Disappeared?

Brutal question. But it cuts right to the core.

If your business vanished overnight, would customers scramble to find you? Or would they shrug and buy from whoever’s convenient?

How to Conduct a Product-Market Fit (PMF) Survey

Coca-Cola passes this test easily. People have emotional connections to the brand. They’ll pay more for Coke than generic cola, even when the taste difference is minimal. That’s pricing power—the ultimate sign of a moat.

Airlines? They fail hard. Nobody cares which airline they fly. They just want the cheapest ticket. That’s why airlines have such terrible economics despite moving millions of people every day.

The test: If customers view your product as interchangeable with competitors, you’re a commodity. Commodities don’t have moats.

Question 3: Does the Company Have Pricing Power?

Here’s the simplest moat test: If they raised prices 10% tomorrow, would customers keep buying?

Apple can do this. They’ve done it repeatedly with iPhones, and people keep lining up. That’s a moat.

Most retailers can’t. Raise prices and shoppers just go next door. That’s the absence of a moat.

How to spot companies with real pricing power (before everyone else)

Pricing power shows up in the numbers. Look at gross margins over time. Companies with moats maintain or grow their margins. Companies without moats see margins slowly erode as competition forces prices down.

Fico is a great example of pricing power and increasing gross margins:

Costco is also interesting. They deliberately limit their pricing power—they cap markups at 14% on branded goods and 15% on their Kirkland private label. But this constraint is actually their moat. By committing to low prices, they’ve built customer loyalty so strong that their membership renewal rate exceeds 90%. Members know Costco won’t gouge them, so they keep coming back.

The insight: Real pricing power means you can raise prices without losing customers. If you can’t, your moat is weak or nonexistent.

Question 4: Are Returns on Capital High and Staying High?

This is where finance meets reality.

Return on Invested Capital (ROIC) measures how much profit a company generates from every dollar it invests in the business. High ROIC companies turn money into more money efficiently.

We know that high ROIC businesses perform much better than their low-ROIC counterparts:

But here’s what matters for moats: consistency.

Companies with real moats maintain high returns on capital year after year. Why? Because their competitive advantages protect them from the usual pattern where high returns attract competition and drive returns back down.

Look at Microsoft. For decades, they’ve generated returns on capital well above 20%. Competitors try to chip away at Office, Windows, and now Azure, but Microsoft’s ecosystem moat keeps the profits flowing.

Compare that to most retailers or manufacturers. They might have one great year with high returns, but then competition catches up and returns fall. That’s capitalism working—but it also signals no moat.

The data: According to research from Missouri State University, companies with wide economic moats consistently outperform companies with no moat. The difference isn’t subtle. It compounds over decades.

Here are the highest ROIC industries for US companies:

Question 5: Is the Moat Getting Wider or Narrower?

Moats aren’t static. They’re always changing.

Buffett himself says moats are either widening or shrinking, even when the changes aren’t obvious in the short run.

Here’s a breakdown from Morningstar on different moat types:

From the data, wide and narrow moat businesses outperform the no-moat companies significantly.

Amazon’s moat has widened dramatically. Every new Prime member makes the service more valuable. Every third-party seller on the platform gives customers more options. Every AWS customer makes Amazon’s cloud business harder to displace. The feedback loops compound.

Traditional retail banks? Their moats are shrinking. Fintech companies can now do most of what banks do—and they’re doing it cheaper and faster. The regulatory moat banks once enjoyed is eroding.

The question: When you look at a company, ask yourself: will their competitive advantage be stronger or weaker in five years?

If you want to get deeper into this subject, I highly recommend Measuring the moat by Mauboussin.

Real World Examples

Let’s apply this framework:

Costco - Wide Moat:

  • Can’t copy the scale advantages and buying power (Question 1)

  • Customers love the treasure hunt experience and low prices (Question 2)

  • Membership model locks in recurring revenue, 90%+ renewal rates (Question 3)

  • Consistent returns year after year (Question 4)

  • Global expansion and e-commerce growth widening the moat (Question 5)

Apple - Wide Moat:

  • Brand built over decades, impossible to replicate (Question 1)

  • Emotional connection drives customer loyalty worldwide (Question 2)

  • Can charge premium prices vs. competitors (Question 3)

  • Maintains high margins despite intense competition (Question 4)

  • Brand strength endures across generations (Question 5)

Most Airlines - No Moat:

  • Easy to replicate business model (Question 1)

  • Customers just want cheap tickets (Question 2)

  • Zero pricing power, constant fare wars (Question 3)

  • Returns on capital barely cover cost of capital (Question 4)

  • Competition keeps intensifying, any advantage is short lived (Question 5)

Why This Matters For Your Money

Companies with wide moats compound returns over decades.

Think about it: if a company can maintain high returns on capital while reinvesting profits back into the business, shareholders win. The returns compound.

Research from Morgan Stanley shows that companies sustaining ROIC above their cost of capital for longer than the market expects generate significantly higher returns for shareholders. These are the “compounders” that create generational wealth.

But companies without moats are traps. They might look cheap on a P/E ratio, but cheap isn’t enough if profits are about to get competed away.

This is why we’re very careful about buying bargain stocks. The price often reflects the quality (But not always).

Conclusion

Five questions. That’s all you need.

Can competitors copy this? Would customers care if it disappeared? Can they raise prices? Are returns staying high? Is the moat widening or shrinking?

Get these right, and you’ll avoid most bad investments.

Because in the end, capitalism is brutal. High profits attract competition like blood attracts sharks. The only defense is a moat wide enough to keep the sharks out.

Most companies don’t have one. The ones that do are worth finding—and holding onto.

Whenever you are ready, this is how I can help you:

  1. Go Premium to access exclusive content & follow our market-beating Quality Growth portfolio. Read more here.

  2. Essentials of Quality Growth — Join more than 300 investors who have bought the guide. Essentials of Quality Growth Investing is a multi-step guide for building a stock market portfolio of 10-20 high-performing quality compounders.

  3. (Free) Valuation Cheat Sheet — Learn an easy and reliable method of valuing a business. Learn how to set a margin of safety for your investments.

  4. (Free) How to identify a compounder — Learn how to effectively look for great companies that you can buy and hold for the long term.

  5. (Free) How to analyze the financial statements — Learn how you read & analyze the balance sheet, income statement, and cash flow statement.

  6. Promote yourself to +25.000 stock market investors (42% open rate) — Contact us via: investinassets20@gmail.com


Invest in Quality is a reader-supported publication. To receive new posts and support my work, consider becoming a free or paid subscriber.

☐ ☆ ✇ Invest in Quality

Factsheet April 2026 📈

By: Invest In Assets 📈

Hi there, partner 👋

April was a good month for the portfolio, up +12.34%.

After a bruising March, where tariff uncertainty and macro repricing hit almost every position, April delivered a meaningful recovery. The businesses we own kept compounding. The market started paying attention again.

No positions were added or removed. The portfolio remains concen…

Read more

☐ ☆ ✇ Invest in Quality

Copart: Quality Compounder Trading at a Discount 📈

By: Invest In Assets 📈

Hi there investor 👋

Today we’re breaking down a quality darling trading at its cheapest valuation in a decade.

Most investors don’t pay attention to Copart.

It’s a company that picks up totalled cars, stores them on land it owns near every major city in America, and sells them at online auction to a global network of 300,000 registered buyers.

The Rise of Copart: From Salvage Yard to Tech Giant

They don’t have any exciting AI products, they don’t go viral, and there is nothing fancy about the business. They make money on crashed cars, owned real estate, and a marketplace that has compounded for four decades, run by a family with deep expertise in the industry.

And right now, for the first time in roughly ten years, it’s trading at a 30–35% discount to its long-term average valuation multiples.

The stock is down ~40% from its all-time highs. Two real headwinds have arrived simultaneously. And management just deployed $1.12 billion buying back its own shares in under 90 days.

This is the full breakdown. Let’s get into it. 👇

Invest in Quality is a reader-supported publication. To receive new posts and support my work, consider becoming a free or paid subscriber.


How Copart makes money

When your car is totalled in an accident and your insurance company decides it isn’t worth fixing, they need to get rid of it. They call Copart.

Copart sends a truck to pick it up, stores it at one of their 250+ yard locations across 11 countries, lists it on their online auction platform, and sells it to the highest bidder. This could be a dismantler in Texas, a rebuilder in Poland, a parts dealer in West Africa, or a mechanic in the Middle East looking for a repairable car.

📈 Copart - Compounding Quality

For this service, Copart charges fees to both the seller (the insurance company) and the buyer. Crucially, they don’t own most of the vehicles, they operate the marketplace on a consignment basis. The seller keeps the proceeds minus fees. Copart keeps the fees.

This model produces economics that would be extraordinary in any industry. In a business that involves physically moving crashed cars around, Copart runs:

  • 42% EBITDA margins

  • ~32% return on invested capital

  • $1.4B of free cash flow on $4.6B of revenue

  • $5.1B of cash on the balance sheet with zero meaningful debt

For context, Mastercard, widely considered one of the best business models in the world, runs about 57% EBITDA margins. Copart runs 42% picking up cars from people’s driveways. It is one of the most capital-efficient physical businesses in public markets.


The Moat: A tale of Five Layers

Copart’s moat consists of five layers that create a resilient and sustainable competitive advantage. The five layers compound and build on each other.

1. Physical land ownership

Copart owns the land its salvage yards sit on. More than 250 locations, the majority owned outright rather than leased. Getting a salvage yard permitted near a major metropolitan area takes years of regulatory work, community relations, and capital. You simply cannot replicate this network by writing a cheque. It took Copart four decades to build.

This also explains one of the most interesting strategic moves in recent memory: Copart holds hundreds of acres of otherwise idle land specifically reserved for hurricane-season vehicle storage. That land sits empty, generating zero revenue, until a major storm hits and suddenly becomes the most valuable real estate in the country. No competitor can do this because no competitor has been building this long enough.

2. The digital auction platform, years ahead

Copart moved to an exclusively online auction platform in 2003. Their only real competitor, IAA (now owned by RB Global), was still running physical auctions until COVID forced their hand in 2020. That is a 17-year head start on building a global digital buyer base, an online-first culture, and decades of auction data.

This Is How Copart Works!

That data advantage matters more than it looks. Every auction outcome: what vehicle, what condition, what buyer, at what price, feeds back into search results, recommendations, and AI-powered tools. A competitor starting today would need years just to replicate the data, let alone the buyer habits.

3. +300,000 global buyers

Copart has 300,000 paying registered members from virtually every non-sanctioned country in the world. International buyers now account for roughly 40% of US vehicles sold and nearly 50% of auction value.
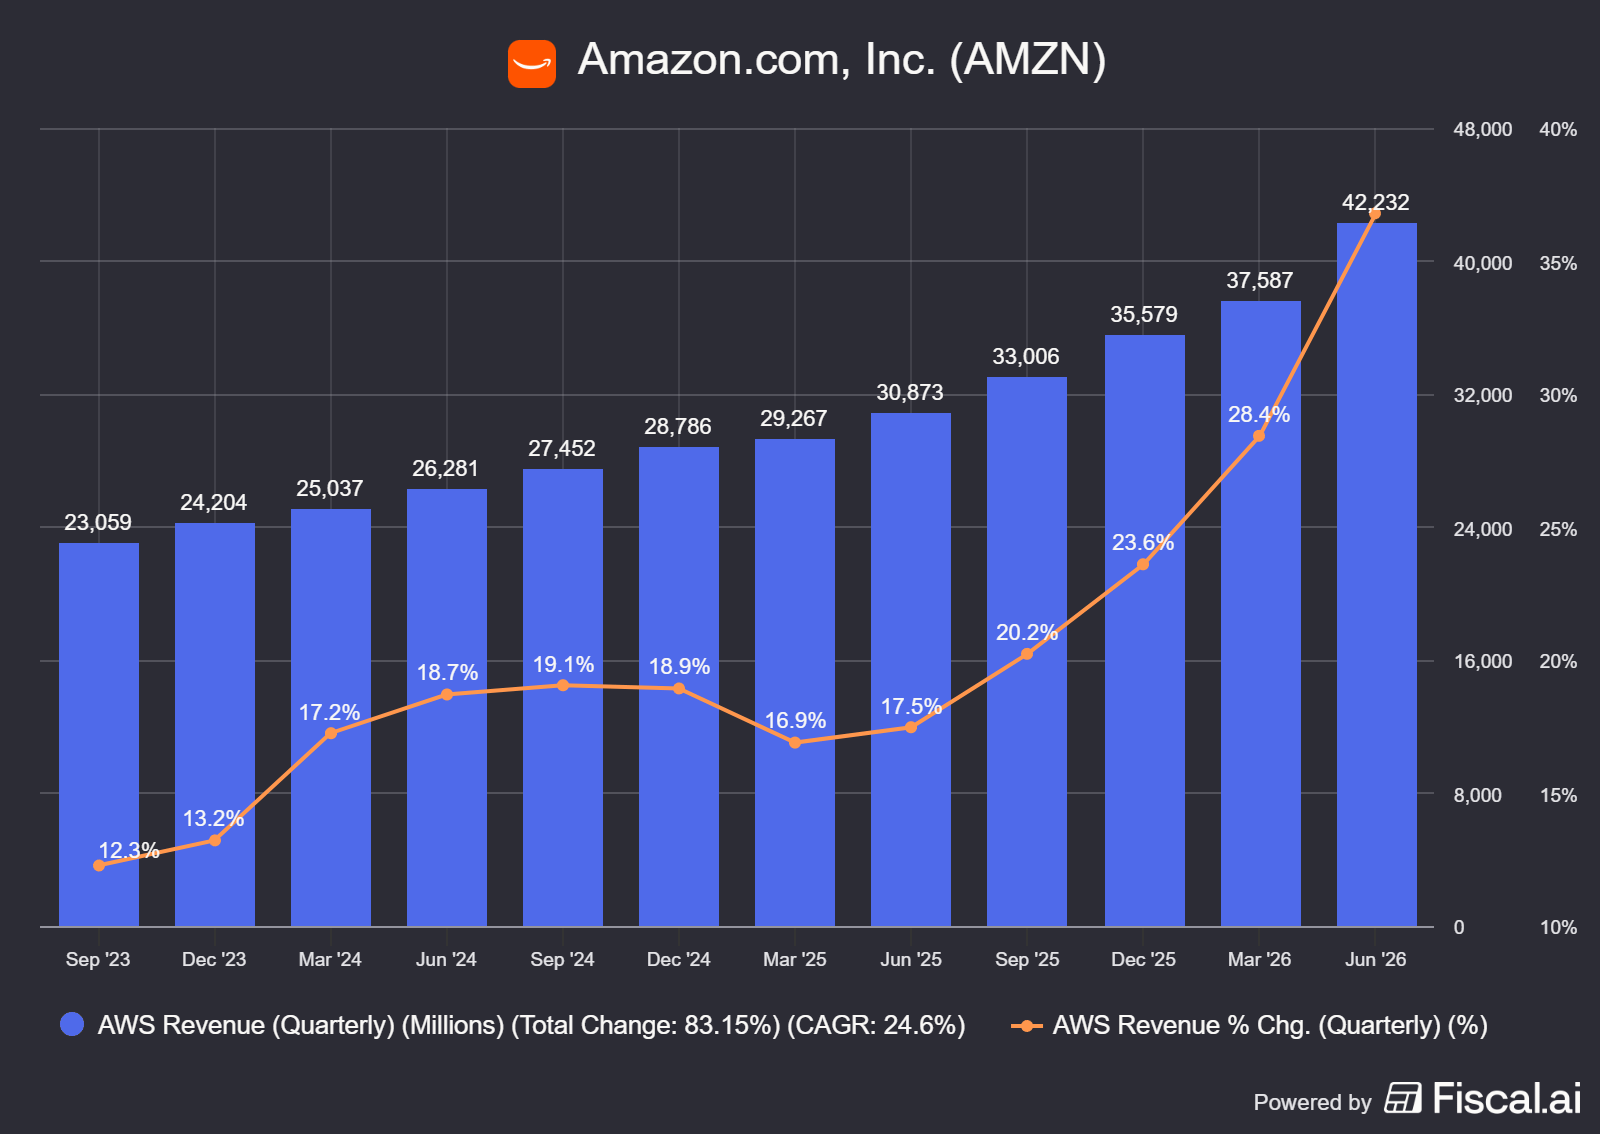
Why does this matter? International buyers pay more. On average, the vehicles purchased by international buyers are 38% more valuable than those purchased by domestic buyers, because they’re shipping them across an ocean, which only makes economic sense for higher-quality vehicles. These buyers pay freight cost, import duties, and logistics, and they do it because Copart’s auction depth gives them confidence they’re getting fair market value.

CEO Jeff Liaw puts it simply: “Liquidity begets liquidity.” More buyers produce higher prices, which attract more sellers, which attract more buyers. Every Copart auction you participate in as a buyer increases the platform’s value for every other buyer. This is a textbook network effect, running inside a business that buys crashed cars.

4. Proprietary data

Copart employs approximately 1,000 engineers, a number that would be notable for a tech company, let alone a salvage auction business. They’ve deployed LLM-powered total-loss decision tools that help insurance carriers make instant total-loss calls from a small sample of vehicle photos. These tools are trained on millions of historical auction outcomes that nobody else has. Two full years into deployment, they’re still expanding.

5. Title Express

When a car is totalled, the insurance company needs to obtain the vehicle title from the bank (if there’s a loan) or the owner. This sounds mundane. It is, in practice, the critical bottleneck that determines how quickly the whole claim resolves.
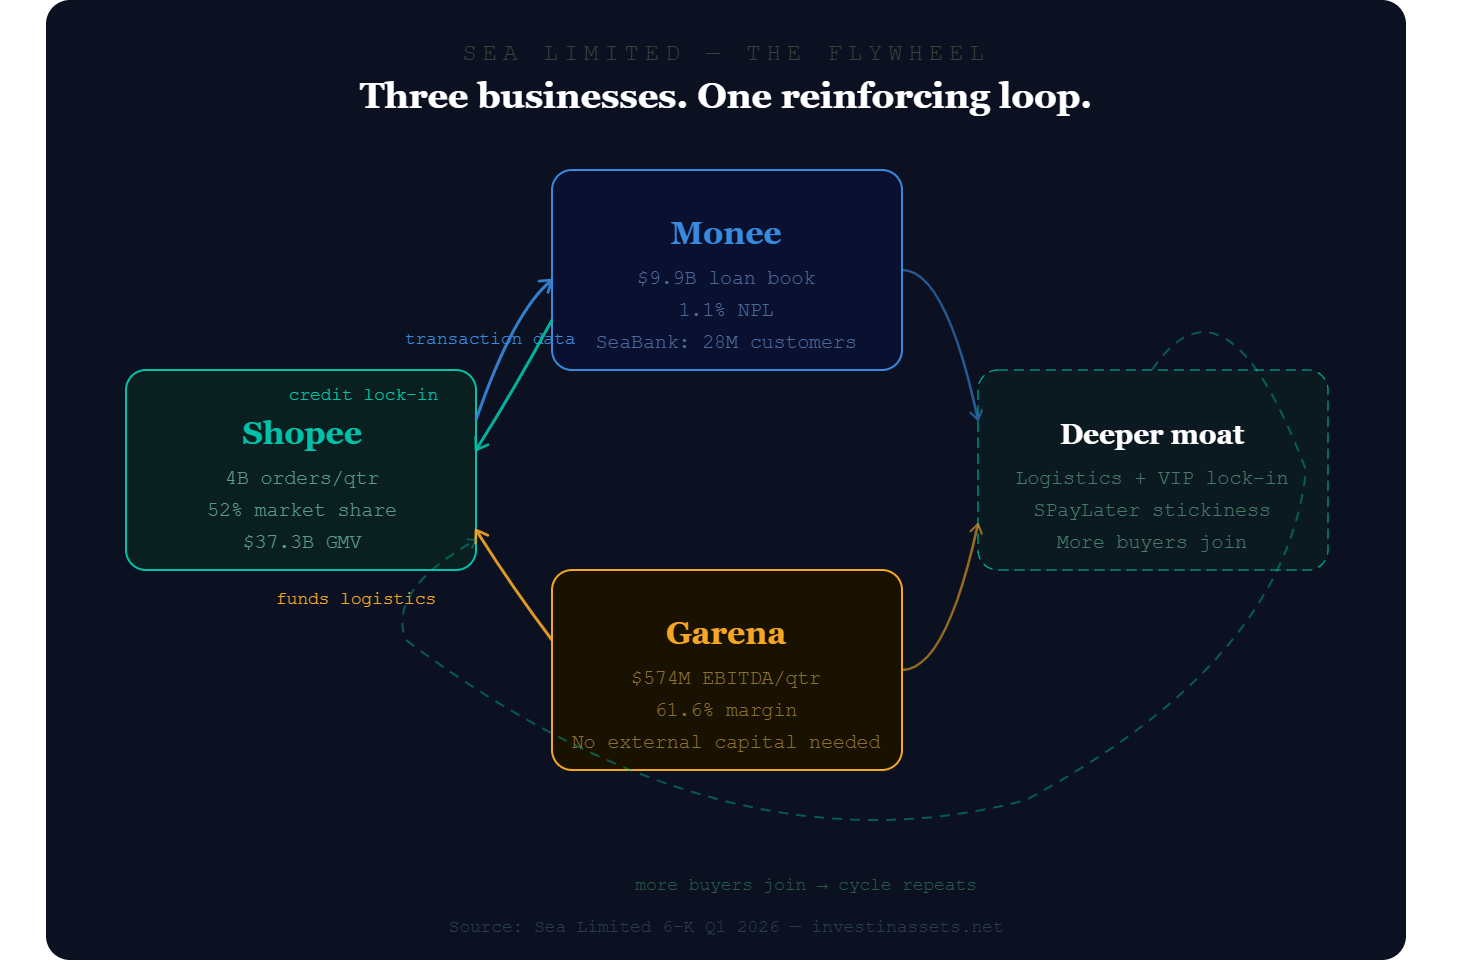
Copart’s Title Express platform is 5x larger than any competitor’s and delivers cycle times 10 days faster than insurance carriers can achieve on their own. Ten days sounds small. On a ~$15,000 vehicle with daily storage costs, ten days faster means real money saved per claim, multiplied across millions of claims per year. This is the operational advantage that keeps carriers coming back. The one that’s hardest for IAA to replicate because it’s built on scale and purpose-built technology.


Structural Tailwind: Why Cars Keep (And will continue to keep) Getting Totalled
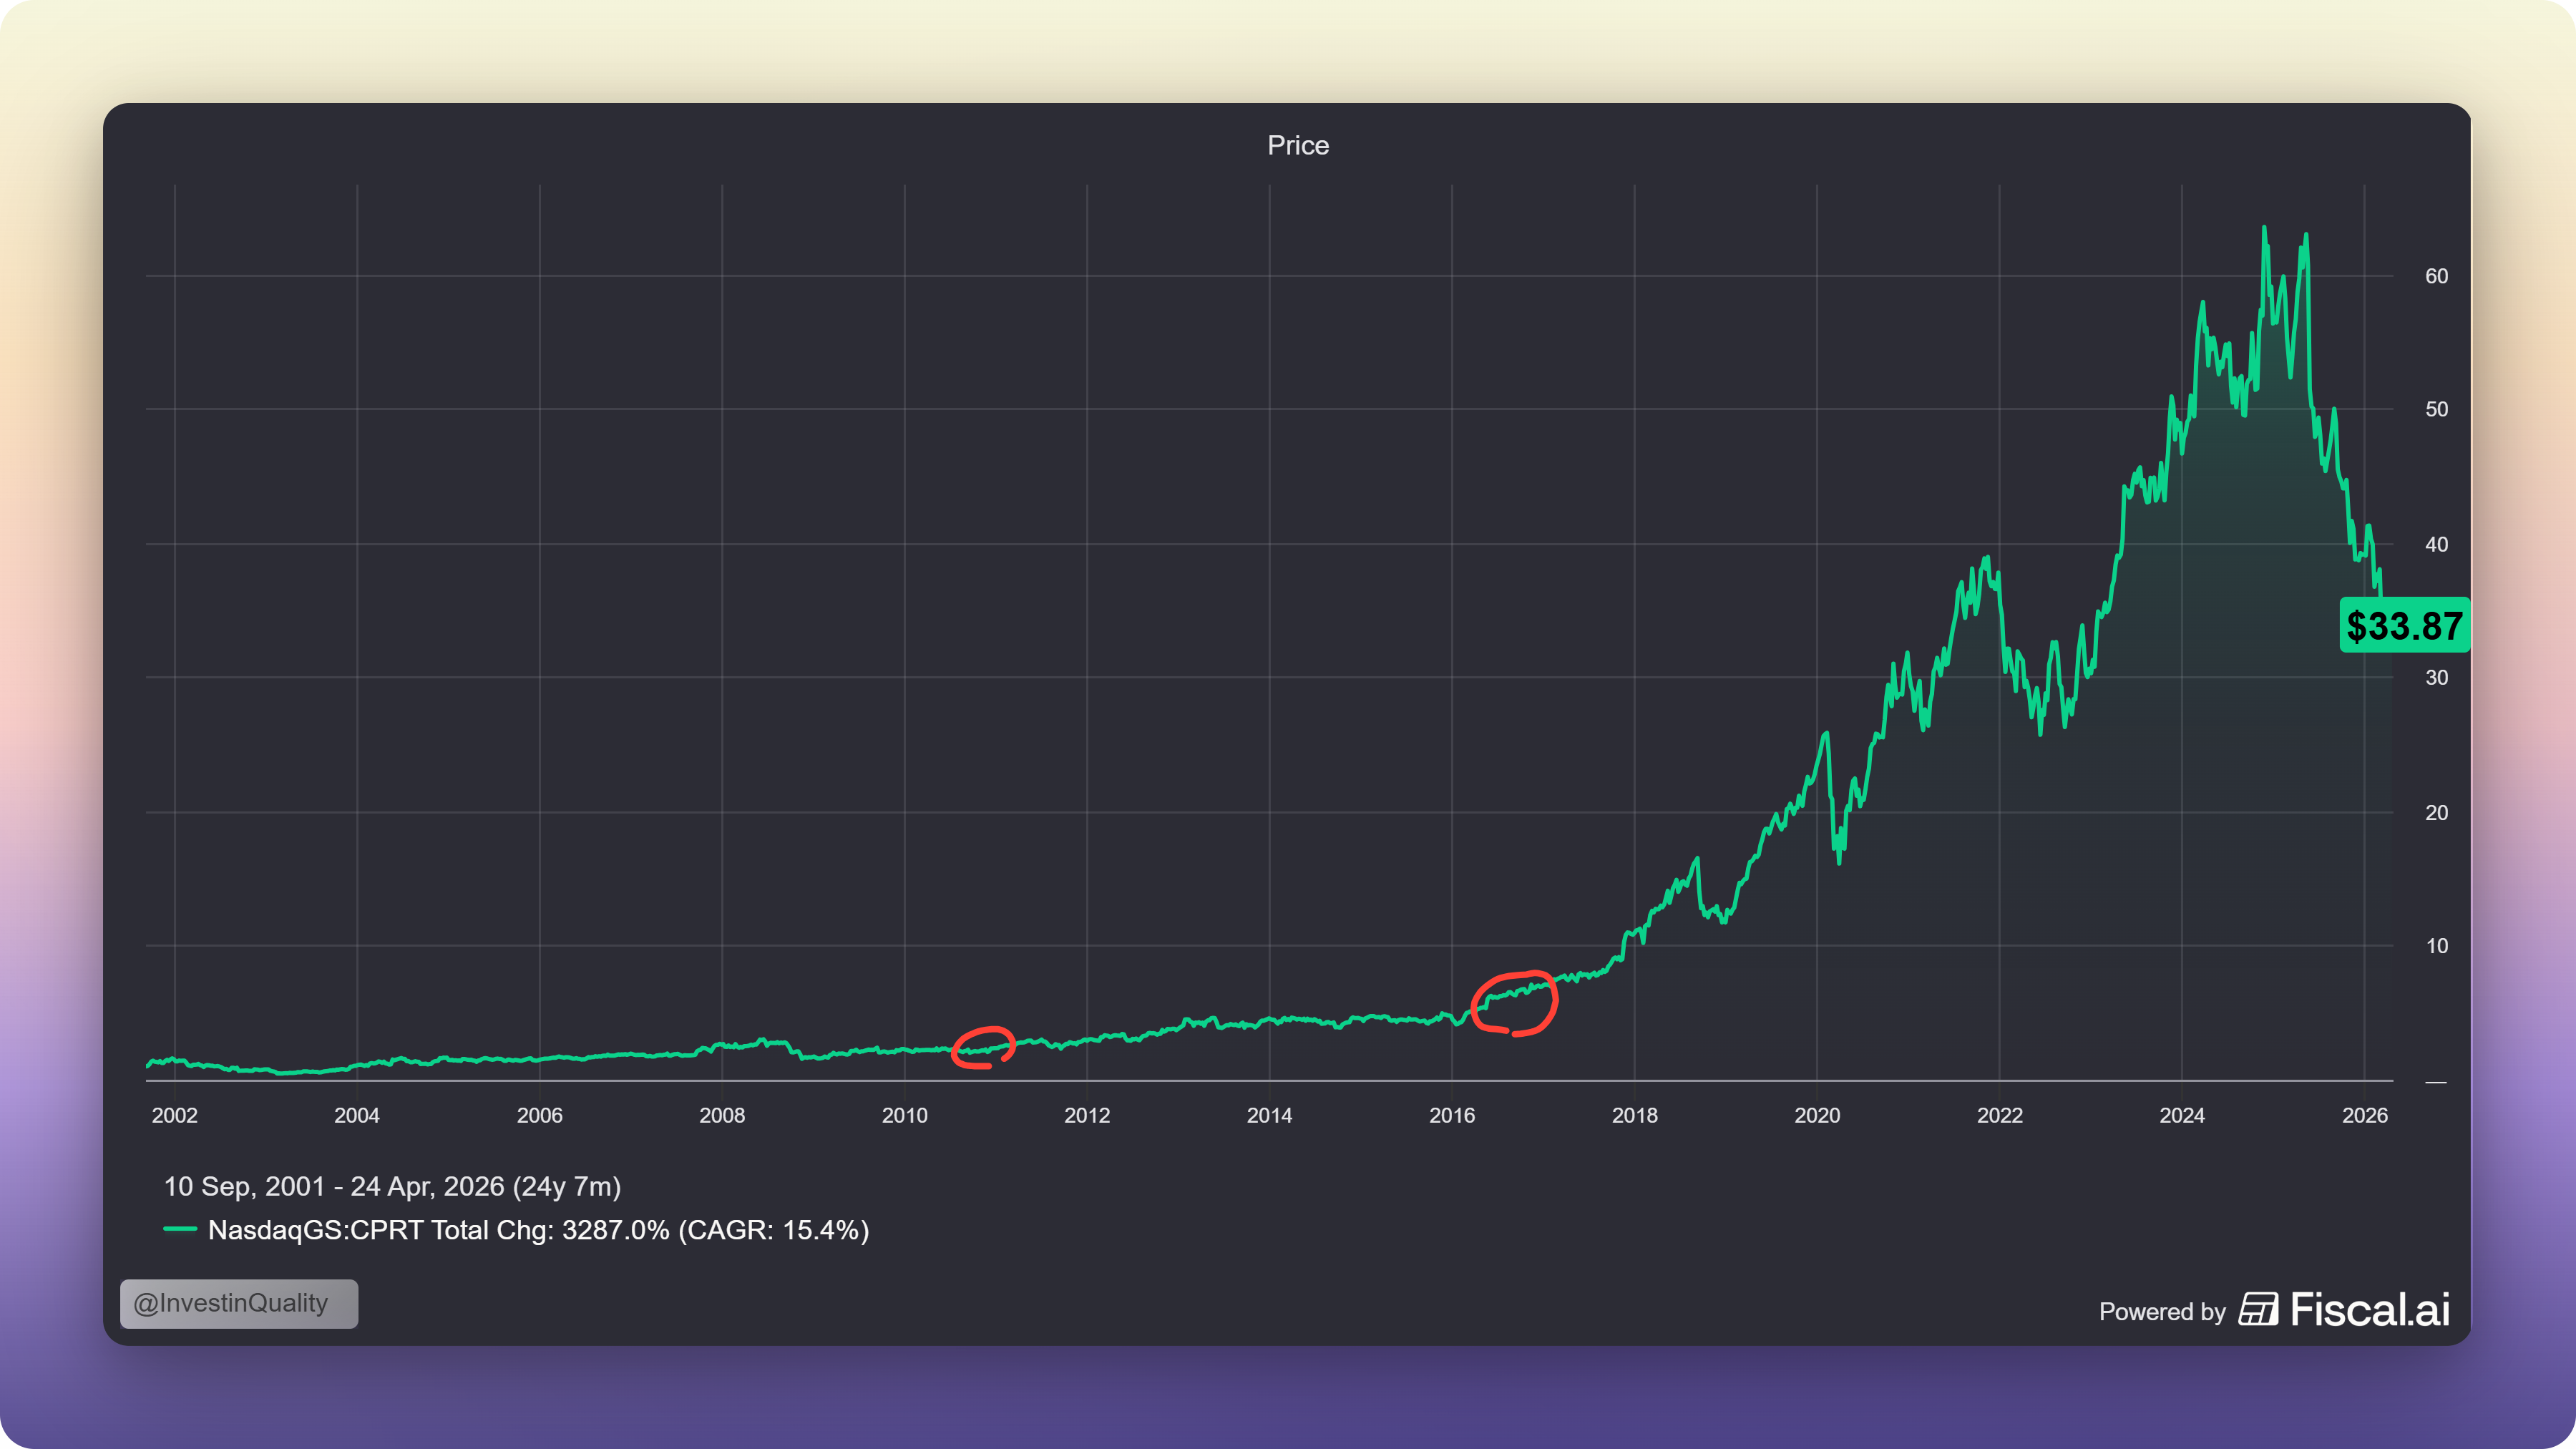
Here is the most important insight about Copart’s business, and the reason this company has compounded for 40+ years despite declining accident rates.

Total loss frequency: the percentage of accident-involved cars that get written off rather than repaired has been rising relentlessly for four decades:

Year Total Loss Frequency according to CCC Crash Course 2026 report:

  • 1980 ~4%

  • 1990 ~5%

  • 2000 ~10%

  • 2015 15.6%

  • 2025 23.1%

That’s a nearly 6x increase since 1980, and the trend shows no sign of reversing. The CCC 2026 Crash Course report documented record 23.1% total loss frequency for full-year 2025, with Copart’s management citing 24.2% for Q4 2025 specifically.

Why does this keep happening?

Modern cars are extraordinarily sensor-dense. Every bumper has radar. Every A-pillar has a camera. Every headlight assembly has adaptive motors and alignment sensors. CCC data shows that 28.3% of all repairable estimates in 2025 required at least one sensor calibration, up from 21.8% just a year prior. On insurance-company-approved repair estimates specifically, the calibration rate was 35.6%.

The math is simple: if your front bumper gets hit at 15 mph, the repair used to cost $1,200. Now it costs $2,800 because the radar module in that bumper needs recalibration, reprogramming, and verification. At some point, that repair cost exceeds the car’s value, and the carrier writes it off as a total loss. More complexity = higher repair costs = more total losses. And cars only get more complex.

The average US light vehicle was 12.8 years old in 2025. Older cars have lower actual cash values, meaning even modest repair estimates push them over the total-loss threshold.

Electric vehicles make this worse. EVs are sensor-heavy at the perimeter. Any damage that involves bumper-mounted sensors, battery integrity concerns, or charging systems can quickly make repair uneconomical. Jeff Liaw said on the Q4 2025 call: “They total, if anything, more easily.”

The crucial distinction: accident frequency has declined every year for 40+ years thanks to ADAS and safer road design. But total loss frequency has risen 5x over the same period. The total-loss trend has overwhelmed the accident-frequency trend every single year of Copart’s existence as a public company. Liaw’s long-term forecast:

“We’ll reach 25% and we’ll reach 30%.” The current reading is 24.2%. He’s not projecting something extraordinary, he’s extrapolating a 40-year trend.

Subscribe now


So Why Is the Stock Down 40%?

Two headwinds have arrived at the same time, and they’ve been brutal to the reported numbers.

Headwind 1: The underinsurance cycle

Auto insurance premiums rose 17% in 2024 and 7.6% in 2025 as carriers recovered from a brutal claims-inflation period. Consumers responded rationally: they dropped coverage.

The Insurance Research Council found that 33.4% of US drivers are either uninsured or underinsured. This is a 10-point increase since 2017. More starkly, earned car years (active collision policies) fell 4.1% YoY in Q2 2025, even as the actual vehicle fleet grew 1.4%.

That 5.5-point wedge between active policies and vehicles on the road is the underinsurance cycle. When a driver without collision coverage has an accident, the car doesn’t go to Copart, it ends up scrapped, retained, or sold privately. Copart’s US insurance unit volumes fell 9.5% in Q1 2026 and 10.7% in Q2 2026.

This is a cycle, not a structural shift.

Carrier profitability is now at a multi-decade peak. Progressive earned $11.3B in 2025. Allstate earned $10.2B. State Farm earned $12.9B (more than double the prior year) and announced a $5B policyholder dividend alongside rate cuts in 40 states averaging roughly 10%. When carriers cut prices, coverage becomes affordable again, earned car years recover, and salvage volume follows with a 6–12 month lag. We appear to be at the beginning of that cycle today.

Headwind 2: The Progressive/IAA volume shift

Progressive is the fastest-growing major US auto insurer of the past decade. It has been shifting a larger portion of its salvage volume to IAA (Copart’s competitor). Sell-side estimates suggest IAA’s share of Progressive’s salvage business moved from ~75% to ~90% during 2025. Since Progressive represents roughly 15% of the US auto insurance market, this shift amounts to an estimated 50,000–70,000 annualised unit headwind for Copart.

Management won’t say “Progressive” on earnings calls, careful not to escalate a dispute with a customer they presumably want back. But Liaw’s language in Q2 2026 earnings call gave it away: “We may be in a uniquely or unusually Copart adverse moment in time in that respect… but over the long haul we view those trends as often more cyclical than they are secular.”

The net result of both headwinds together: the headline numbers look terrible. Revenue down 3.6% in Q2 2026. EPS below consensus. Unit volumes down 8–10%. The stock has been punished.

The market is always forward looking, but the last 17 quarters have seen OK growth despite the recent headwind to unit volumes.


The Fundamentals

Despite the volume headwinds, the underlying financial quality has been remarkable.

Revenue, earnings and free cash flow per share since 2019:

Gross, operating and free cash flow margins remain robust, FCF margins have expanded significantly since 2023:

Return on invested capital is consistently above 25%, but the decline since 2022 is something investors should monitor over time:

The balance sheet is extraordinary:

  • Cash: $5.1B

  • Debt: effectively zero

  • Total liquidity: $6.35B (including a new $1.25B undrawn revolver signed January 2026)

  • Stockholders’ equity: $9.79B

This is one of the cleanest balance sheets in the S&P 500 for a company of this size.

Low debt levels create more room for flexibility and making good capital allocation decisions in down cycles. And the management team has proven its prudence for capital allocation in the past.


The Competitive Landscape

Copart operates in a genuine duopoly for US insurance salvage auctions. Its only real competitor is IAA, now owned by RB Global following a $7.3B acquisition that closed in March 2023.

That acquisition was messy. Leverage spiked to 3.0x. There was CEO turnover. Integration costs were significant. But RB Global has stabilised. Leverage is still high, but manageable (Although not something we would invest in):

Here’s where the valuation comparison gets interesting — and somewhat baffling:

  • RB Global trades at a forward PE of 23.6x

  • Copart trades at a forward PE of 20.8x

  • RB Globals 5 year average ROIC is 7.1%

  • Copart’s 5 year average ROIC is 31.6%

  • RB Globals long term EPS growth estimate is 10%

  • Copart’s long term EPS growth estimate is 15%

  • RB Globals interest coverage is 4.1x (Not good)

  • Copart’s interest coverage is infinite (No debt, no interest payments)

Cheaper valuation, higher return on invested capital, higher future growth estimates, and no debt compared to high debt levels…

In plain English: Copart is trading at a lower multiple than its more levered, lower-quality, lower growth competitor.

The only explanation is momentum. RBA is improving from a messy base. CPRT is declining from a pristine one. The market is paying for direction-of-change, not quality of business. That mispricing tends not to last.


Management: What The Buyback Actually Tells You

Jeff Liaw, who became sole CEO in April 2024, is worth paying close attention to. His earnings call language is intellectually rigorous, unusually specific, and direct about uncertainty in a way that most public-company management teams are not.

But what matters most right now isn’t what Liaw says, but what Copart does.

For nearly three full years (2023, 2024, 2025, and Q1 2026) Copart repurchased zero shares while cash built from $1.8B to $5.1B. The inaction looked strange for a company sitting on a mountain of cash.

Then, in under 90 days:

  • November 2025 – January 2026: 5.48M shares repurchased for $218M at ~$39.82 average

  • February 1 – March 2, 2026: 24.26M shares repurchased for $899M at ~$37.11 average

  • Total: 29.7M shares, $1.12B deployed, at a blended average of $37.60

Liaw’s characterisation of the timing on the Q2 2026 call: “There’s no particular witchcraft or anything magical to it. I think it’s a function of what general valuation multiples are and where interest rates are, our own views of Copart’s relative valuation.”

No witchcraft. Just management deploying 22% of its entire cash balance to buy back stock at the cheapest valuation in a decade, after doing nothing for three years when the stock was at $50–$60.

This is exactly how great capital allocators behave. Copart did massive buybacks in 2011 (29% of shares outstanding) and 2016 (12% of shares outstanding):

Both times, the stock subsequently compounded dramatically.

Willis Johnson, the founder who still owns ~74 million shares worth ~$2.5B, built a culture of treating each dollar as precious, and buying back stock only when the math is clearly in shareholders’ favour.

The message from this buyback is unambiguous: management believes the stock at $34–38 is materially undervalued relative to their internal estimate of intrinsic value.


Valuation: Multi-Year Lows

At $33.87, here’s where Copart trades against its own history:

Copart currently trades at 21.22x forward PE, not seen since 2017:

Free cash flow yields are also trading at the highest since 2017:

This is a 30–35% discount to long-term averages. Copart last traded at these multiples in 2017. Before that, briefly during the 2008–2009 financial crisis. In 32 years as a public company, this is the deepest non-crisis multiple compression Copart has ever experienced.

The market is implying, through this multiple, that Copart will grow revenues at roughly 2.5–3.5% annually with flat margins. Given a business that has compounded at 10%+ every rolling three-year period since 2003, a 300,000-member global buyer network still expanding, and a structural total-loss-frequency trend that has beaten expectations every year, the market’s implied growth rate looks about half of what this business demonstrably delivers over time.

Three 18-month valuation scenarios:

Bull case $55–65:

Unit volumes inflect positive in Q3–Q4 2026 as carrier rate cuts restore coverage. Progressive allocation partially reverses. Buybacks reduce share count 7–10%. 2027 EPS of ~$2.10–2.20 at 28x = $58–62.

Base case $44–50

Modest volume recovery. Progressive shift stabilises. Margins hold at 41–42%. Buybacks provide EPS floor. 2027 EPS of ~$1.85–1.95 at 24–26x = $44–50.

Bear case $25–30

Progressive loss proves structural. Underinsurance persists. DOJ settlement costs $300–500M. Margins compress. 2027 EPS $1.50–1.65 at 18–20x = $26–30.

That is the short term scenarios, here are the three long-term scenarios for Copart:

  • Long-term value estimate: $47.52

  • Current price: $33.87

  • Upside: +40.3%

  • CAGR potential: +17.5%

The buyback math alone is meaningful

At a cumulative $2.5B deployed at ~$38, the share count falls roughly 6.7%. Applied to base-case 2027 EPS, post-buyback earnings per share would be approximately 7% higher than pre-buyback. That turns a flat-EPS year into a growth year and puts a hard floor under the stock.

Analyst consensus price targets range from $32 (Barclays, Underweight) to $62–65 (HSBC and CFRA, Buy/Strong Buy). Consensus sits around $44–48. Everyone agrees the stock is cheap relative to the business quality, the debate is purely about whether volumes recover.


What Could Go Wrong?

No breakdown is complete without an honest risk assessment.

The underinsurance cycle could be slower to reverse than expected. Carrier rate cuts in 40 states are happening now, but the lag from rate filing → policy in force → accident → salvage consignment is 6–12 months. If macro conditions worsen and drivers prioritise other expenses over reinstating coverage, the salvage pool recovery could be delayed by another 12–18 months.

The Progressive/IAA shift may be partly structural. IAA has genuinely improved its service metrics post-acquisition. Part of this volume shift likely reflects real carrier-level preference for two-vendor redundancy — not just IAA’s improved execution. It probably doesn’t fully reverse. We size the sustained headwind at 1.5–2.5% of Copart revenue over the next 24 months.

The DOJ investigation is an unresolved overhang. Since October 2023, Copart has disclosed a DOJ letter related to potential money-laundering control violations in its buyer-onboarding processes. As of March 2026, there’s no update beyond boilerplate. Based on comparable enforcement cases, we estimate a likely settlement in the tens-to-hundreds of millions. This is real but not balance-sheet-threatening. But “we don’t know” is the accurate answer.

Long-duration ADAS risk. Over a 20-year horizon, if autonomous vehicles genuinely achieve mainstream adoption, accident frequency could decline sharply enough to offset rising total-loss frequency. Liaw’s response to this on Q4 2025 was honest: “At this point, a de minimis effect.” The fleet-turnover math (16M new vehicles into 289M VIO) suggests this wouldn’t show up materially for decades even in a scenario where fully autonomous vehicles succeed. But it’s a real tail risk.


The Investment Case Summarized

Copart is a duopoly infrastructure business with 41.2% EBITDA margins, 31.6% ROIC, $5.1B of net cash, and a structural tailwind (rising total loss frequency) that has compounded for 40 straight years.

Today it trades at 20.8 forward PE, this is a 30% discount to its 10-year average and a discount to its lower-quality competitor (RB Global). Two cyclical headwinds (consumer underinsurance and one large carrier’s volume shift to IAA) are real, but most likely temporary.

The company’s management (with deep insider ownership and a 40-year track record of disciplined capital allocation) just put $1.12 billion of the company’s own money into buybacks at $37.60 after not buying a single share for three years.

The one question that matters: is the unit-volume weakness a cycle or a structural break? The 40-year total-loss-frequency trend, the all-time-high auction quality metrics (bidder count, pure sale rate, gross returns), and the insurance carrier profitability setup all say it’s a cycle.

At $33.87, you’re being offered one of the highest-quality business models in the US market at a price the company’s own management believes is cheap.

Subscribe now


Whenever you are ready, this is how I can help you:

  1. Go Premium to access exclusive content & follow our market-beating Quality Growth portfolio. Read more here.

  2. Essentials of Quality Growth — Join more than 300 investors who have bought the guide. Essentials of Quality Growth Investing is a multi-step guide for building a stock market portfolio of 10-20 high-performing quality compounders.

  3. (Free) Valuation Cheat Sheet — Learn an easy and reliable method of valuing a business. Learn how to set a margin of safety for your investments.

  4. (Free) How to identify a compounder — Learn how to effectively look for great companies that you can buy and hold for the long term.

  5. (Free) How to analyze the financial statements — Learn how you read & analyze the balance sheet, income statement, and cash flow statement.

  6. Promote yourself to +25.000 stock market investors (42% open rate) — Contact us via: investinassets20@gmail.com

☐ ☆ ✇ Invest in Quality

5 Undervalued Quality Businesses💎

By: Invest In Assets 📈

Hi there, partner 👋

Markets have been brutal lately, especially for quality investors. Tech has sold off. Software has completely collapsed. And a handful of businesses with real moats, cash flows and compounding opportunities, are trading at multi-year low levels.

That’s what we’re digging into today.

These are not businesses that are deteriorating, it is a list of quality names where the fundamentals are still intact, facing sentiment-driven price reductions. The valuation levels has reached levels where long-term investors are likely to be rewarded.

Let’s take a look at the 5 undervalued companies in question 👇

Subscribe now


1. 🧩 Topicus.com $TOI.V

Price: ~CAD $99.60 | Down ~48.8% since July 2025

The business

Topicus is the European arm of the Constellation Software empire. A serial acquirer of niche vertical market software businesses in the Netherlands and broader Europe.

It operates the same playbook as its parent: find small, mission-critical software companies with sticky recurring revenue, buy them at fair prices, never sell, and let the cash flows compound.

Constellation Software still owns 48% of shares outstanding, which tells you everything you need to know about who’s watching this closely.

Why it’s down

Two things have conspired against Topicus in the past year:

  • A brutal sector-wide selloff in vertical market software driven by AI fears

  • A period of slower organic growth.

The AI risk is real, to some extent. Yes, it is much easier to create the code for services that can replace many of Topicus’ VMS businesses. However, Topicus’ advantage is:

  1. Deep relationships with organizations and government. The name of the game here is trust, reliability, and assurances. And Topicus has built a network of loyal customers that won’t trust anybody to process their data or to create workflows deeply embedded in the corporation.

  2. Data, data, data. It’s all about the data, and Topicus has this in groves. It’s hard to create industry defining services without customer data to improve the product over time.

  3. Switching costs are real. Software is often a really low cost for a corporation. If the migration is a hassle (Which it always is), a company will dread switching software unless they absolutely have to.

AI lowers the barrier to build. It does not lower the barrier to replace. A better product is not enough when the incumbent owns the workflow, the data, and the relationship.

Is Topicus a quality business?

Let’s first look at the growth in the most recent quarters:

  • Revenue per share CAGR: +20.4%

  • Free cash flow per share CAGR: 26.9%

  • Book value per share CAGR: 21.7%

The business is growing rapidly ✅

Return on capital has consistently been in the 15-25% range since 2018:

Gross, operating, and free cash flow margins have been stable:

The company is in solid financial shape:

Valuation

Topicus is is trading at all time low valuation multiple levels.

Right now, the FCF yield is 7.61%, which is really high for a quality business.

Especially with the back drop that the business is not broken, but its cheap because the market doesn’t want to touch software right now.

High quality business, attractive valuation.


2. 🚗 Copart

Price: ~$33.36 | Down ~47.8% since May 2025

The business

Copart is the dominant global marketplace for salvage and used vehicles. It operates a two-sided platform connecting insurance companies (who need to dispose of totaled cars) with buyers (dismantlers, rebuilders, dealers, and exporters).

The business model is extraordinarily capital-efficient once yards are built: network effects, marketplace dynamics, and significant switching costs for insurers who have integrated Copart deeply into their claims workflow.

Why it’s down

Copart’s volumes at key insurance customers declined slightly as the number of uninsured drivers increased following several years of massive insurance premium inflation.

When premiums rise too fast, some drivers drop coverage. Fewer insured drivers means fewer total loss events, which means fewer cars flowing through the auction. Q2 FY2026 revenue fell 3.6% year-over-year to $1.12 billion, with EPS dropping from $0.41 to $0.36.

The market reacted harshly to a business it expects to compound consistently.

The numbers that matter

Copart’s growth has been impressive:

  • Revenue per share CAGR: +12.9%

  • Earnings per share CAGR: 19.1%

  • Free cash flow per share CAGR: 27.4%

Although revenue have slowed down, free cash flow keeps compounding at attractive rates

Copart’s return on capital is unmatched, usually staying well above 25%:

Margins are not only stable, but also expanding over time. This is a sign of a business with a sustainable competitive advantage.

Copart’s moat hasn’t moved an inch, and there is no sign of deterioration.

They have over 200 yards, their own auction technology, and are deeply embedded into the insurance industry claim process (It will take a long time to replicate).

Copart’s balance sheet remains flawless, with a $5.1 billion of net cash position.

While revenue growth has slowed in the last few years, earnings per share and free cash flow continue to grow at attractive rates.

Valuation verdict

At 21x forward earnings for a business with no debt, 34% net margins, $5.1 billion in cash, and a near-monopoly position in vehicle auctions, this is a genuinely attractive entry point.

If you subtract the $5.1 billion from the market cap, you get a forward PE of ~17x.

The FCF yield is also at a multi-year high of 4.79%, not seen since 2017:

Subscribe now

Read more

☐ ☆ ✇ Invest in Quality

My 6-step checklist to build a $100,000+ stock portfolio in 2026 📈

By: Invest In Assets 📈

Hi investor👋

You have already made the most important decision.

You are not here asking whether you should invest. You are ready to get started.

Let’s make a few assumptions:

  • You have ~$10,000 ready to put to work

  • You are willing to add $1,000 every month until you get there.

The only question left is how to do it right.

Let us run the numbers first. Starting with $10,000 and adding $1,000 per month, you need roughly 15% annualised returns to hit $100,000 in around 5 years. That is a real number. Not guaranteed, but absolutely achievable with a disciplined process.

I know because I started my own stock portfolio in 2014 with less than $1000.

Here is exactly how I would approach it if I were starting today.


Step 1: Pick your investing style, learn it deeply, and set your criteria ✅

Before you buy a single share, you need to decide what kind of investor you are going to be. Not what sounds impressive at a dinner party (Like investing in the next big thing). What you will actually stick to when your portfolio is down 50% and every instinct tells you to do something.

There are three realistic options for an individual investor starting where you are.

Quality growth investing. You buy exceptional businesses with durable competitive advantages and high returns on capital, hold them for years, and let compounding do the work. This is my approach. It requires patience and the ability to sit through volatility without panicking.

The investing style has performed well over the long-term and have many psychological advantages that makes investing less stressful (I wrote a book on quality growth investing if you’re curious).

Index investing. You buy a low-cost ETF tracking the S&P 500 or MSCI World, add your $1,000 every month, and accept market returns. This beats most active investors over time. If you are not willing to put in genuine research hours every week, this is the right answer and there is no shame in that.

This strategy has been amazing over the past 10-20 years, but at the current valuation I have strong doubts that you will see the same returns from investing in an index fund as you have in most recent history.

A hybrid approach. You put 60-70% into a core index ETF and deploy the rest into your highest-conviction individual stock ideas. You get a safety net while building real stock-picking skills.

The worst outcome is mixing approaches reactively. Buying index ETFs when you are nervous, switching to individual stocks when you feel confident, and never developing real competence in either.

Pick one. Write down your strategy and allocation, and define your criteria in advance.

There are hundreds of other investing strategies that can work: value investing, micro cap investing, growth investing and so on. Pick what suits your temperament and curiosity the most.

Your buying criteria should answer:

  • What kind of business qualifies?

  • What financial characteristics must it have?

  • What price is too high to pay regardless of quality?

Your selling criteria matter just as much. Write these down before you buy anything. Common and valid reasons to sell:

The original thesis has broken, a clearly better opportunity exists elsewhere, the position has grown so large it creates unacceptable risk, or you simply made a mistake and the business is not what you thought. Price going down is not a selling reason. The business getting worse is.

This is easy in theory, but hard in practice. I’ve had my fair share of mistakes from thesis drift in the past myself.

Having these written before the market turns volatile is what separates investors who build a system around their portfolio and compound over decades, and those who have an occasional good year with inconsistent returns.


Build a Market-Beating Portfolio of Quality Compounders, Now 30% Off

Many world-class compounders are currently trading at multi-year low levels. We do the work to identify the few that truly matter, businesses with durable moats, high returns on capital, and long reinvestment runways.

Inside the Premium service, you get:

  • 📜 A repeatable investing framework you can use to compound effectively

  • 💎 Full access to the Quality Growth portfolio

  • 📈 Clear buy & sell alerts

  • 🌍 Access to the Quality Growth investable universe and watchlist

  • 📚 Deep dives on compounders that focus on the most important factors

Get 30% off before the price hike, and start building a portfolio designed to outperform over the next decade.

Don’t overcomplicate it. Own better businesses. Let time do the work.

Get 30% off forever


Step 2: Learn to identify great businesses✅ (Dont start with valuation)

This is where most new investors go wrong. They open a stock screener, sort by P/E ratio, and ask “is this cheap?” That is the wrong first question.

Quality comes first. Valuation comes later.

A mediocre business at a cheap price is still a mediocre business. An exceptional business at a fair price can compound wealth for decades. The order matters enormously.

So what makes a business genuinely great?

There at Invest in Quality, we look at 6 pillars:

Honest, capable management.

Read five years of annual reports. Do they do what they said they would do? Are they candid about mistakes? Do they own meaningful amounts of stock? Are they buying back shares when the price is cheap or issuing new shares when the price is high? Actions reveal character far more reliably than words.

Here are 5 great founder-led businesses:

Business model

The best businesses don't need to constantly fight for every dollar of revenue. They've built models that are capital light. This means they can grow without endlessly reinvesting heavy amounts back into the business. They often collect recurring revenue from customers who come back year after year. When a business model is also hard to replicate, it becomes a source of durable competitive advantage in itself.

A sustainable competitive advantage.

Something structural that protects those returns from competition over time. The most durable moats are network effects (Mastercard becomes more valuable to cardholders every time a new merchant joins, and more valuable to merchants every time a new cardholder joins), switching costs (once a local government agency runs on one of Constellation Software’s VMS businesses, the cost and risk of switching is enormous and costly), cost advantages at scale, and intangible assets like brand or regulatory licences that take decades to build.

Growth

We’re not chasing hypergrowth stories that depend on a single product or a single market. We want growth that is steady, predictable, and diversified. The kind that shows up reliably in both good years and bad. Organic growth is especially valuable because it signals that customers genuinely want more of what the company offers, not that the business is buying growth through expensive acquisitions. A decade of clear runway ahead means the compounding has plenty of room to run.

Risk factors

Every business carries risk, but not all risks are equal. The businesses we want to own are non-cyclical, or at least less prone to the economic cycle (No business is completely non-cyclical).

These businesses are profitable even through tough periods, which means they don’t need external capital to survive a downturn. And crucially, they operate in industries where regulation is unlikely to suddenly change the rules of the game. We’re looking for businesses that sleep well at night, so you can too.

And, ultimately, we want to look at the valuation:

After all pillars check out, valuation becomes the final question. Notice that it’s the last question, not the first. We’re not looking for a bargain-bin price. We’re looking for a price that makes mathematical sense: one where even if our growth estimates are a little optimistic, the returns will still be solid. A quality business bought at a fair price beats a mediocre business bought at a cheap price almost every time, over the long run.

A simple starting filter:

  • 5 year ROIC of +15%

  • 5 year revenue growth of +10%

  • Stable or expanding operating margin

The list will be short. Everything on it is worth understanding much more deeply.

Get 30% off forever


Step 3: Build a focused portfolio of high-conviction ideas that fit your style ✅

You do not need 30 stocks. You need 10 to 15 businesses you understand so well that you could explain each one without looking anything up. The moat, the growth drivers, the key risks, and why you still own it despite those risks.

With $10,000 to start, I would build positions in 5 to 7 businesses initially and expand toward 10 to 15 as your monthly contributions accumulate. Starting too diversified means your winners cannot meaningfully move the needle, and you never develop genuine depth of knowledge in anything you own.

Concentration is not recklessness. It is conviction. The investors who build serious wealth over time own fewer things, not more. Knowing what you own means you can hold through volatility instead of selling at the exact wrong moment.

A practical structure for your starting position: your top 3 ideas get the most capital, roughly 15-20% each. Your next 4-6 ideas get 5-10% each. Keep a small cash position of 5-10% to deploy when quality businesses go on sale, which they do regularly and for reasons that have nothing to do with the underlying business.

When your $1,000 monthly contribution arrives, direct it toward whichever position currently offers the best combination of conviction and value. Not necessarily the one that has fallen the most. The question is always: where does the next dollar work hardest?

One rule worth writing on a card and keeping at your desk: if you cannot write three paragraphs explaining why you own something without looking anything up, you do not know it well enough to own it. Owning things you do not understand means fear fills the gap that knowledge should occupy. You will sell at exactly the wrong time.


Step 4: Valuation. Is this the right time to buy? ✅

You have identified a great business. Now the question is: at what price does it become a good investment?

Even exceptional businesses can be poor investments if you overpay. A company growing earnings at 15% per year is still a disappointing investment if you paid a price that assumed 25% growth indefinitely. Valuation does not change the quality of the business. It determines the return you will earn from owning it.

My approach is a simple three-scenario framework. I model what I think the business looks like in 5 years under a bear case, a base case, and a bull case. For each scenario I estimate revenue, margins, and earnings. Then I work backwards: what price would I need to pay today to earn a 12-15% annualised return in my base case?

If the current price requires the bull case just to earn a fair return, I wait.

A few practical tools worth learning properly:

Free cash flow yield. Take the free cash flow per share and divide by the stock price. A FCF yield of 4-5% on a high-quality compounder growing at 12-15% is often attractive. A FCF yield of 1-2% on a slower grower usually is not.

Many investors like to compare the free cash flow yield with the risk free rate, which usually means the US 10 year treasury yield (Currently 4.285%). This is the yield you can get risk free. Is the investment worth it with all its inherent risks if you get a FCF yield below this level? That is the game.

Here is Novo Nordisk’s FCF yield, going from an unattractive range of ~1.5%, to 5.5%:

Price-to-earnings relative to growth (PEG ratio). Divide the P/E by the expected earnings growth rate. A PEG below 1 on a quality business is worth looking at seriously. Above 2 requires confidence in the growth trajectory and the sustained quality of the business (ROIC and margins holding up).

5 businesses with a PEG of <1 according to Fiscal.ai:

  • Nvidia

  • Taiwan Semiconductor

  • Samsung Electronics $SSNL.F

  • Eli Lilly

  • Micron Technology

Owner’s earnings yield. Take net income, add back depreciation and amortisation, subtract the maintenance capital expenditure required to sustain the current business. Divide by market cap. This strips out accounting noise and tells you what the business actually earns for owners in cash terms. It is Buffett’s preferred measure and it is worth understanding.

The downside with owner’s earnings is that most companies don’t disclose what capital expenditure it needs to maintain the business, and what is for growth initiatives, so it has an element of subjectivity.

The goal is not to find the perfect entry point. The goal is to avoid paying prices that guarantee disappointment, and to act decisively when high-quality businesses go on sale.

So, to keep things simple:

A business with a FCF yield / Owner’s earnings yield above the risk free rate, and with a PEG close to 1 is very attractive.

Caveat: Many businesses with a PEG close to 1, will have a low FCF yield because it is in a growth phase, investing a lot in growth initiatives through CapEx. This suppresses FCF significantly.


Step 5: Create a real system for buying and selling ✅

The biggest destroyer of long-term returns is not picking the wrong stocks. It is making emotional decisions in the absence of a framework.

You need a written system. Before you deploy any capital, write down the answers to these questions for each position:

  • Why am I buying this business?

  • What would have to be true for this to be a +15% compounded annual growth rate return over 5 years?

  • What are the three biggest risks to the thesis?

  • What specific events or data points would cause me to sell?

  • What is my maximum position size?

When the stock drops 25% in a month and it will, at some point, you do not have to make a decision under pressure. You return to the document and ask: has anything on this list changed? If nothing has changed, hold or add. If something has changed, reassess.

For buying: deploy capital in tranches, not all at once. When a business you want to own reaches a fair price, start a position with 1/3 or 1/4 of your intended allocation. If it continues to fall and the thesis remains intact, add the rest. This removes the paralysis of trying to time a perfect entry.

For selling: set a high bar. Selling because a stock has gone up a lot is one of the most expensive mistakes long-term investors make. The real compounding happens in the later years of ownership. Sell when the thesis breaks, when you find a clearly superior alternative, or when the position has grown so large it creates genuine risk for your overall financial situation.

For example, I sold my Apple position in 2018 because I felt the valuation was stretched:

For your $1,000 monthly contribution: make this decision analytically, not emotionally. Every month, look at your watchlist and your existing positions. Where is the highest-quality business trading at the most attractive price relative to what it is worth? That is where the new capital goes. Some months that is adding to an existing position. Some months it is starting a new one. The decision should always be rational.


Step 6: Track what matters. Build your investor dashboard ✅

Most investors track the wrong thing. They check their portfolio value every day, watch it move up and down, and make themselves anxious and reactive. The daily number is almost entirely noise.

What actually tells you whether you are succeeding is different.

What to track for your portfolio:

Your CAGR since inception, updated monthly. This is the number that tells you whether the strategy is working over time. Short-term performance is almost meaningless on its own.

But even CAGR over a few years can be misleading, it is far better to find a proxy for your portfolio that tells you more about how well the businesses are performing. A proxy that Warren Buffett used when he ran Berkshire was ‘look-through’ earnings. It is simple: The amount of shares you own of a stock multiplied with the earnings per share. Then you get a earnings proxy of what your portfolio is making. This should be tracked over the years to see if it is growing.

If look-through earnings is up 16% CAGR, but stock price is only up 10% CAGR, you can argue that the growth in earnings is more important for long-term returns.

What to track for each business:

This is where most investors stop short, and it is the most important part of the whole process. Build a simple Google Sheets tracker with one row per company. Update it after every quarterly earnings report. You are looking for trends, not perfection.

Here’s what I track:

  • Revenue growth

  • Earnings per share growth

  • Free cash flow per share growth

  • ROIC/ROCE/ROE

  • Gross & operating margins

  • Net debt to free cash flows

  • Interest Coverage

  • Change in shares oustanding

A business where revenue growth is slowing, margins are compressing, and ROIC is declining deserves serious scrutiny even if the stock price has not moved yet. The fundamentals lead the stock price, not the other way around.

The proxy that matters most: for each business you own, identify the one metric that is the clearest signal of whether the thesis is working. For a payments business like Mastercard, it is payment volume growth. For an industrial compounder like CSW Industrials, it is organic revenue growth and EBITDA margin trend. For a software business, it is net revenue retention. Know the proxy. When that number deteriorates, everything else deserves a second look.

What to ignore entirely: daily price movements, macro predictions, whether the market is expensive in aggregate, and what other investors are doing. None of these determine your long-term outcome. The quality of the businesses you own and the price you paid for them does.


How long will it actually take?

Let us run the real numbers on your situation. Starting with $10,000 and adding $1,000 every month.

We have 3 scenarios, index investing at 9%, investing in stocks with a 12% annual return, and Quality Growth investing with a 15% CAGR:

Now, the difference is not huge to get to your first $100k. With a 9% return it takes 5.5 years, 12% return it takes 5.1 years, and 15% it takes 4.7 years.

This is because what you invest every month at this point is more important than getting a few more percentages of return.

The interesting effect happens later in the compounding journey. Just look at the difference after 20 years:

  • 8% CAGR: $727k

  • 12% CAGR: $1.1M

  • 15% CAGR: $1.69M

The real magic of compounding happens in the really long-term.

This is the difference after 30 years:

The first $100,000 is the hardest part. Every month your contributions represent a large share of the total. Once you get there, compounding starts doing more of the work than you do. The journey from $100,000 to $1,000,000 is where the real magic of long-term investing becomes visible.

Remember what Charlie Munger said:

The first $100,000 is the hardest - Charlie Munger

Get 30% off forever

The honest truth about getting there

The checklist is simple. Following it is not.

March 2026 was a brutal month for my portfolio. Everything was down. Many of my holdings saw drops of more than 10%. Nearly every position faced selling pressure.

But I kept buying.

Not because I am reckless or indifferent to losses. Because I know what I own, I know why I owned it, and I know exactly what would actually make me sell a position. The prices told me the market was anxious. The businesses fundamentals told me nothing had changed except the markets emotional state.

This is the game of investing.

Build the system before you need it. Follow it when it is uncomfortable. Let compounding do the rest.

The $100,000 is not the destination. It is where the real ‘joys of compounding’ journey begins.


Ready to take the next step? Here’s how I can help you grow your investing journey:

  1. Go Premium — Unlock exclusive content and follow our market-beating Quality Growth portfolio. Learn more here.

  2. Essentials of Quality Growth — Join over 300 investors who have built winning portfolios with this step-by-step guide to identifying top-quality compounders. Get the guide.

  3. Free Valuation Cheat Sheet — Discover a simple, reliable way to value businesses and set your margin of safety. Download now.

  4. Free Guide: How to Identify a Compounder — Learn the key traits of companies worth holding for the long term. Access it here.

  5. Free Guide: How to Analyze Financial Statements — Master reading balance sheets, income statements, and cash flows. Start learning.

  6. Get Featured — Promote yourself to over 24,000 active stock market investors with a 42% open rate. Reach out: investinassets20@gmail.com

☐ ☆ ✇ Invest in Quality

What actually makes a business compound at 20%+ per year 🏰

By: Invest In Assets 📈

Hi there, investor 👋

Today, we’re breaking down the 5 traits that separate 20% compounders from ‘good’ companies.

Most investors know the basics by now.

  • High ROIC & ROIIC

  • Long reinvestment runway

  • Capital-light model

These are the entry requirements, the minimum spec for a quality growth business.

But they do not explain why some compounders deliver 12% annually and others deliver 20%.

The gap between good and exceptional is not ROIC. It is five things that are harder to see in a spreadsheet.

Let’s get into it 👇

Build a Market-Beating Portfolio of Quality Compounders, Now 30% Off

Many world-class compounders are currently trading at multi-year low levels. We do the work to identify the few that truly matter, businesses with durable moats, high returns on capital, and long reinvestment runways.

Inside the Premium service, you get:

  • 💎 A focused portfolio of high-quality businesses

  • 📈Clear buy & sell alerts

  • 📚 Deep dives that actually explain why something works

  • 📜 A repeatable framework you can use for life

Get 30% off before the price hike, and start building a portfolio designed to outperform over the next decade.

Don’t overcomplicate it. Own better businesses. Let time do the work.

Get 30% off forever


1. Pricing power that nobody talks about: the annual price letter

The companies that compound at 20% do not just have pricing power. They exercise it systematically, every single year, without losing customers.

Most businesses raise prices occasionally. The great compounders raise prices as a matter of policy. FICO charges mortgage lenders a fee every time they pull a credit score. That fee has gone from a few dollars to over $10 in recent years, with essentially no pushback, because there is no alternative. The product is mandated by the lending process. Customers do not like the increases. They pay them anyway:

Brunello Cucinelli does the same thing at the other end of the market. The company raises prices 8 to 10% every year on cashmere goods that sell to ultra-high-net-worth buyers.

The price increases do not suppress demand. In some cases they stimulate it, because the customer base associates higher prices with greater exclusivity. The brand is the moat. The annual price increase is how the moat earns.

Brunello Cucinelli Acquires 43% Stake in Italian Cashmere Supplier | BoF

What to look for: a business where customers complain about price increases in earnings calls, analyst reports, or customer reviews, and then renew anyway. That is the signal. Annoyance without churn is pricing power (Even better if you don’t hear anything, like for Brunello customers).


2. The niche monopoly in a market nobody else wants

The most durable compounders do not dominate large, glamorous markets. They dominate small, boring ones that nobody else bothered to enter.

Judges Scientific is a collection of 30 scientific instrument companies making products like vacuum gauges, cryogenic equipment, and electron microscopes. Each subsidiary is the market leader in its niche.

The niches are so small that a competitor entering one would face years of development cost to capture a market worth a few million pounds. The economics of competition do not work. So nobody competes. This has allowed Judges to compound its free cash flow per share by +15% annually over the last decade:

CSW Industrials makes products like HVAC dampers, plumbing solutions, and industrial sealants. Not exciting. But in the specific segments it occupies, it has dominant market share, 45% gross margins, and a customer base that has been buying from it for decades.

Switching costs are not contractual. They are practical. Nobody on a job site wants to re-specify a component that has worked fine for twenty years.

The result? +30.7% annual growth in free cash flow per share since 2014:

The pattern is the same across the best compounders: dominant position in a market too small to attract serious competition, with switching costs that make the dominant position self-reinforcing.

Rightmove has 80% of UK property listings. A competing portal would need to convince buyers and sellers to switch simultaneously. Neither will until the other does first. The niche locks in.

What to look for: operating margins that seem too high for the industry, combined with revenue that is almost entirely from repeat customers. That combination only exists when competition is structurally absent.

Get 30% off forever


3. The decentralised operator model as the actual moat

Some businesses have a moat because of what they sell. The best serial acquirers have a moat because of how they are organised.

Lifco has 275 subsidiaries across dental equipment, demolition tools, and document management.

The businesses have almost nothing in common except one thing: they are all run by the people who built them, with their own P&Ls, their own hiring decisions, and their own capital within defined limits.

Head office in Stockholm has fewer than 20 people. The subsidiaries do not feel like subsidiaries. They feel like owner-operated businesses, because they are.

This structure produces two advantages that do not show up in any single year’s numbers.

First, it retains entrepreneurial talent. Founders who sell to Lifco stay. They keep equity-like incentives and operational independence. The alternative is selling to a private equity firm and being managed to a budget. Lifco wins that decision most of the time.

Second, the model scales without diluting returns. Each new acquisition is independent. There is no integration cost, no cultural homogenisation, no bureaucratic drag. The 275th acquisition is as clean as the first.

Addtech, Diploma, and Kelly Partners Group run versions of the same model. REQ Capital’s research on Nordic serial acquirers found that decentralisation was one of the three primary drivers of their 19% 20-year CAGR, alongside capital allocation discipline and owner-operator culture.

What to look for: subsidiary managers who have been with the business for ten or more years after acquisition, low head office headcount relative to group revenue, and management commentary that describes acquired founders as partners rather than employees.


4. The capital allocator who gets better with age

In most industries, competitive advantage erodes over time. In programmatic acquisition, it compounds.

The best capital allocators, Mark Leonard at Constellation Software, Carl Bennet at Lifco, Brett Kelly at Kelly Partners, get measurably better at buying businesses as the years go on. They build proprietary deal flow. They develop pattern recognition for which businesses will integrate well and which will not. They build reputations in their target sectors as the preferred buyer, which means they see more deals at better prices than anyone else.

Constellation Software has acquired over 800 vertical market software businesses. The institutional knowledge from those 800 acquisitions, what to pay, what to fix, what to leave alone, is not replicable. A new entrant trying to compete in VMS acquisition starts with zero. Constellation starts with three decades of accumulated judgment. That gap widens every year.

The proof is in the pudding, just look at how Constellation stack up versus other serial acquirers. Usually, you see a correlation between how large the acquisition spend is, and the return the acquirer will get on their capital spent.

However, for Constellation, it has managed to keep a best in class ROIC + 1/2 organic growth rate despite its size.

Studying Serial Acquirers - by KSP - Exploring Context

This is what makes the ROIIC story so important for serial acquirers specifically. The question is not just what returns they earn on new capital today. It is whether the returns on new capital are stable or improving as the business matures. For the best operators, the answer is improving, or at least maintaining despite larger acquisition spending.

What to look for: acquisition multiples that have remained consistent over a decade despite a competitive deal market, suggesting proprietary sourcing rather than auction participation. Also: founders who reinvest proceeds into the acquirer’s stock after selling their business. That is the clearest possible signal of trust in the capital allocator.


5. The business that gets harder to kill every year

The final trait is the one that most distinguishes a 20% compounder from a 12% one over a full decade. The business becomes more defensible every year it operates.

This is different from a business that just survives. A company can have stable revenues for twenty years without becoming harder to displace. What the great compounders build is a system where every new customer, every new product, every new acquisition makes the existing base more valuable and the switching cost higher.

Mastercard is the clearest example at scale. Every merchant that accepts Mastercard increases the value of the network to every cardholder. Every cardholder that carries a Mastercard increases the value of acceptance to every merchant.

The network has been growing for sixty years and the flywheel has not slowed. Adding the 100 millionth merchant does not cost Mastercard anything. It makes the network worth more to everyone already on it.

Mastercard is one of the most consistant compounders with an annual free cash flow per share growth of 15.7% since 2013:

Topicus does this in European vertical market software. Each new VMS acquisition adds another sector to the platform. That makes Topicus a more credible acquirer for the next sector because it can demonstrate operational success in adjacent ones. The track record is the moat. The moat is built by the acquisitions. The acquisitions are made possible by the moat.

What to look for: net revenue retention above 100% in software businesses, meaning existing customers spend more each year without the company doing anything. In non-software businesses, look for revenue per customer that grows consistently year over year, not from upselling campaigns but from natural usage expansion.


Putting it together

The ROIC framework tells you whether a business is good. These five traits tell you whether it is exceptional.

  • Pricing power that is exercised annually without churn

  • A niche so small that competition is irrational

  • A decentralised model that scales without losing what made it work

  • A capital allocator whose judgment compounds alongside the business

  • And a flywheel that gets harder to stop every year it runs

When you find all five, the valuation question almost takes care of itself. A business with a 20% earnings CAGR and these structural characteristics will look expensive every year and cheap in hindsight every decade. That is the nature of compounding. The market prices the next twelve months. You are buying the next ten to twenty years.

Get 30% off forever

That’s it for this time, let me know what you think in the comments below or by replying to this email!

Ready to take the next step? Here’s how I can help you grow your investing journey:

  1. Go Premium — Unlock exclusive content and follow our market-beating Quality Growth portfolio. Learn more here.

  2. Essentials of Quality Growth — Join over 300 investors who have built winning portfolios with this step-by-step guide to identifying top-quality compounders. Get the guide.

  3. Free Valuation Cheat Sheet — Discover a simple, reliable way to value businesses and set your margin of safety. Download now.

  4. Free Guide: How to Identify a Compounder — Learn the key traits of companies worth holding for the long term. Access it here.

  5. Free Guide: How to Analyze Financial Statements — Master reading balance sheets, income statements, and cash flows. Start learning.

  6. Get Featured — Promote yourself to over 24,000 active stock market investors with a 42% open rate. Reach out: investinassets20@gmail.com

Disclaimer:

This newsletter is for informational purposes only and does not constitute financial, investment, or other professional advice. The views expressed are solely the author’s opinions and may change without notice.

Investing in securities involves risk, including the potential loss of capital. Past performance is not indicative of future results.

The author may hold positions in securities mentioned. Readers should do their own research and consult a licensed financial advisor before making investment decisions.

☐ ☆ ✇ Invest in Quality

Factsheet March 2026 📈

By: Invest In Assets 📈

Factsheet March 2026 📈

The QG portfolio focuses on owning high-quality businesses bought at attractive prices.

High quality means profitable growth, high and consistent returns on capital, reinvestment opportunities for excess capital, and strong margins that convert most earnings into cash.

Attractive prices mean we can expect roughly +12% annual return …

Read more

☐ ☆ ✇ Invest in Quality

5 Quality Businesses March 💎

By: Invest In Assets 📈

Hi partner! 👋🏻

Welcome to the March edition of Top 5 Buys ✅

In this article, we will discuss our top stock picks for March 2026.

Let’s get into it 👇


The Market Sentiment: Extreme Fear

March 2026 has been one of the most turbulent months in recent memory. The market is volatile as a result of:

  • A US-Israeli military strike on Iran → sending oil prices surging above $100

  • Trump’s 15% global tariff regime → with consumers and businesses absorbing most of the cost

  • Inflation refusing to cooperate → PCE at 2.9%, the Fed stuck between a rock and a hard place

  • A slowing economy → the weakest job growth outside of the pandemic since 2009

Investors are responding with extreme fear. The Fear & Greed Index currently sits at 21, deep in Extreme Fear territory.

The crazy part?

Despite elevated volatility drifting toward 19-20%, the S&P 500 year-to-date returns remain near flat, only down -1.63% YTD (Still close to all time high levels).

This is because the largest companies are holding up. Nvidia just unveiled its Vera Rubin platform at GTC 2026. Microsoft, Alphabet and the mega-caps are absorbing the uncertainty better than most.

Growth and SaaS stocks have not been so fortunate. The combination of tariff fears, geopolitical chaos and the agentic AI narrative continuing to pressure software multiples has hit many former darlings hard. The entire SaaS category is trading at its lowest forward EV/Sales in recent times:

Image
Source: X @SergeyCYW

Predicting the future is impossible. But we can point to 5 quality growth companies likely to keep compounding, regardless of tariffs, oil prices, or whatever headline drops next week.

Disclaimer:

The author may hold positions in securities mentioned. Readers should do their own research and consult a licensed financial advisor before making investment decisions.

Here are this month’s Top 5 👇

Subscribe now


1. Mastercard

The business model

Mastercard is a global payments network sitting between cardholders, banks, and merchants, processing transactions across more than 150 currencies in virtually every country on earth.

Critically, it takes on zero credit risk. It earns a small toll on every transaction that crosses its rails and moves on.

In the last twelve months, Mastercard generated $32.8 billion in revenue and nearly $15 billion in net profit, running a 60% operating margin and a 45% net margin.

The business model requires almost no capital to grow, with free cash flow of $17.2 billion against capex of just $489 million. With over 3 billion cards tied to a two-sided network connecting 25,000+ financial institutions, the competitive position is structural. The more issuers and merchants on the network, the more valuable it becomes for everyone else.

Growth drivers

The long-term thesis rests on one durable shift: the global migration of payments from cash to digital.

Most consumer transactions worldwide are still made in cash, particularly in emerging markets where Mastercard is actively expanding.

On top of that secular tailwind sit cross-border transactions, a high-margin segment that grows with international travel and e-commerce, and value-added services including fraud analytics, data insights, and cybersecurity.

All of these are growing faster than core and carry higher margins. Q4 2025 net revenue grew 15% to $8.8 billion, EPS grew 20%, and management guided for high-end low-double-digit currency-neutral growth in 2026.

The last 5 years of growth for Mastercard have been significant, growing revenue per share by 17.4%, EPS by 17.2%, and FCF per share by 20% CAGR with expanding Return on Invested Capital:

The buyback engine adds a further mechanical tailwind: Mastercard repurchased $3.6 billion of stock in Q4 alone, consistently compounding EPS ahead of revenue growth.

Valuation

Mastercard trades at a forward PE of around 25x, close to its 10 year low of 22.3x. The forward P/FCF is currently 24.5x, also well below its 10 year median multiple:

For a business compounding EPS in the high teens, a multiple of ~25x is arguably the most attractive entry point relative to its own history in years.

The analyst consensus target is $658, implying roughly 19% upside with a strong buy rating. The risk is macro, not structural. A slowdown in consumer spending or a regulatory intervention on interchange fees could temporarily compress volumes. For a long-duration compounder of this quality, the current price looks like a reasonable entry.


2. Lifco AB $LIFCO-B

The business model

Lifco is Sweden’s best-kept secret in quality investing. Built on the same decentralised serial acquirer model that made Constellation Software legendary, it owns 275 operating companies across 37 countries, organised into three divisions: Dental, Demolition & Tools, and Systems Solutions.

The primary business segment has compounded EBITDA by 8.2%, 17.5%, and 24.5% respectively, with organic growth ranging from -5.8% to +15.3% in the period:

The businesses Lifco owns are deliberately unglamorous: dental consumables, hydraulic demolition attachments, contract manufacturing.

That is precisely the point. Boring businesses in niche markets carry pricing power, low capital intensity, and minimal disruption risk. From 2015 to 2025, Lifco delivered an EBITDA CAGR of 18% and an EPS CAGR of 16%.

What drives growth from here

Acquisitions are the engine.

In 2025, Lifco completed 16 deals adding approximately SEK 2.2 billion in annualised net sales, while free cash flow per share has compounded at 18.2% annually since 2019.

The company targets founder-owned businesses in fragmented markets with few credible buyers, acquiring at sensible multiples and adding operational stability and efficiency.

The pipeline is structurally full. Thousands of private niche businesses across Europe and Globally will eventually need a buyer, and Lifco is patient, well-capitalised, and known as a permanent home.

Valuation

At roughly SEK127 billion market cap, Lifco trades at a premium to European industrial peers, warranted given the consistency of its compounding and the capital-light nature of its portfolio.

The stock has contracted by -33.8% since its July 2025 highs, offering a rare chance to enter a proven compounder at a forward PE of 28.1x or a fwd. FCF yield of 3.85%.


Top 3 is for Premium subscribers only. Join us today:

Build a Market-Beating Portfolio of Quality Compounders, Now 30% Off

Many world-class compounders are currently trading at multi-year low levels. We do the work to identify the few that truly matter, businesses with durable moats, high returns on capital, and long reinvestment runways.

Inside the Premium service, you get:

  • 💎 A focused portfolio of high-quality businesses

  • 📈Clear buy & sell alerts

  • 📚 Deep dives that actually explain why something works

  • 📜 A repeatable framework you can use for life

Get 30% off before the price hike, and start building a portfolio designed to outperform over the next decade.

Don’t overcomplicate it. Own better businesses. Let time do the work.

Get 30% off forever

Read more

☐ ☆ ✇ Invest in Quality

Buying a Quality Compounder at a discount 💎

By: Invest In Assets 📈

Hi there, partner 👋

Markets don’t often give you second chances on great businesses.

When they do, you don’t hesitate to act.

Over the past few weeks, volatility has picked up again. Some of the highest-quality companies in the world have quietly pulled back, not because the long-term story changed, but because short-term sentiment did.

That’s where the opportunity is.

Because if you’re trying to build a market-beating portfolio, the game isn’t about reacting to headlines.

It’s about owning:

  • Businesses with durable competitive advantages

  • High returns on capital

  • Long reinvestment runways

  • And management teams that actually know how to allocate capital

Those are the companies that compound for a decade.

Right now, one of these businesses has drifted into a range we simply don’t see very often.

Fundamentally, nothing is broken.

In fact, the fundamentals are arguably stronger than ever:

  • Revenue growth is accelerating (+44.6% YoY)

  • Customers continue to grow in numbers and spend

  • Profits have exploded in recent time

  • And the company is still early in penetrating a massive market

But the stock is down 37.6% from its all time highs.

Buy When There is Blood in the Streets

And that disconnect is exactly what we, as long-term investors look for.

This is not a turnaround, this is a dominant platform business operating in one of the fastest growing markets globally with decades of compounding ahead.

The kind of business you want to own more of when it gets cheaper.

That’s exactly what I’ve done.

Let’s get into it 👇

Get 30% off forever

Read more

☐ ☆ ✇ Invest in Quality

Uber's Rise From Ride-Hailing to a Global Tech Giant

By: Invest In Assets 📈

Hi there investor 👋

Today we’re breaking down Uber Technologies 👇

Subscribe now


The Rise of Uber Technologies

For much of the past decade, Uber was widely viewed as the most controversial company in Silicon Valley. The business burned tens of billions of dollars, fought regulators around the world, and struggled to convince investors that its model could ever produce sustainable profits. Critics often reduced the company to a simple question:

Is this really anything more than a taxi company with an app?

That narrative has slowly started to change. Over the past several years, Uber has transitioned from a high-growth, cash-burning startup into a large-scale global marketplace that generates significant free cash flow. In 2025 the company produced over $9.7 billion in free cash flow as the platform continued to scale and improve its efficiency.

Today, the investment debate around Uber is very different than it was just a few years ago. The key question is no longer whether the company can survive. Instead, investors are beginning to ask whether Uber could become a durable long-term compounder built on a global logistics marketplace.


Join the Premium Research

Free subscribers get occasional articles.

Premium Members get the full investing framework.

Including:

  • 💎 Full Portfolio Access (80% of my net worth invested alongside members)

  • 📢 Real-Time Buy & Sell Alerts

  • 📊 Monthly Portfolio Factsheets

  • 🏰 Quality Deep Dives

  • 📘 Complete Research Archive

Everything is built around one goal:

Identifying businesses capable of compounding capital for decades.

Become a Premium Member👇

Subscribe now

Note: The price will increase 50% on April 1st.


Understanding What Uber Is

To understand the investment case, it helps to step back and think about what Uber actually does. On the surface, the company offers ride-hailing and food delivery services, but those products are only the visible layer of the business. Fundamentally, Uber is a platform that coordinates supply and demand across large transportation networks.

The platform connects three key groups: riders, drivers, and merchants. Through its marketplace algorithms, Uber continuously balances these groups by adjusting prices, optimizing routes, and matching supply with demand in real time. This system now operates across more than 70 countries and roughly 10,000 cities, making Uber one of the largest mobility platforms in the world.

The scale of the network is significant. In 2025, Uber had $193 billion in Gross Bookings across its platform and completed more than 13 billion trips annually. That level of transaction volume gives Uber a massive dataset on traffic patterns, rider behavior, delivery logistics, and urban mobility, which improves the efficiency of the marketplace over time.


A Platform Built Around Two Core Businesses

Uber’s business today revolves around two major segments: Mobility and Delivery. Mobility refers to the traditional ride-hailing service that connects riders and drivers, while Delivery includes food, grocery, and retail deliveries through Uber Eats. Both segments operate on the same underlying infrastructure, allowing Uber to leverage its driver network and logistics software across multiple services.

Mobility remains the company’s most profitable business. In 2025, Uber’s mobility segment generated an adjusted EBITDA of $7.9 billion, exceeding delivery’s adjusted EBITDA of $3.5 billion. This is largely because rides require less coordination than restaurant logistics and involve fewer middlemen. However, delivery has grown rapidly and now represents a massive marketplace in its own right, with tens of billions of dollars in annual bookings.

Uber also reports a smaller category called “All Other Adjusted EBITDA,” which includes businesses outside its core Mobility and Delivery segments. This category primarily contains Uber Freight, advertising, and newer platform initiatives that are still scaling. Because these businesses require ongoing investment, the segment has historically produced negative EBITDA. However, some of these initiatives could become meaningful profit contributors as Uber’s platform continues to mature.

The key strategic insight is that these businesses reinforce one another. Drivers can switch between delivering food and transporting passengers depending on demand conditions, which increases utilization and reduces idle time. At the same time, consumers who already have the Uber app installed are far more likely to use Uber Eats, lowering customer acquisition costs across the platform.


The Product Innovation That Created a Marketplace

From a product perspective, Uber’s breakthrough was incredibly simple. Before Uber existed, urban transportation systems were often fragmented and inefficient, with riders struggling to find available taxis and drivers wasting time waiting for passengers. Uber introduced a real-time marketplace that instantly matched drivers and riders through a smartphone app.

Three innovations were particularly important. First, the platform enabled riders to instantly discover available drivers, allowing riders to see nearby drivers in real time. Second, Uber introduced dynamic pricing, which adjusts fares based on demand and helps balance the marketplace during peak periods. Third, the company removed friction from payments by integrating automated billing directly into the app.

Uber Launches Comfort Electric Ride-Hailing Tier, EV Tools for Drivers -  CNET

Together, these features created a transportation marketplace that was far more efficient than traditional taxi systems. Waiting times fell dramatically, driver utilization increased, and riders gained a predictable and transparent experience. These improvements helped Uber achieve global product-market fit remarkably quickly, turning the service into a daily habit for millions of users.


Why Marketplace Network Density Matters

The economics of Uber’s platform improve as the network becomes denser. In large cities with many riders and drivers, the system becomes significantly more efficient because the distance between supply and demand decreases. This reduces pickup times for riders and increases utilization rates for drivers.

Marketplace density also improves Uber’s margins. When drivers spend less time waiting for rides or deliveries, they can complete more trips per hour. That increases driver earnings without necessarily raising prices for consumers, which makes the platform more attractive to both sides of the marketplace.

This dynamic creates a powerful feedback loop. Faster pickup times attract more riders, which increases demand for drivers. More drivers then reduce wait times further, reinforcing the cycle. Over time, this type of network density advantage can become a meaningful competitive moat, and this effect is often referred to as “Uber’s Virtuous Cycle”:

Uber's Flywheel It's based on the two values that drive ride-sharing: 1.  Faster pickups: More geo coverage → Faster pickups → More demand → More  drivers → More geo coverage 2.

The Transition to Profitability

For most of its early history, Uber prioritized growth over profitability. The company spent aggressively on driver incentives and rider discounts in order to build scale and outcompete regional rivals. While this strategy succeeded in establishing a global presence, it also resulted in significant financial losses.

The turning point came after Dara Khosrowshahi became CEO in 2017. Under his leadership, Uber shifted its focus toward operational discipline and sustainable profitability. The company exited several unprofitable markets, sold stakes in regional competitors like Didi and Grab, and began improving its unit economics across both mobility and delivery.

These changes gradually transformed the company’s financial profile. By 2023 and 2024, Uber had reached a point where operating leverage began to show clearly in the numbers. Revenue continued to grow, but costs grew more slowly, allowing free cash flow to expand meaningfully.


Advertising: A High-Margin Opportunity

One of the most interesting developments within Uber is the emergence of its advertising platform. Because millions of users open the Uber or Uber Eats app when they are ready to make a purchase, the platform captures extremely valuable commercial intent data. Restaurants and brands are increasingly willing to pay for placement within the app to capture that demand.

Uber's new in-app Journey Ads to target users based on where they're going,  previous orders | Mi3

Uber’s advertising platform has grown remarkably quickly in just a few years. By May 2025, the business reached an annual revenue of $1.5 billion, growing roughly 60% YoY, making it one of the fastest-growing advertisement businesses globally. The rapid scaling reflects how valuable Uber’s ecosystem has become for brands looking to reach consumers at moments of real purchase intent.

Why Uber’s Data Is So Valuable

Uber’s biggest advantage in advertising comes from the data generated by its platform. The company facilitates more than 13.2 billion trips every year and serves over 180 million monthly users, creating a massive dataset about real-world consumer behavior.

“What is so appealing about Uber being in [40-plus countries] and serving over 180 million users is that this data set gives you the soul of the consumer,”

— Edwin Wong, Uber’s head of measurement sciences

Unlike many digital advertising platforms, Uber’s data reflects what people are actually doing in the physical world. The platform knows where users are traveling, what they are ordering, and when they are most likely to make purchases. That makes it possible for brands to place ads in highly relevant moments. For example promoting food offers during a commute home or travel products after a long flight.

New Ad Formats and What Comes Next

Uber is now expanding beyond simple sponsored listings into new ad formats. The company has installed around 50,000 tablets in vehicles, allowing brands to run video ads and content during rides.

Edwin Wong says these ads perform 11% than online video, in attention and post-checkout ad formats score 40%.

A study from Lumen found that Uber ads generate 6.6 times higher attention than online video, social, and mobile display.

Uber continues to expand these formats and build partnerships with platforms like OpenAI and OpenTable. Advertising could become one of the high-margin business segments inside the Uber ecosystem.


The Autonomous Vehicle Debate

Can you really write about Uber without mentioning autonomous driving?

Some investors believe that self-driving vehicles could eventually eliminate Uber’s role by replacing human drivers with robotaxi fleets. However, this view may underestimate the value of Uber’s marketplace and consumer habits.

Even in a world with autonomous vehicles, someone must coordinate the system. Riders still need a platform that handles pricing, routing, payments, and demand across cities. Uber already performs these functions at a massive scale, making it a natural coordination layer for autonomous fleets.

Autonomous technology is maturing, and Uber will likly transition from managing human drivers to managing fleets of self-driving vehicles.

Uber is already testing AV in Atlanta and Austin, and are seeing significant results compared to the top 20 cities in the US (Gray line).

The data Uber has collects suggest that AVs are getting ~30% more trips in per day (Huge utilization boost), and are ~25% faster (Happier customers).

Many are viewing AV as a threat to Uber’s business model, but the data suggests that AV advancements will make Uber I) grow faster, II) get better utilization from their drivers, and III) get happier customers due to more efficient rides.

Uber does not need AV to be a profitable business, but it can take it to the next level, making the already capital-light company drop it’s operational expenses even lower.

The AV market is set to grow at a CAGR of 34.5% to +$3 trillion in 2033. Uber is well-positioned to take a piece of that market.

Autonomous Vehicles Market Size, Share | CAGR of 34.5%

Valuation: Is Uber undervalued?

Uber’s long-term valuation depends on two things:

  • How fast the platform continues to grow

  • How profitable the marketplace becomes as it scales

In a bear case, growth slows as ride-hailing and delivery mature and competition limits pricing power. Revenue grow ~5% annually, EBITDA margins stabilize around 15%, and free cash flow grows roughly 5% per year, which could justify a 12x FCF multiple in ten years.

In a base case, Uber keeps executing well across Mobility and Delivery while advertising becomes a meaningful profit driver. Revenue grows around 10–12% annually, EBITDA margins expand toward 25%, and free cash flow compounds at roughly 15–18% per year as operating leverage improves. In that scenario, a scaled but still growing platform could trade around 18–20x free cash flow.

The bull case assumes Uber fully leverages its global marketplace. Advertising becomes a large high-margin business, the network becomes more efficient, and new opportunities such as autonomous fleets or logistics expand the platform. Revenue could grow 15%+ annually, EBITDA margins approach 30%, and free cash flow compounds +20%+ per year, potentially supporting a 25x+ multiple for a highly cash-generative global platform.

The TTM free cash flow per share is $4.6, but if we exclude stock based compensation, we arrive at $3.84. I like to exclude SBC because it is a real cost for investors, as you get diluted over time.

The discounted cash flow analysis:

  • Fair value estimate: $149,69

  • Current share price: $73.35

  • Upside: +104%

  • Expected CAGR from base case: +20%

The large difference between our fair value estimate and the current share price tells us that the market is pricing in a lot of pessimism and risks.

Competition is one factor, AI is another, and many are looking at AVs as the bear case and risk factor for Uber.

For Uber to not provide a solid return over the next 5 to 10 years, the business must really fall apart, only growing its free cash flows at 4-6% annually, and trading at a 12x multiple.

In other words, the market is pricing in that Uber will get distrupted, most likely from automonous vehicles.

If you believe in the base or bull case for Uber, the valuation looks very attractive at its current levels.

The last few months of free cash flow growth has been stunning, and is coming from a significant increase in the net cash from operating activities, with a free cash flow conversion rate of >100%:


Risks Investors Should Consider

Despite its progress, Uber still faces several risks. Regulatory scrutiny remains one of the most important factors, particularly regarding the classification of drivers as independent contractors rather than employees. Changes in labor laws could increase operating costs in some markets.

Competition is another factor to watch, particularly in the food delivery segment. Companies such as DoorDash continue to compete aggressively for market share in the United States, while regional competitors remain strong in some international markets. These dynamics can pressure margins and limit pricing power.

Finally, the company’s demand is somewhat cyclical. Economic downturns can reduce discretionary spending on rides and restaurant delivery, which could temporarily slow growth. However, Uber’s global scale and diversified services help mitigate some of these risks.


The Long-Term Investment Question

Uber today is a fundamentally different company than it was five years ago. The platform has reached global scale, the marketplace economics are improving, and the business is generating significant free cash flow. This suggests that the company is maturing and settling in as a quality market leader.

At the same time, the long-term opportunity may still be larger than many investors realize. Urban mobility, food delivery, local commerce, and logistics represent enormous markets that continue to shift toward digital platforms. Uber’s position at the center of these ecosystems gives it a strong foundation for long-term growth.

The proven effectiveness of Uber’s advertisement business and its distribution and data makes it appealing as a possible growth driver in the coming years. Additionally, advancements in autonomous vehicles is more likely to be a growth driver and profit enhancer for Uber, than an existential threat.

Uber has done a fantastic job of expanding its network, improving its unit economics, and building new monetization layers like advertisiting. If the business continue to hold its position as a market leader, with the best distribution, data, and infrasctructure in mobility, the business may have far more compounding potential than the market once believed.


Join the Premium Research

Free subscribers get occasional articles.

Premium Members get the full investing framework.

Including:

  • 💎 Full Portfolio Access (80% of my net worth invested alongside members)

  • 📢 Real-Time Buy & Sell Alerts

  • 📊 Monthly Portfolio Factsheets

  • 🏰 Quality Deep Dives

  • 📘 Complete Research Archive

Everything is built around one goal:

Identifying businesses capable of compounding capital for decades.

Become a Premium Member👇

Subscribe now

Note: The price will increase 50% on April 1st.


Ready to take the next step? Here’s how I can help you grow your investing journey:

  1. Go Premium — Unlock exclusive content and follow our market-beating Quality Growth portfolio. Learn more here.

  2. Essentials of Quality Growth — Join over 300 investors who have built winning portfolios with this step-by-step guide to identifying top-quality compounders. Get the guide.

  3. Free Valuation Cheat Sheet — Discover a simple, reliable way to value businesses and set your margin of safety. Download now.

  4. Free Guide: How to Identify a Compounder — Learn the key traits of companies worth holding for the long term. Access it here.

  5. Free Guide: How to Analyze Financial Statements — Master reading balance sheets, income statements, and cash flows. Start learning.

  6. Get Featured — Promote yourself to over 24,000 active stock market investors with a 45% open rate. Reach out: investinassets20@gmail.com

☐ ☆ ✇ Invest in Quality

🏰Quality Growth Portfolio: February Factsheet

By: Invest In Assets 📈

Factsheet February 2026 📈

The QG portfolio focuses on owning high-quality businesses bought at attractive prices.

High quality means profitable growth, high and consistent returns on capital, reinvestment opportunities for excess capital, and strong margins that convert most earnings into cash.

Attractive prices mean we can expect roughly +12% annual retu…

Read more

☐ ☆ ✇ Invest in Quality

Terry Smith on Quality Investing 💎

By: Invest In Assets 📈

Hi there, investor!

In this article, we’ll discuss a recent interview with Terry Smith, the legendary investor behind Fundsmith.

Smith has beaten the index for decades, but he has faced headwinds in recent years, as Quality investing is experiencing its worst period since the dot-com bubble.

Fundsmith has delivered an annual return of 13.6% since its inception in 2010, compared to 12.1% for the MSCI World Index.

However, the fund has underperformed the index for several years now. In the interview, Smith emphasizes the importance of patience and long-term thinking.

If you’d like to watch the full interview, you can find it here:

Let’s go through the key points 👇

Subscribe now


FCF Yield + Growth = Long-Term Compounding

Smith argues that one of the simplest ways to estimate a company’s future shareholder return is to take its free cash flow yield and add the expected growth rate.

For example, Visa has an FCF yield of around 4% and an estimated future EPS growth rate of 12.9%. Based on Smith’s framework, this would imply a potential long-term return of approximately 16.9%.

Smith doesn’t elaborate in detail on why he prefers free cash flow, but other investors often use earnings yield (the inverse of the P/E ratio) plus dividend yield and growth estimates. That approach can also work.

However, Smith always follows the cash.

He focuses on a company’s ability to convert accounting earnings into real cash, and he is mindful of the accounting techniques that can distort reported earnings.

Free cash flow is harder to manipulate. It is calculated as cash flow from operations (CFFO) minus capital expenditures (CapEx). The logic is simple: operating cash flow reflects the true cash generation of the business, while CapEx represents the capital required to sustain operations.

In many cases, CapEx can be divided into maintenance and growth investments. Some investors attempt to adjust for this by excluding “growth CapEx,” but Smith prefers to keep the calculation straightforward. Growth investments are typically already reflected in the company’s expected growth rate.

FCF yield plus expected future growth provides a practical and effective way to think about long-term returns.


The Man in the Arena

Terry Smith is clearly inspired by Theodore Roosevelt’s famous “Man in the Arena” speech.

He often references it when discussing his success.

Smith speaks about courage — about making decisions that may expose you to ridicule or public criticism. For example, Smith recently thought about buying a bank stock after being opposed to banks for decades.

He refuses to let fear of embarrassment prevent him from making what he believes is the right decision.

Like Roosevelt’s “man in the arena,” he would rather risk failure than stand among the timid souls who experience neither victory nor defeat.

Subscribe now


The Insanity of the Current Market

Smith describes today’s market environment as unusual.

He argues that AI expectations are currently carrying the market. Strip away AI-related spending, and the broader economic picture looks far less impressive.

This concerns him. No one truly knows what AI will deliver in terms of profits and cash flows over the next five years. When the hype fades, will sustainable business models justify the enormous investments being made?

Smith does not give a definitive answer, but reading between the lines, he appears skeptical.

He also highlights a major structural shift over the past decade: the rise of index investing.

Today, if an investor allocates $100 to an S&P 500 fund, approximately $7–8 flows to Nvidia, and $4–6 goes to many of the other Magnificent Seven companies.

Smith argues that this creates a supply-demand distortion:

Stocks rise → index weight increases → more passive inflows → prices rise further → weights increase again.

This feedback loop reinforces momentum.

Almost every major index fund has significant exposure to these same large companies. In that sense, index investing can amplify concentration risk. Even the MSCI world index, which is supposed to be globally diversified, is highly concentrated in the top 10 US stocks:

According to Smith, the top 10 stocks have driven roughly two-thirds of recent market gains. This explains why buying the index has worked so well — it is heavily concentrated in these mega-cap leaders.

Smith does not claim to know when this dynamic will reverse. However, he notes that we have not experienced a true recession since Iraq invaded Kuwait in the early 1990s, and that the only major firm to collapse in 2008 was Lehman Brothers.

He believes we may be due for a significant correction, though he admits he has no insight into when that might occur.


Why Smith Believes His Portfolio Will Perform Well

Smith argues that his portfolio consists of companies with:

  • Predictable future cash flows (driven by moats and organic growth)

  • Returns on capital of approximately 30%

  • Strong conversion of earnings into free cash flow

He believes that owning businesses with these characteristics will ultimately produce strong results.

However, patience is essential — particularly during periods dominated by powerful market narratives.

Smith echoes a principle associated with Charlie Munger: over long time horizons, shareholder returns tend to approximate the company’s return on capital.

Charlie argues that it is hard for a business with a return on capital of 6% to earn any more than 6% for shareholders over the long term. Here is the full quote from Charlie:

14 Canadian Dividend Stocks With High ROIC

Concluding Reflections

It is striking how quickly perception shifts.

Terry Smith has gone from being celebrated as a superstar investor to being dismissed by some as outdated — all within a few years.

Markets have short memories. Long-term track records are easily forgotten when recent performance disappoints.

Fundsmith has not abandoned its philosophy. It has adapted where necessary but remains committed to its core principles.

Meanwhile, many investors have shifted toward the Magnificent Seven — and that strategy has worked extremely well. So the temptation is understandable.

Still, there are risks in today’s index-driven market. When valuations are stretched, and optimism fuels unprecedented capital investment, it may be wise to step back and reassess.

Buffett faced similar criticism during the dot-com era.

The worst strategy an investor can adopt is constantly changing approaches to match current market leadership. Every year brings new narratives, sectors, and technologies.

The disciplined investor builds a portfolio of high-quality businesses they genuinely want to own — and remains patient enough to let compounding work.

It has been a challenging period for many quality-focused investors.

But disciplined investing, with a strong emphasis on risk-adjusted returns, will never go out of style.

Invest in Quality is a reader-supported publication. To receive new posts and support my work, consider becoming a free or paid subscriber.


Ready to take the next step? Here’s how I can help you grow your investing journey:

  1. Go Premium — Unlock exclusive content and follow our market-beating Quality Growth portfolio. Learn more here.

  2. Essentials of Quality Growth — Join over 300 investors who have built winning portfolios with this step-by-step guide to identifying top-quality compounders. Get the guide.

  3. Free Valuation Cheat Sheet — Discover a simple, reliable way to value businesses and set your margin of safety. Download now.

  4. Free Guide: How to Identify a Compounder — Learn the key traits of companies worth holding for the long term. Access it here.

  5. Free Guide: How to Analyze Financial Statements — Master reading balance sheets, income statements, and cash flows. Start learning.

  6. Get Featured — Promote yourself to over 24,000 active stock market investors with a 42% open rate. Reach out: investinassets20@gmail.com

☐ ☆ ✇ Invest in Quality

Portfolio Update: Trimming Winners & Buying Long-term Compounders 📈

By: Invest In Assets 📈

Hi partner 👋

I run a concentrated portfolio. This means that in good times, I outperform significantly, but in bad times, I underperform.

If a large position goes against me, it impacts the portfolio returns a lot. Even if the business returns are stellar.

I don’t like to trade frequently. I love to let my winners run, and I do most of the time. But the…

Read more

☐ ☆ ✇ Invest in Quality

5 Quality Buys February 💎

By: Invest In Assets 📈

Hi partner! 👋🏻

Welcome to the Feburary edition of Top 5 Buys ✅

In this article, we will discuss our top stock picks for February 2026.

Let’s get into it 👇


The Market Sentiment: Fear 😨

The market is volatile as a result of:

  • Interest rates being “Higher for longer”

  • Mega-CapEx budgets (Way higher than expectations)

  • A changing world order and global politics

Investors answer this uncertainty with fear — pulling money out of the market.

After a brief optimistic second half of 2025, the trend is now negative:

The crazy part? Despite massive fear and uncertainty — the S&P 500 is still close to all time highs:

This is simply because many of the largest companies in the S&P 500 have held up very well, think Nvidia, Alphabet, and Apple.

“SaaS” companies have not been that fortunate, after the narrative shock we’ve seen with the ‘agentic AI’ wave, many former darlings are struggling big time:

Fast growing strong businesses like Crowdstrike and Axon are down -37.4% and -51.2% respectively. And community darlings like Topicus is down -54.6% from its all time highs.

Predicting the future is impossible, but we can point to 5 quality growth companies that are likey to continue compounding despite the prevailing narrative being that AI will eat Software-as-a-Service for lunch.


Subscribe now

Here are this month’s Top 5 👇

#1 Microsoft

Microsoft is not a “SaaS”-business, it is a infrastructure business.

Azure isn’t a project management tool you cancel in a downturn. It’s where the workloads live. And workloads don’t leave easily.

Across Windows, Office, security, developer tools, and cloud, Microsoft is deeply embedded into the operating system of global business. The switching costs at scale are enormous. From a technical, financial, and political perspective inside organizations.

Copilot inside Microsoft 365 is a way for Microsoft to improve the product, monitization and stickyness of the product for hundreds of millions of users.

The business of Microsoft has:

  • Massive cash flows (Free cash flow is somewhat restricted due to high CapEx spend)

  • Pristine balance sheet

  • Bundling powerful tools and products across the entire tech stack

When budgets tighten, vendors consolidate. And consolidation favors platforms. And who is the king of enterprise platforms? You guessed it, Microsoft.

And it’s not like Microsoft is showing weakness in its fundamentals.

  • Productivity was up +16% YoY

  • Intelligent Cloud was up +29% YoY

  • Diluted earnings per share was up +60%

In the most recent quarter:

The fact of the matter is that Microsoft is a pristine quality business, growing at unheard of levels for its size, now trading at 21.9x forward earnings:

The last time Microsoft was trading at this level was in the 2022 sell off — a great time to add shares.

Microsoft has a free cash flow yield of 2.2% + 14.3% expected long term growth.

FCF yield of 2.2% + 14.3% growth = 16.5%


#2 Amazon

When SaaS sells off, anything cloud-related gets dragged down with it.

But AWS is not optional software, it is the infrastructure where modern digital businesses are built.

When customers cut costs, they may reduce usage, but they don’t rip out AWS. The workloads stay. That distinction matters.

All the focus is on AWS; the rest of Amazon is chronically mispriced.

Retail margins expand meaningfully when cost discipline improves. We’ve already seen what happens when fulfillment efficiency tightens and overcapacity normalizes.

Amazon’s advertisement business is a high-margin machine integrated directly into purchase intent. A structural advantage for Amazon that is part of their flywheel.

And ultimately, Amazon’s optionality allows it to reinvest across logistics, AI, devices, healthcare, and Prime. Few companies in the world have that capital allocation flexibility.

Free cash flow always looks weak at the peak of capex cycles. And then it inflects when investment moderates.

Add AI to the equation:

AI workloads don’t replace cloud infrastructure. They increase the demand for it. And AWS remains one of the foundational platforms.

The acceleration in top-line growth is a sign that this is happening:

Despite the reaccelleration of AWS and other business segments, Amazon continues to trade at attractive rates.

Looking at price to operating cash flow because free cash flows are temporarily depressed due to a large CapEx investment cycle, and earnings not providing a realistic picture of earnings capacity:

Amazon has an earnings yield of 3.5% + 17.3% expected long term growth.

Earnings yield of 3.5% + 17.3% = 20.8%

Invest in Quality is a reader-supported publication. To receive new posts and support my work, consider becoming a free or paid subscriber.

Read more

☐ ☆ ✇ Invest in Quality

Portfolio Update & Future Returns💎

By: Invest In Assets 📈

Hi partner 👋

Let’s keep it real: the portfolio’s returns have been poor over the past 12 months.

It’s never fun to lag behind the S&P 500, but my mindset is long term.

I don’t focus on a single calendar year, or even two. I look at a 5+ year time horizon.

My CAGR since I started sharing my portfolio in 2023 is 20%.

My long-term CAGR since I began investing in 2013 is 18%.

My goal is to compound at 15%+ over the long term. So far, I’m exceeding that goal.

My approach has worked extremely well over time, and I will continue to trust it despite short-term underperformance.

“Quality stocks” as a group are underperforming the broader market in 2025.

Image

Subscribe now

All sectors, industries, and investing styles underperform during certain periods. It’s only natural that Quality investing does as well.

Here’s what I’m excited about 👇

The long-term return of the S&P 500 is around 10% CAGR. I’m at 18%. And the best part?

My portfolio is:

  • Cheaper (Free cash flow yield is 5.2% vs. 2.57%)

  • Higher quality (+10% higher ROIC, +10% higher operating margins)

  • Faster growing (Historic growth is +15% higher, future expected growth is +10% higher)

Than the S&P 500 average.

Let’s do some simple math for the Quality Growth Portfolio:

  • Earnings per share are expected to grow 16.3%

  • Dividend yield is 0.9%, growing at 15.5% per year

  • Free cash flow yield is 5.1% vs. the S&P 500 at 2.57%

Let’s break it down:

Earnings growth of 16.3% + 0.9% dividend yield + multiple expansion to market levels over the next 5 years (14.69% CAGR).

16.3% + 0.9% + 14.69% = 31.89%

31.89% seems unrealistically high, but that’s the number we arrive at with the assumptions above.

Where might my assumptions be flawed?

First, earnings per share. Will the companies I own grow that fast?

We have some laggards in the portfolio where growth has temporarily stalled.

The heavy capex spending of some of the core holdings might also impact future earnings per share (higher operating expenses to support new investments could reduce EPS if revenue doesn’t grow fast enough).

We could enter a recession or a tougher macro environment, where growth becomes more difficult.

There are plenty of risks.

But the fact remains: the companies I own have wide moats, exceptional returns on capital, long runways for growth, and a proven track record of expanding earnings, not just for years, but for decades.

Here is the Portfolio Statistics:

The other assumption that could be wrong is that my portfolio will always trade at a discount to the index on a multiple basis.

The index is often heavily weighted toward its strongest performers, many of which have earnings expectations far into the future. That helps justify today’s high multiples.

So maybe we can expect my portfolio of high-quality stocks to re-rate closer to a 3%–3.5% FCF yield. (Keep in mind, the S&P 500 as a whole trades at a 2.57% FCF yield, extremely expensive in my view.)

Just look at the S&P 500’s multiple expansion since 2016:

Image

A move to 3.5% FCF yield over 5 years would imply a 7.85% CAGR from multiple expansion.

A move to 3% FCF yield over 5 years would imply an 11.18% CAGR.

Even if I’m slightly off, that still suggests very strong returns.

Let’s make a more conservative estimate:

In 5 years, my portfolio trades at a 3.5% FCF yield, grows EPS by 12% annually, and pays an average dividend yield of 1% per year.

That would give:

  • Multiple expansion: +7.85% CAGR

  • Earnings per share: +12% CAGR (including buybacks)

  • Dividend: +1%

Total return: 7.85 + 12 + 1 = 20.85%

Not bad. And broadly in line with the portfolio’s performance since I started sharing it online in 2023.

My portfolio is attractively valued, with strong growth prospects over the next 5 years, and holds dominant competitive positions making it difficult for competitors to take market share.

Does that sound compelling? I think so. And for me, it’s a much more comfortable position than owning an S&P 500 index fund at a 2.57% FCF yield.

My portfolio is positioned to return 15–20% over the next 5 years. Historically, from these valuation levels, the S&P 500 has rarely delivered more than 2% CAGR over the following years if we look at the data:

That said, times are changing. Companies are becoming more capital-efficient. We’re seeing the first one-person companies valued at over a billion dollars, and the composition of the index is evolving rapidly compared to the historical data we reference.

This could justify structurally higher multiples for the index, as asset-light, high-ROIC businesses deserve premium valuations.

Still, I believe you need a fairly bullish assumptions to project a 10%+ annual return for the S&P 500 over the next decade. For example, the index would need to grow EPS at around 10% annually while maintaining today’s elevated multiples. Not impossible — but not especially conservative in my view.

So that’s my case for why I believe my portfolio can significantly outperform the S&P 500 over the next 5–10 years.

Now let’s look at the top 5 holdings.

Subscribe now

Read more

☐ ☆ ✇ Invest in Quality

Earnings & Valuation Update🚀

By: Invest In Assets 📈

Hi there, partner! 👋

Today I’m breaking down the earnings report with updated valuation tables for:

  • Taiwan Semiconductor

  • Kinsale Capital

  • Visa

  • Mastercard

  • LVMH $PA.MC

Let’s get into it👇

Read more

☐ ☆ ✇ Invest in Quality

This Stock has Massive Upside Potential

By: Invest In Assets 📈

Tomorrow, I’m adding to my position in Constellation Software.

Yes, in the middle of what many are calling SaaSmageddon.

And yes, Constellation has been hammered in the last 12 months.

The same can be said for many other software companies like Intuit, Adobe, ServiceNow, and Microsoft. Even fast-growing darlings like Axon are down -50% in the last 12 mont…

Read more

☐ ☆ ✇ Invest in Quality

Everybody wants a 100-bagger

By: Invest In Assets 📈

Everybody wants a 100-bagger.

We love the stories. The legends. The charts that go bottom-left to top-right over decades.

We want to say:

  • “I owned Amazon early.”

  • “I bought Nvidia before AI took off.”

  • “I owned Apple before the iPhone.”

But here’s the uncomfortable truth:

Almost nobody actually wants to live through what it takes to earn a 100-bagger.

The Price of Exceptional Returns Is Volatility

Every true long-term compounder looks obvious in hindsight.

In real time, they look like mistakes.

Amazon fell more than 90% after the dot-com bubble.

Netflix dropped 75%twice (Now down -43% again btw).

Meta fell 76% in 2022 while the narrative was “Facebook is dead.”

Nvidia dropped 65% in 2018, long before it became the face of AI.

These weren’t broken businesses.

They were emotionally unbearable holds for investors.

The Market Doesn’t Reward Brilliance. It Rewards Endurance.

The market doesn’t hand out 100-baggers for being early.

It hands them out for being right and holding for the long-term.

That’s the part nobody posts on X.

No one brags about:

  • Watching their position get cut in half

  • Reading bearish headlines every day

  • Questioning their own intelligence

  • Underperforming the index for years

Yet that is the exact environment where the seeds of exceptional returns are planted.

Drawdowns Aren’t a Bug

They’re the Toll Booth

Large drawdowns are often the result of:

  • Temporary growth slowdowns

  • Cyclical effects

  • Short-term narrative shifts

  • The market confusing cyclicality with permanence

For true quality businesses, these moments are not warnings, but tests of conviction.

You Don’t Hold Through Drawdowns by Being “Strong”

This is important.

People like to frame long-term investing as a character trait:

“You just need diamond hands.”

That’s nonsense.

You don’t survive 50% drawdowns through willpower.

You survive them through structure.

  • You understand the business model

  • You know what actually drives long-term value

  • You’ve separated price from narratives & noise

  • You sized the position so you can sleep at night

Conviction isn’t confidence. Conviction is clarity.

Most Investors Quit Right Before the Payoff

This is the cruel irony.

The hardest period to hold a stock is often:

  • After the first big drawdown

  • Before fundamentals re-accelerate

  • When the narrative is the most negative

That’s usually where future returns are the highest, and ownership is the lowest.

The market transfers wealth from:

“The impatient → the prepared”

Not from:

“The stupid → the smart”

The Real Question to Ask Yourself

Instead of asking:

“Can this be a 10x or 100x?”

Ask:

“Am I willing to hold this if it drops 50%, and nothing is fundamentally broken?”

If the answer is no:

  • Your position is too big

  • Your understanding is too shallow

  • Or the business isn’t as high-quality as you think

There’s no shame in that.

But there is a cost.

Conclusion

Everybody wants the outcome.

Very few are willing to endure the process.

100-baggers don’t feel like genius decisions while you’re holding them.

They feel like lonely, uncomfortable, boring commitments to businesses most people have stopped believing in.

And that’s exactly why they work.

Ready to take the next step? Here’s how I can help you grow your investing journey:

  1. Go Premium — Unlock exclusive content and follow our market-beating Quality Growth portfolio. Learn more here.

  2. Essentials of Quality Growth — Join over 300 investors who have built winning portfolios with this step-by-step guide to identifying top-quality compounders. Get the guide.

  3. Free Valuation Cheat Sheet — Discover a simple, reliable way to value businesses and set your margin of safety. Download now.

  4. Free Guide: How to Identify a Compounder — Learn the key traits of companies worth holding for the long term. Access it here.

  5. Free Guide: How to Analyze Financial Statements — Master reading balance sheets, income statements, and cash flows. Start learning.

  6. Get Featured — Promote yourself to over 24,000 active stock market investors with a 42% open rate. Reach out: investinassets20@gmail.com

☐ ☆ ✇ Invest in Quality

Earnings & Valuation Update 🚀

By: Invest In Assets 📈

Hi there, partner! 👋

Today I’m breaking down the earnings report with updated valuation tables for:

  • Alphabet

  • Amazon

  • Evolution $EVVTY

  • ASML

Let’s get into it👇

Alphabet Q4 Earnings:

The Market Is Still Underestimating the AI Flywheel

Alphabet just reported one of the most important quarters in its history.

Not because growth surprised on the upside, but be…

Read more

☐ ☆ ✇ Invest in Quality

Lessons From 10 Timeless Investing Books 📚

By: Invest In Assets 📈

Hi partner 👋

Over the years, I’ve built my investment philosophy around a core set of books that taught not just what to look for, but how to think like long-term compounders.

Invest in Quality is a reader-supported publication. To receive new posts and support my work, consider becoming a free or paid subscriber.

Below are specific, actionable lessons from 10 of the most influential investing books I’ve read, with clear takeaways you can apply to portfolio construction, business analysis, and valuation.


1) Quality Investing: Strong Economics + Durable Competitive Advantages

Book: Quality Investing: Owning the Best Companies for the Long Term

Core Lesson: A quality company is defined not just by metrics, but by repeatable economic outcomes, strong cash generation, high returns on capital, and durable growth opportunities is the pillars of a quality business. 

Key takeaways:

  • A quality compounder exhibits a virtuous cash cycle: predictable cash flows → high ROIC → reinvestment → more cash → more investments at high ROIC.

  • Look beyond simple profitability; assess industry structure (barriers to entry, supplier/customer bargaining power) as a determinant of persistent ROIC (Porter’s five forces is a great analysis tool for this).

  • Recurring revenue models (maintenance contracts, subscriptions, consumables) smooth volatility and make growth more predictable.

  • Use checklists to avoid confirmation bias, and conduct “inertia analysis”, compare how a portfolio would have performed if unchanged, because often doing nothing is the highest-probability correct decision.

Repeatable rule: Quality = cash flow growth + capital efficiency + competitive advantge 

The authors of Quality Investing are, and used to run AKO Capital. Here is the fund’s current US holdings:

2) 100 Baggers: Growth + Multiple Expansion + Time

Book: 100 Baggers: Stocks That Return 100-to-1 and How to Find Them

Core Lesson: To achieve 100x returns, a company must combine sustained growth with P/E expansion over decades.

Key takeaways:

  • The average 100-bagger needs 20–30+ years to reach that outcome; short time frames rarely deliver this magnitude of compounding.

  • High returns on invested capital (ROIC) and the ability to reinvest profitably over time are the dual engines of compounding.

  • Owner-operators: founders or executives with substantial equity, align incentives, and consistently make long-term decisions.

  • Don’t chase valuation heuristics alone; quality and growth potential can justify higher multiples if fundamentals sustain.

Repeatable rule: Time and compounding trump short-term valuation calls.

Chris Mayer, the author of 100-baggers, does not share his portfolio, but he has shared a number of companies he owns. Here is the most updated list:

UPDATED Chris Mayer (100 Baggers) portfolio Sygnity is out (too illiquid)  Computer Modelling Group is in These are 10 of his 11 holdings. The last  one remains a mystery ($KPG?)

Subscribe now

3) The Essays of Warren Buffett: Temperament and Competitive Psyche

Book: The Essays of Warren Buffett

Core Lesson: The investor’s psychology is as important as the investment’s economics.

Key takeaways:

  • Buffett reframes investing as business ownership, not stock speculation; you should ask: “Would I buy the whole company at this price?”

  • Margin of safety isn’t just valuation; it’s behavioral discipline to resist market noise when fundamentals hold.

  • Buffett’s letters highlight avoiding the “most dangerous words in investing”: This time it’s different.

Repeatable rule: Control your mind before you try to control your portfolio.

4) The Warren Buffett Portfolio: Concentration and Capital Allocation

Book: The Warren Buffett Portfolio: Mastering the Power of the Focus Investment Strategy

Core Lesson: A focused portfolio built on best ideas delivers better compounding outcomes than broad, undifferentiated bets. 

Key takeaways:

  • Buffett’s principles emphasize capital allocation; the allocation decisions within a business matter just as much as the allocation between securities.

  • Identify a few high-conviction ideas rather than dozens of mediocre ones.

  • Real competitive advantages are rare and durable, and finding them justifies concentrated positions.

  • The book argues for the benefits of concentrating on your best stock ideas. A too broadly diversified portfolio will never substantially beat the index.

Repeatable rule: Focus your capital where your highest conviction persists.

A reminder from the book: Noone outperforms every year. Not a single portfolio in the study from 1987 to 1996 outperformed all 10 years:

5) What Works on Wall Street: Proven Investment Strategies Backed by Decades of Data

Book: What Works on Wall Street (by James P. O’Shaughnessy)

Core Lesson: The most reliable path to market outperformance isn’t intuition or “hot stock picks”, it’s systematic, evidence-based investing using quantitative, historically tested factors and rules that have shown superior returns over time.

Key takeaways:

  • Historical data beats opinion. The book rigorously analyzes nearly a century of market performance to show which stock-picking rules have actually worked, separating fact from intuitive but ineffective strategies.

  • Quantitative factors matter. Simple, measurable metrics like price-to-sales, price-to-book, price-to-cash flow, and momentum have historically delivered better returns than relying on subjective judgments alone.

  • Small-caps exhibit edge. Historically, smaller-capitalization stocks with value characteristics have delivered higher returns than large, glamour stocks over long periods.

  • Rules must be applied consistently. The book teaches that following clearly defined, repeatable rules and rebalancing on schedule is far more effective than ad-hoc decisions or market timing.

  • Evidence over narratives. O’Shaughnessy’s work debunks many popular investment myths and emphasizes that what feels right often underperforms what proves right in data.

This isn’t a philosophy book; it’s a data-driven playbook for building investment strategies that have stood up to long periods of market history and multiple market cycles.

Repeatable rule: Use simple, historically validated quantitative screens and follow them with discipline. Don’t deviate based on emotion or short-term market noise.

A nugget from the book is the comparison between companies that translated most of their earnings into the most free cash flow, outperformed by 18% per year from highest to lowest:

Image

6) One Up On Wall Street: Invest What You Know Early

Book: One Up On Wall Street

Core Lesson: Everyday life gives you an informational edge, spot businesses you understand before Wall Street does. 

Key takeaways:

  • Many winners show tangible early signals through customer adoption long before Wall Street catches on.

  • Focus on understanding business models deeply, not charts or short-term news.

  • Lynch’s stock categorization (stalwarts, cyclicals, fast growers) forces you to diagnose the business.

Repeatable rule: If you can’t explain the business simply, you don’t understand it well enough.

Great businesses will perform well way before it shows up in the financials (When Wall Street spots them). Look for:

  • Enthusiastic customers: Maybe your friend tells you about it.

  • Crowded stores / Restaurants

  • Switching suppliers at work

  • Word of mouth from multiple sources

These are all factors to look deeper into a business from Peter Lynch’s frame of mind.

7) The Education of a Value Investor: Humility & Process

Book: The Education of a Value Investor

Core Lesson: Value investing is less about formulas and more about continuous learning and feedback loops.

Key takeaways:

  • Guy Spier emphasizes the importance of learning from mistakes and designing a personal investment process that reduces emotional errors.

  • Incentives: both yours and those of management, drive outcomes far more than pure numbers.

  • Regular process reviews (not performance comparisons) guard against self-deception.

  • Stay humble; even Harvard graduates will be schooled by the markets.

Repeatable rule: Build a process that eliminates your worst instincts.

8) Nothing But Net: Durable Growth, Discipline, and Long-Term Winners

Book: Nothing But Net

Core Lesson: The best tech investments come from identifying a small set of businesses with durable growth drivers, competitive advantages, and disciplined execution, and holding them long enough for compounding to do the heavy lifting.

Key takeaways:

  • Long-term revenue growth matters more than short-term earnings noise. The biggest winners are companies that can compound sales steadily over many years.

  • Competitive advantages in tech do exist: network effects, switching costs, scale, data, and brand. But they must be proven in results, not stories.

  • Great tech stocks are built through execution and capital discipline, not hype. Management quality and operating focus are decisive.

  • Valuation matters, but paying a fair price for a great business beats paying a cheap price for a mediocre one; this is amplified in tech.

  • The biggest investing mistakes often come from selling winners too early, not from buying them.

The book argues that tech investing should be boring, repeatable, and fundamentals-driven. Investors who constantly trade, chase narratives, or react to quarterly volatility systematically underperform those who stay focused on durable leaders.

Repeatable rule: Own high-quality growth businesses with clear competitive advantages and let time drive your returns.

Mark Mahaney emphasizes the importance of ‘premium growth’, which in the tech industry is considered +20% CAGR in revenues. This focus on revenue growth is also supported by research conducted by BCG and Morgan Stanley:

9) The Outsiders: Eight Unconventional CEOs and the Secrets to Great Performance

Book: The Outsiders (by William N. Thorndike)

Core Lesson: Exceptional long-term returns come from leaders who allocate capital wisely, act independently of Wall Street pressure, and focus relentlessly on building value rather than managing earnings.

Key takeaways:

  • Capital allocation is the primary driver of value creation. The Outsiders outperform not through industry cycles but through smart decisions about where to deploy cash: buybacks, dividends, M&A, or reinvestment.

  • Successful CEOs think like owners. They treat every dollar of capital as if it were their own, avoiding empire-building and prioritizing return on invested capital.

  • Insulation from the crowd is an advantage. Outsider CEOs avoid conventional metrics that please analysts, preferring decisions that maximize intrinsic value over short-term optics.

  • Disciplined buybacks can be a powerful tool. When a company’s stock trades below intrinsic value, intelligently executed repurchases concentrate ownership and boost per-share economics.

  • Long time horizons beat quarterly horizons. Outsiders hold tests of their capital allocation choices over years, not quarters, and they resist the temptation to time markets or guide to short-term targets.

The book profiles leaders like Tom Murphy (Capital Cities), Henry Singleton (Teledyne), and Warren Buffett (Berkshire Hathaway) to show how independent thinking + rigorous capital allocation consistently beats conventional management approaches.

Repeatable rule: Allocate capital where it earns the highest return, act with independence, discipline, and a long time horizon.
THE OUTSIDERS (BY WILLIAM THORNDIKE) - YouTube

10) Investing for Growth: How to Make Money by Only Buying the Best Companies in the World

Book: Investing for Growth

Core Lesson: Superior long-term investment returns come from buying and holding high-quality companies that generate exceptional returns on capital, avoid needless trading, and compound wealth over time. 

Key takeaways:

  • Invest in quality, not cheapness. Focus first on the underlying business strength, consistent high returns on capital, robust cash flows, and durable competitive advantages, rather than chasing low valuation multiples.

  • Define quality by fundamentals, not narratives. A great business is measured by financial metrics like return on capital employed (ROCE) and cash conversion, not fictitious stories or engineered earnings figures.

  • Compounding is central. Companies that reinvest earnings at high rates of return create enormous shareholder value over time; this compounding effect is far more powerful than short-term gains.

  • Costs matter. Fees, dealing costs, and hidden charges drag on performance; minimizing these improves net returns.

  • Beware complexity and gimmicks. Avoid financial engineering, jargon-laden products, and strategies that obscure the true health of a business.

  • Stay global and selective. High-quality opportunities exist worldwide; broad diversification dilutes the impact of owning truly outstanding companies.

Smith’s thesis is simple but powerful: Buy good companies, don’t overpay, and do nothing. Over decades, this disciplined focus on quality and patience delivers compounding outcomes that most active strategies cannot match.

Repeatable rule: Deploy capital in a small number of high-quality compounders and hold them long enough for intrinsic business value to be realized in market returns. 

Terry Smith and Fundsmith shared this image to emphasize that buying a quality business is more important than getting a low PE multiple:

Final Synthesis: The Quality Growth Investor’s Checklist

Across all 10 books, the same repeatable principles emerge:

  1. Quality economics first: strong cash generation, cash conversion, growth, and high ROIC.

  2. Durable competitive advantages across cycles: Long-term business models and moats matter the most for compounding.

  3. Time is your ally: Compounding needs decades, not quarters.

  4. Management and capital allocation matter as much as fundamental numbers.

  5. Process discipline and psychological edge protect returns.

That’s it for today. Let me know what you think in the comments below, or reply to this email! 

Ready to take the next step? Here’s how I can help you grow your investing journey:

  1. Go Premium — Unlock exclusive content and follow our market-beating Quality Growth portfolio. Learn more here.

  2. Essentials of Quality Growth — Join over 300 investors who have built winning portfolios with this step-by-step guide to identifying top-quality compounders. Get the guide.

  3. Free Valuation Cheat Sheet — Discover a simple, reliable way to value businesses and set your margin of safety. Download now.

  4. Free Guide: How to Identify a Compounder — Learn the key traits of companies worth holding for the long term. Access it here.

  5. Free Guide: How to Analyze Financial Statements — Master reading balance sheets, income statements, and cash flows. Start learning.

  6. Get Featured — Promote yourself to over 30,000 active stock market investors with a 40% open rate. Reach out: investinassets20@gmail.com

Invest in Quality is a reader-supported publication. To receive new posts and support my work, consider becoming a free or paid subscriber.

☐ ☆ ✇ Invest in Quality

Novo Nordisk is Crashing after Earnings💊

By: Invest In Assets 📈

Hi partner 👋

Novo Nordisk just released its Q4 earnings report and was down as much as -17% on the news.

Let’s take a deeper look:

Invest in Quality is a reader-supported publication. To receive new posts and support my work, consider becoming a free or paid subscriber.

Novo Nordisk: Growth Is Intact, But 2026 Will Be a Reset Year

Novo Nordisk closed 2025 with 10% sales growth at constant exchange rates (CER) and industry-leading profitability, but the Q4 report made one thing clear: 2026 will be a year of digestion, not acceleration.

This is not a broken story, but expectations need to be recalibrated.

Key Numbers

  • FY 2025 sales: DKK 309bn (+10% CER) ✅

  • Operating profit: DKK 127.7bn (+6% CER, –1% reported)⛔

  • Operating margin: 41.3% (down from 44.2%)⛔

  • Free cash flow: DKK 28.3bn (vs. –14.7bn in 2024)✅

  • Dividend: DKK 11.70 per share (+3%)✅

  • Share buybacks: New DKK 15bn buyback authorized✅

Not the aggressive growth we’ve seen in previous years, but a solid year in general for Novo Nordisk.

Let’s dive into the good, the bad, and the ugly 👇

The Good

1. Obesity Is Still the Growth Engine ✅

  • Obesity care sales: +31% CER in 2025

  • Wegovy remains the core growth driver globally.

  • The oral Wegovy pill launched in January 2026 is showing early traction (~50,000 weekly prescriptions), mostly via self-pay channels.

This matters. Oral GLP-1 materially expands the addressable market.

2. Pipeline Depth Is Progressing ✅

  • CagriSema (obesity & diabetes): Phase 3 completed, FDA submission underway

  • Semaglutide 7.2 mg: Submitted to FDA

  • Rare disease pipeline (Mim8, concizumab): Strong late-stage progress

Novo is not a one-drug company, the next wave is already forming.

3. Capital Allocation Remains Shareholder-Friendly✅

  • DKK 306bn returned to shareholders since 2020

  • Balance sheet remains solid despite heavy capex and acquisitions

  • Equity ratio improved to 35.7%

The Bad

1. US Pricing Is Under Pressure⛔

  • US sales declined 7% CER in Q4

  • Lower realized prices across GLP-1, especially Ozempic and Rybelsus

  • Mix shift toward self-pay channels (≈30% of Wegovy prescriptions) compresses margins

Volume is growing. Pricing power is not.

The demand is still there in the US, but with pressure from the government and competitors, prices are compressed. The US market was “too good to be true” for companies making obesity and diabetes medicine; now things are normalizing.

2. Diabetes Franchise Is Slowing⛔

  • GLP-1 diabetes sales: –5% CER in Q4

  • Rybelsus volumes down due to reduced promotion

  • Ozempic losing share in competitive markets

This is the natural trade-off of prioritizing obesity, but it shows up in the numbers.

Despite being down in Q4, GLP-1 sales were up 6% CER YoY:

Not the strong growth we’ve seen before, but reflecting that Novo is coming off a hypergrowth phase into more normal market conditions.

The Ugly

1. 2026 Guidance Is a Shock 🚨

Novo guided for –5% to –13% adjusted sales and operating profit growth (CER) for 2026 .

Drivers:

  • US “Most Favoured Nation” pricing impact

  • Semaglutide patent expiries in select markets

  • Intensifying GLP-1 competition

  • Lower realized prices across the portfolio

This is not a cyclical dip. It is a structural pricing reset.

The Q4 report in and of itself was decent, but this is what got Wall Street worried.

So, is Novo management sandbagging this guidance?

I don’t think so, I think this is a conservative estimate (Not optimistic) to steer the market’s expectations moving into 2026. The management has obviously seen multiple factors that could reduce growth in the coming year, and wants to be transparent to gain the trust of the market.

2025 has been a horrendous year for Novo, and it is looking to redeem itself by being honest about the outlook and getting a reset in 2026.

After a -70% drawdown, it needs to stabilize and get back on track:

2. Margins Are Compressing 🚨

  • Gross margin fell to 81.0% (from 84.7%)

  • Higher amortization from Catalent manufacturing acquisition

  • Sustained capex intensity (PP&E + intangibles ≈ DKK 90bn in 2025)

Novo is investing aggressively, but near-term profitability is the casualty.

If there are two things the market hates, it’s negative growth and contracting margins. Novo Nordisk is showing both in this earnings report, leading to a well-deserved sell-off.

Valuation is undemanding long term

I’m expecting short-term volatility and sideways trading for Novo Nordisk, but on a long-term horizon, given that Novo can continue to benefit from its GLP-1 and Obesity drugs (Which I strongly believe), the stock is trading very cheaply.

These are my 3 scenarios for Novo in the next 10 years. No hypergrowth, just consistent growth with multiple expansion (I assume multiple expansion, as Novo is a quality business that should not trade close to a single-digit PE).

  • Fair value estimate: DKK 571.22

  • Current price: DKK 302.85

  • Upside: +88%

  • CAGR expectations from normal scenario: ~20%

The Thesis Going Forward

Novo Nordisk is going from hypergrowth to normalized growth.

2026 will be a reset year, 2027 might show improvements, but the investment case is for 2028 and beyond.

This means that the Novo stock price might trade sideways for a while.

That said, the core thesis remains intact:

  • Obesity is a multi-decade demand wave

  • Novo has the deepest GLP-1 product offering

  • Oral + next-gen injectables expand reach and duration

But we must accept three realities:

  1. Pricing power is normalizing

  2. Growth will be volume-driven, not price-driven

  3. 2026 is about absorbing shocks, not compounding earnings

For long-term investors, this is not about next quarter’s margins. It is about whether Novo remains the best compounder in metabolic disease over the next 5+ years.

In my opinion, the answer is still that this is likely, but the path will be lumpier than previously expected.

Novo Nordisk is not broken, but it is no longer a frictionless growth story.

Invest in Quality is a reader-supported publication. To receive new posts and support my work, consider becoming a free or paid subscriber.


Ready to take the next step? Here’s how I can help you grow your investing journey:

  1. Go Premium — Unlock exclusive content and follow our market-beating Quality Growth portfolio. Learn more here.

  2. Essentials of Quality Growth — Join over 300 investors who have built winning portfolios with this step-by-step guide to identifying top-quality compounders. Get the guide.

  3. Free Valuation Cheat Sheet — Discover a simple, reliable way to value businesses and set your margin of safety. Download now.

  4. Free Guide: How to Identify a Compounder — Learn the key traits of companies worth holding for the long term. Access it here.

  5. Free Guide: How to Analyze Financial Statements — Master reading balance sheets, income statements, and cash flows. Start learning.

  6. Get Featured — Promote yourself to over 24,000 active stock market investors with a 42% open rate. Reach out: investinassets20@gmail.com

☐ ☆ ✇ Invest in Quality

🏰Quality Growth Portfolio: January Factsheet

By: Invest In Assets 📈

Hi there, partner! 👋🏻

I send out a Factsheet every month to detail the performance of the Quality Growth Portfolio so you can follow along and get inspiration and ideas.

Since starting the QG portfolio 01.01.2023, we have beaten the S&P 500 and MSCI world index despite not having any “spectacular” investments like Nvidia or other semiconductor or data c…

Read more

☐ ☆ ✇ Invest in Quality

Microsoft: Quality Compounder at a discount? 💎

By: Invest In Assets 📈

Noise, Signal, or Opportunity?

This week, Microsoft dropped roughly -10% after its earnings report.

Microsoft is now down -20% since its recent all-time highs — not something that happens often for this quality business.

The real question for long-term investors is simple:

Did something break, or did expectations simply run ahead of reality?

Let’s break it down 👇

What Caused the Fall?

Microsoft didn’t miss earnings in any dramatic way. The sell-off was driven by expectations, not fundamentals.

Three things stood out to me:

1. Azure Growth: Still Strong, but at what Cost?

Revenues for Microsoft’s ‘Intelligent Cloud’ segment surged 29%, primarily driven by Azure.

The kicker? Costs of revenue grew 44%.

When the costs of revenue grow faster than the revenue itself, we get a gross margin compression, and Wall Street does not like that at all.

  • Growth is still extremely strong at +29%

  • But the market had priced in flawless acceleration

In a stock trading at a premium multiple, “slightly less amazing” can be enough to trigger a reset.

Despite rapid growth in cost of revenue in the Cloud segment, Azure is firing on all cylinders.

It grew 39% YoY (38% CC) and keeps up its strong revenue growth and acceleration compared to Q2 2025, where revenues ‘only’ grew 31%:

Azure and Intelligent Cloud are still the growth engines in Microsoft, but we will likely see increased costs in the coming 12 - 36 months due to heavy investments in infrastructure and AI.

Microsoft is making investments for the next decade of growth.

In the short term, this can be a bit volatile, but management has proven its ability to execute remarkably in the past.

2. AI Capex Is Rising Faster Than Near-Term Profits

Microsoft is spending aggressively on:

  • Data centers

  • GPUs

  • AI infrastructure tied to OpenAI and Copilot

This compresses margins in the short term, even if it expands the moat long term.

The market essentially wants to see AI profits now, not later. But that will have to wait, because Microsoft is planning to ramp up its capital expenditure significantly.

The key thing to note from Microsoft’s earnings report is:

  • Cash flow from operations was $35.8 billion (+60% YoY)

  • Free cash flow was $5.9 billion (-9%)

Of course, the increase in cash from operations is amazing and reflects an incredible underlying business.

The free cash flows are obviously compressed due to high and increasing capital expenditure.

Another thing to note here is that most of the capital expenditure increase is what we call ‘growth capex’ — capital expenditure invested for future growth, not to maintain current revenues and cash flows.

The increased CapEx is, however, the main concern of Wall Street.

As one Morgan Stanley analyst put it:

“CapEx is growing faster than we expected… concerns about the ROI on this CapEx over time.”

If you can look past the headline numbers of -9% FCF YoY and increasing CapEx, you can see that the business is booming.

3. Valuation Left No Room for Error

Read more

❌