FreshRSS

🔒
❌ About FreshRSS
There are new articles available, click to refresh the page.
☐ ☆ ✇ The Motley Fool

1 Unstoppable Vanguard Growth ETF Up 14% in 2026 to Buy and Hold for the Next 20 Years

By: newsfeedback@fool.com (Todd Shriber)

Key Points

Value investing is taking its lumps, and that's been the case for a while. Yes, various styles move in and out of favor over the years, but the stark reality is that the tide has favored growth stocks for the better part of two decades now.

The Vanguard S&P 500 Growth ETF (NYSEMKT: VOOG) is an exchange-traded fund (ETF) for long-term investors seeking growth equity exposure without the stock-picking burden today.

Missed Nvidia in 2009? This Rare Signal Is Flashing Again. In 2009, a "Double Down" signal flashed for a little-known chipmaker called Nvidia. For the first time in years, that same "Total Conviction" signal is flashing for a company 1/100th the size of Nvidia. Continue »
The ETF acronym in gold letters in front of a laptop.

This ETF is ideal for investors searching for a long-term core holding. Image source: Getty Images.

As its name implies, this $27.1 billion growth ETF tracks the S&P 500 Growth index, the growth offshoot of the S&P 500. Don't worry if you're new to ETFs or index funds because the mechanics of this gauge are easy to understand. Stocks in the growth index and thus the Vanguard S&P 500 Growth ETF are evaluated on momentum, revenue growth, and "the ratio of earnings change to price." Now let's get into the details about why this fund could add value to portfolios over the next 20 years.

Growth and quality

As artificial intelligence (AI) has gained more importance and momentum, allusions to the bursting of the tech bubble in 2000 have become more frequent. Market participants love historical comparisons, and some love bubble talk, but the AI/tech bubble comparison has some flaws, including the point that many of today's tech leaders, including stocks residing in the Vanguard S&P 500 Growth ETF, are highly profitable companies. That wasn't the case back in 2000.

Good news for investors considering this ETF: The combination of quality business models and strong profitability within a growth-stock wrapper is a recipe for long-term durability and upside. Companies with high return on assets (ROA), which measures how firms use their assets to turn profits, have proven durable over the long haul.

Some of today's ROA leaders among U.S.-based companies are Nvidia, Apple, Alphabet, Microsoft, and Amazon. That quintet accounts for about 45% of the Vanguard S&P 500 Growth ETF's portfolio.

They're also among the most cash-rich U.S. companies, as are several other members of this ETF's roster. At the same time, this growth ETF is steeped in quality metrics that support its status as a core holding for long-term investors.

Some economic protection, too

This Vanguard ETF could prove valuable to investors on another front. Conventional investing wisdom dictates that when economic growth slows, market participants should embrace less economically dependent sectors, such as consumer staples and utilities.

However, as the growth rally ages, more investors (and perhaps economists) are awakening to the fact that when economic growth slows, market participants put a premium on accessing noncyclical growth and wide competitive moats. Those are boxes checked by an array of the Vanguard S&P 500 Growth ETF's 148 holdings, including the five mentioned earlier. None of that is to say this ETF will post double-digit gains during a recession, but it could prove more resilient than some investors think.

Adding to the case for the Vanguard S&P 500 Growth ETF as a long-term holding and one that could outperform over the next 20 years is its low annual expense ratio of 0.07%, or $7 on a $10,000 investment.

Should you buy stock in Vanguard Admiral Funds - Vanguard S&P 500 Growth ETF right now?

Before you buy stock in Vanguard Admiral Funds - Vanguard S&P 500 Growth ETF, consider this:

The Motley Fool Stock Advisor analyst team just identified what they believe are the 10 best stocks for investors to buy now… and Vanguard Admiral Funds - Vanguard S&P 500 Growth ETF wasn’t one of them. The 10 stocks that made the cut could produce monster returns in the coming years.

Consider when Netflix made this list on December 17, 2004... if you invested $1,000 at the time of our recommendation, you’d have $421,997!* Or when Nvidia made this list on April 15, 2005... if you invested $1,000 at the time of our recommendation, you’d have $1,413,876!*

Now, it’s worth noting Stock Advisor’s total average return is 978% — a market-crushing outperformance compared to 213% for the S&P 500. Don't miss the latest top 10 list, available with Stock Advisor, and join an investing community built by individual investors for individual investors.

See the 10 stocks »

*Stock Advisor returns as of September 7, 2026.

Todd Shriber has no position in any of the stocks mentioned. The Motley Fool has positions in and recommends Alphabet, Amazon, Apple, Microsoft, and Nvidia. The Motley Fool has a disclosure policy.


☐ ☆ ✇ The Motley Fool

1 Stat That Makes Procter & Gamble Hard to Ignore This September

By: newsfeedback@fool.com (Catie Hogan)

Key Points

If you're looking for an exclusive club, the one statistic that puts Procter & Gamble (NYSE: PG) in rarified air this autumn is 70 years of consecutive annual dividend increases. In a market chock-full of volatility and hype, and with an increasingly uncertain economy, long-term consistency is hard to ignore right now.

This long history of dividend increases means P&G is a legendary Dividend King, which is a company that has raised its payout every year for at least 50 years. Not only has P&G increased its dividend for that long, but it's also paid a dividend every year since 1890.

Missed Nvidia in 2009? This Rare Signal Is Flashing Again. In 2009, a "Double Down" signal flashed for a little-known chipmaker called Nvidia. For the first time in years, that same "Total Conviction" signal is flashing for a company 1/100th the size of Nvidia. Continue »

Strong financials currently back the company's streak. The stock's dividend yield is nearly 3%, while fiscal year 2026 results indicate the company is committed to maintaining a strong payout ratio and improving earnings per share.

A woman shops for cleaning supplies in a store.

Image source: Getty Images.

P&G generated more than $87 billion in revenue in its 2026 fiscal year, a 3% improvement from 2025. Earnings per share rose 2% to $6.62 in that same time frame. P&G is nothing if not steady in its ability to generate cash and more than cover its growing dividend.

Moody's also recently raised P&G's credit outlook to positive. Essentially saying that P&G's free cash flow and earnings growth are sustainable and confirming a strong balance sheet.

The stock itself can't be considered inexpensive, even though the price has declined about 8% in the past year as of this writing. The forward and trailing P/E ratios are both still above 20. The consumer staples sector has also lagged behind the broader market this year. However, that shouldn't deter an income-focused investor seeking a reliable, growing payout. P&G, with its septuagenarian history of dividend increases, is definitely hard to ignore this month.

Should you buy stock in Procter & Gamble right now?

Before you buy stock in Procter & Gamble, consider this:

The Motley Fool Stock Advisor analyst team just identified what they believe are the 10 best stocks for investors to buy now… and Procter & Gamble wasn’t one of them. The 10 stocks that made the cut could produce monster returns in the coming years.

Consider when Netflix made this list on December 17, 2004... if you invested $1,000 at the time of our recommendation, you’d have $421,997!* Or when Nvidia made this list on April 15, 2005... if you invested $1,000 at the time of our recommendation, you’d have $1,413,876!*

Now, it’s worth noting Stock Advisor’s total average return is 978% — a market-crushing outperformance compared to 213% for the S&P 500. Don't miss the latest top 10 list, available with Stock Advisor, and join an investing community built by individual investors for individual investors.

See the 10 stocks »

*Stock Advisor returns as of September 7, 2026.

Catie Hogan has no position in any of the stocks mentioned. The Motley Fool has no position in any of the stocks mentioned. The Motley Fool has a disclosure policy.

☐ ☆ ✇ The Motley Fool

Should You Buy Archer Aviation Below $6?

By: newsfeedback@fool.com (Steven Porrello)

Key Points

  • Archer Aviation is expanding its defense and commercial arms, which could have huge implications for its business.

  • It has co-developed an autonomous eVTOL platform with Anduril.

  • It plans to buy two businesses from aerospace giant Boeing.

Let's cut to the chase: If you have an appetite for risk, and you can stomach near-term volatility, Archer Aviation (NYSE: ACHR) at less than $6 a share might be your next best buy.

That's not because the company is safe, secure, or stable. Quite the contrary: This maker of eVTOL (electric vertical take-off and landing) aircraft is burning through millions of dollars each quarter, generates no meaningful revenue, and still hasn't secured the FAA certification it needs to commercialize its air taxi operations in the United States.

Missed Nvidia in 2009? This Rare Signal Is Flashing Again. In 2009, a "Double Down" signal flashed for a little-known chipmaker called Nvidia. For the first time in years, that same "Total Conviction" signal is flashing for a company 1/100th the size of Nvidia. Continue »

That's the risk. Here's the opportunity.

Archer Aviation aircraft on the tarmac.

Image source: Archer Aviation.

Archer is no longer just developing an air taxi, Midnight, for city travel. It is also developing aircraft for defense and commercial purposes. Indeed, its recent push into these segments -- through the autonomous platform it has co-developed with Anduril -- could give it a source of revenue before paying passengers ever step into a fully certified Midnight vehicle.

In the same vein, a pending acquisition of Boeing's (NYSE: BA) Insitu would take this defense business even further. Insitu, essentially a drone business, already generates $200 million a year. That's roughly 29 times more than Archer's trailing-12-month revenue of about $7 million.

Insitu is great, but I'm even more interested in Wisk, another Boeing business that Archer plans to buy. Wisk has spent years developing autonomous eVTOLs, and Archer could eventually integrate that technology into the Midnight model. If Midnight were to earn authorization to fly as a fully autonomous vehicle, Archer's air taxi business would eliminate a major recurring expense: training and paying pilots.

Granted, many risks still surround Archer -- FAA type certification and manufacturing eVTOLs at scale, just to name two. But even though the risks are the same, the potential rewards are starting to look bigger. Today's price for Archer stock could look awfully cheap in retrospect if the company grows into the broader aerospace business it is now trying to become.

Should you buy stock in Archer Aviation right now?

Before you buy stock in Archer Aviation, consider this:

The Motley Fool Stock Advisor analyst team just identified what they believe are the 10 best stocks for investors to buy now… and Archer Aviation wasn’t one of them. The 10 stocks that made the cut could produce monster returns in the coming years.

Consider when Netflix made this list on December 17, 2004... if you invested $1,000 at the time of our recommendation, you’d have $421,997!* Or when Nvidia made this list on April 15, 2005... if you invested $1,000 at the time of our recommendation, you’d have $1,413,876!*

Now, it’s worth noting Stock Advisor’s total average return is 978% — a market-crushing outperformance compared to 213% for the S&P 500. Don't miss the latest top 10 list, available with Stock Advisor, and join an investing community built by individual investors for individual investors.

See the 10 stocks »

*Stock Advisor returns as of September 7, 2026.

Steven Porrello has positions in Archer Aviation. The Motley Fool has positions in and recommends Boeing. The Motley Fool has a disclosure policy.

☐ ☆ ✇ The Motley Fool

Down Nearly 50% in 2026, Is BigBear.ai Stock Cheap Enough to Finally Buy?

By: newsfeedback@fool.com (David Jagielski, CPA)

Key Points

Shares of tech company BigBear.ai (NYSE:BBAI) have been nosediving this year. As of the end of last week, they were trading below $3 per share, representing a year-to-date decline of 46%. The data analytics company, which has been seen by some as the next potential Palantir Technologies, has been anything but a top growth stock to own.

While there may still be hope that the company turns things around in the future, there is also, undoubtedly, plenty of risk with investing in the business today. Has BigBear.ai stock become so cheap that it's finally worth buying, despite its risks? Let's take a closer look.

Missed Nvidia in 2009? This Rare Signal Is Flashing Again. In 2009, a "Double Down" signal flashed for a little-known chipmaker called Nvidia. For the first time in years, that same "Total Conviction" signal is flashing for a company 1/100th the size of Nvidia. Continue »

People are discussing a sales report.

Image source: Getty Images.

Why has BigBear.ai stock been struggling so badly?

Although BigBear.ai has close relationships with the government and there can sometimes appear to be similarities with Palantir, there are also considerable differences. Its growth, for instance, has been choppy. While revenue has been rising, there have been periods of decline. Its growth rate has often been underwhelming, for a growth stock, anyway. During its most recent quarter, which ended on June 30, its revenue was up a modest 13%, totaling $36.7 million. A year earlier, in the same period, however, its revenue had declined by more than 18%.

Meanwhile, the company has continued to post small gross margins and incur losses. BigBear.ai's lack of consistent growth and inability to stay out of the red have given investors plenty of reasons to be cautious with the tech stock, as it hasn't proven to be a sure thing.

However, investors may still be considering the stock given its low valuation, because amid such a decline, it may be tempting to buy the badly beaten-down stock, believing that it may not end up going much lower. But is that really the case?

Why I wouldn't gamble on BigBear.ai stock

At $1.4 billion in market cap, BigBear.ai isn't the largest artificial intelligence stock to own by any stretch. It's fairly small, especially given the opportunities it possesses. There is, however, also plenty of competition in the space and other companies, including Palantir, which could end up taking business from BigBear.ai.

Without a strong competitive advantage or even a compelling catalyst to convince investors that the business is on the right track, there's little reason to expect things to get any better for BigBear.ai in the near term or even the long run. Its troubling financials and lack of strong growth make it a risky investment; it's a stock I'd steer clear of as it can still go far lower.

Should you buy stock in BigBear.ai right now?

Before you buy stock in BigBear.ai, consider this:

The Motley Fool Stock Advisor analyst team just identified what they believe are the 10 best stocks for investors to buy now… and BigBear.ai wasn’t one of them. The 10 stocks that made the cut could produce monster returns in the coming years.

Consider when Netflix made this list on December 17, 2004... if you invested $1,000 at the time of our recommendation, you’d have $421,997!* Or when Nvidia made this list on April 15, 2005... if you invested $1,000 at the time of our recommendation, you’d have $1,413,876!*

Now, it’s worth noting Stock Advisor’s total average return is 978% — a market-crushing outperformance compared to 213% for the S&P 500. Don't miss the latest top 10 list, available with Stock Advisor, and join an investing community built by individual investors for individual investors.

See the 10 stocks »

*Stock Advisor returns as of September 7, 2026.

David Jagielski, CPA has no position in any of the stocks mentioned. The Motley Fool has positions in and recommends Palantir Technologies. The Motley Fool has a disclosure policy.

☐ ☆ ✇ The Motley Fool

Netflix Has No Dividend. Here's Why Long-Term Investors Should Own It Anyway.

By: newsfeedback@fool.com (James Brumley)

Key Points

  • Netflix isn’t sidestepping the sweeping slowdown the entire streaming industry seems to be facing now.

  • The pioneer of the streaming business, however, still enjoys its highly profitable dominance of this market.

  • Interested investors should recognize they’re buying into the strength and potential of the well-established brand name itself rather than any particular batch of numbers.

There's no denying Netflix's (NASDAQ: NFLX) highest growth days are (probably) in the past rather than in the future. Not only did its second-quarter year-over-year revenue growth of 13.4% -- the weakest growth rate of the past four quarters -- to $12.56 billion miss analysts' already-lowered expectations of just under $12.59 billion, but revenue guidance for the quarter currently underway was also disappointing, at only 11.7% better than 2025's Q3 comparison.

Sensing this headwind could mark the beginning of a more sweeping slowdown for the entire streaming business, Netflix stock has performed poorly since April, and really, since reaching a record high in the middle of last year. That's when the whole industry's transition from its growth phase to its slower, fully mature phase began to become clearer.

Missed Nvidia in 2009? This Rare Signal Is Flashing Again. In 2009, a "Double Down" signal flashed for a little-known chipmaker called Nvidia. For the first time in years, that same "Total Conviction" signal is flashing for a company 1/100th the size of Nvidia. Continue »

Nevertheless, long-term growth investors might want to own a stake in the streaming giant anyway, despite its complete lack of dividends. Here's why.

A person's hand is pointing a remote control at a television to select an on-demand streaming title.

Image source: Getty Images.

Being first, and now biggest, makes all the difference

While Netflix's future numbers will almost certainly look weaker, the stock is still a solid buy for a pair of related reasons. Those are, (1) the streaming business is here to stay, and (2) Netflix is positioned to continue dominating it.

That doesn't mean competitors aren't trying to dethrone the market leader. In fact, numbers from TV-ratings agency Nielsen indicate that over the course of the past year, U.S. consumers are -- albeit only slightly -- decreasingly tuning into Netflix. Netflix is still the leading streaming name within the United States though, and according to data from Hub Research, the first streaming platform U.S. consumers visit when they turn their television on.

It isn't doing too shabbily outside of the U.S. either. Its European and Middle East arm's revenue improved 11% on a currency-neutral basis last quarter, and grew 16% in Latin America. Even its relatively small Asia/Pacific operation experienced a neutral sales growth 18% during the second quarter of 2026. That's encouraging, particularly given that Netflix currently serves fewer than half of the planet's broadband customers, and its programming only accounts for a tiny fraction of the world's total television viewing time.

In other words, there's room to continue growing even if its domestic presence may be peaking, according to Pew Research, a market-leading 72% penetration rate of U.S. households

Perhaps more importantly, there's good reason to believe Netflix can and will continue growing here and abroad, particularly now that it offers an ad-supported option.

The foundation for this continued growth is two-fold.

The first of these folds is the fact that being the first name of its kind in the streaming business (it arguably created the streaming business, in fact) as well as the most entrenched, Netflix is the yardstick by which consumers measure all other streaming services. Indeed, the brand name itself is almost synonymous with the word "streaming" itself. That's powerful. It means Netflix is the name consumers consider first. It also means Netflix has its pick of potential partners, if and when it chooses to forge such relationships.

The other piece of the argument that Netflix is positioned to continue delivering value-building growth is its sheer size and scale, and everything that comes with it. And chief among these upsides is wider profit margins.

Although most major streaming platforms are now profitable on an operating or EBITDA basis, it's still unclear whether they are producing actual net profits. Netflix most definitely is, though. Despite this year's slowdown, through the first half of 2026, roughly $6.0 billion (24%) of its $24.8 billion in year-to-date revenue was turned into ordinary net income, easily making this company the most profitable name in the streaming business. As such, it can spend as much as it needs to in order to remain ahead of its competitors. In light of this, the streaming industry's broad slowdown actually works to Netflix's advantage, making it more difficult for rivals to achieve the subscriber growth needed to better compete with the industry's titan.

Netflix's larger top- and bottom-line results are also a testament to the quality and depth of its content library, much of which is self-produced.

Durable dominance

Will there ever come a time when Netflix just runs out of growth runway? Sure. Nothing lasts forever.

That point is many, many years down the road for Netflix, though, and there's plenty of opportunity for growth between now and then. An outlook from Mordor Intelligence suggests the worldwide streaming market is set to grow at an average annual rate of nearly 11% through 2031, matched by global growth of the ad-supported streaming business that Netflix is now in.

Netflix could continue growing nicely for far longer than that, though, simply because it's got a powerful brand name that can be leveraged in a number of ways beyond the conventional delivery of on-demand entertainment content. This includes a deeper dive into theatrical films, the licensing and monetization of home-grown intellectual property, video gaming, and more. Indeed, it's not inconceivable that Netflix could eventually even develop its own cable channel, utilizing the very cable television business it's largely forced into a massive reset.

Bottom line? Unlike its competitors, Netflix isn't just another struggling streamer that looks more like a late-to-the-party afterthought than a strategically intentional concept. It's a reliably viable business with a powerful brand name that can be leveraged in a bunch of different ways. That's the long-term growth potential you'd be buying into ... even if it doesn't pay dividends in the meantime.

Should you buy stock in Netflix right now?

Before you buy stock in Netflix, consider this:

The Motley Fool Stock Advisor analyst team just identified what they believe are the 10 best stocks for investors to buy now… and Netflix wasn’t one of them. The 10 stocks that made the cut could produce monster returns in the coming years.

Consider when Netflix made this list on December 17, 2004... if you invested $1,000 at the time of our recommendation, you’d have $421,997!* Or when Nvidia made this list on April 15, 2005... if you invested $1,000 at the time of our recommendation, you’d have $1,413,876!*

Now, it’s worth noting Stock Advisor’s total average return is 978% — a market-crushing outperformance compared to 213% for the S&P 500. Don't miss the latest top 10 list, available with Stock Advisor, and join an investing community built by individual investors for individual investors.

See the 10 stocks »

*Stock Advisor returns as of September 7, 2026.

James Brumley has no position in any of the stocks mentioned. The Motley Fool has positions in and recommends Netflix. The Motley Fool has a disclosure policy.

☐ ☆ ✇ The Motley Fool

Anthropic May Require Rank-and-File Employees to Sell Shares on Preset Schedules

By: newsfeedback@fool.com (Manali Pradhan, CFA)

Key Points

  • Anthropic may require regular employees who want to sell shares after its IPO to use preset stock-sale plans.

  • The proposal could help Anthropic mostly preserve its culture of transparency.

  • SpaceX’s first lockup expiration more than doubled the number of shares eligible for trading, showing why it is necessary to schedule share releases post-IPO.

Anthropic may place an unusual restriction on employee stock sales after its planned initial public offering (IPO). The company is considering requiring even its rank-and-file employees to sell shares through preset Rule 10b5-1 trading plans. Those plans are usually put in place only by members of senior leadership who want to cash in on their equity in a way that shows that they're not timing their sales based on insider information.

The 10b5-1 proposal is still being discussed. Meanwhile, Anthropic reportedly plans to release its prospectus after Labor Day, with a possible listing in late September or early October 2026.

Missed Nvidia in 2009? This Rare Signal Is Flashing Again. In 2009, a "Double Down" signal flashed for a little-known chipmaker called Nvidia. For the first time in years, that same "Total Conviction" signal is flashing for a company 1/100th the size of Nvidia. Continue »

Professional laughing while sitting at desk with laptop open in an office.

Image source: Getty Images

A Rule 10b5-1 plan allows employees to set stock-sale instructions in advance, before they possess material nonpublic information. The trades in the plan then occur at preset times, amounts, prices, or formulas.

Anthropic may want tighter control over employee stock sales

The most obvious benefit of a 10b5-1 plan is that it reduces the risk of insider-trading violations. But Anthropic may have another reason.

Anthropic already has an unusually open internal culture. Many of its employees maintain Slack "notebooks" where they share their thoughts and work with colleagues. CEO Dario Amodei also holds companywide meetings known as "Dario Vision Quests" twice a month.

This level of transparency could become harder to maintain once Anthropic is publicly traded. Employees who regularly receive confidential information may not always know when they can safely sell stock, even during normal post-earnings trading windows.

Requiring all of its people to use preset trading plans could help solve this problem. Employees could decide well in advance when and how much stock they want to sell, before receiving information that could move Anthropic's share price. Reuters reported that these plans could allow sales outside normal trading windows, although employees would have less control over the timing and size of their individual trades.

Hence, Anthropic may be trying to preserve how freely information moves inside the company while making employee stock sales more predictable.

What this could mean for Anthropic investors

The proposal also fits with Anthropic's broader approach to pre-IPO shares. While considering allowing existing shareholders to sell stock in the IPO, the company is also weighing longer lockup periods than the customary 180 days.

This strategy could provide some liquidity up front while delaying the timing of when a larger pool of shares becomes available for trading. Preset Rule 10b5-1 plans could then make later employee sales more structured.

The recent example of Space Exploration Technologies (NASDAQ: SPCX), also known as SpaceX, highlights the need to consider the scheduling of share releases. The company's first lockup expiration in August more than doubled the number of shares available to be publicly traded. Another 12.9 billion shares are scheduled to unlock by mid-2027.

Anthropic stock may not follow the same path. However, it shows how quickly share supply can increase after an IPO, which can have a major impact on share prices even when nothing has changed in the underlying business.

An employee selling under a preset plan should also not automatically be viewed as bearish. A scheduled sale reveals less about an employee's current view of Anthropic than a discretionary sale made at the same moment.

However, there is one limitation for investors: Companies must disclose in quarterly filings when directors or officers adopt or terminate Rule 10b5-1 plans. Ordinary employees' plans are not subject to the same quarterly disclosure requirement.

Hence, Anthropic could make employee selling more structured without giving investors the same visibility into all planned sales. The eventual lockup schedule and the amount of stock becoming eligible for sale may therefore matter more than the simple fact that employees are selling.

Where to invest $1,000 right now

When our analyst team has a stock tip, it can pay to listen. After all, Stock Advisor’s total average return is 978%* — a market-crushing outperformance compared to 213% for the S&P 500.

They just revealed what they believe are the 10 best stocks for investors to buy right now, available when you join Stock Advisor.

See the stocks »

*Stock Advisor returns as of September 7, 2026.

Manali Pradhan, CFA has no position in any of the stocks mentioned. The Motley Fool has no position in any of the stocks mentioned. The Motley Fool has a disclosure policy.

☐ ☆ ✇ The Motley Fool

Breakfast News: Selling Is an Art. Your Art.

By: newsfeedback@fool.com (TMF Breakfast News)

Breakfast News

Missed Nvidia in 2009? This Rare Signal Is Flashing Again. In 2009, a "Double Down" signal flashed for a little-known chipmaker called Nvidia. For the first time in years, that same "Total Conviction" signal is flashing for a company 1/100th the size of Nvidia. Continue »

A quick note before we begin: Today's Breakfast News is a special edition since markets are closed for Labor Day. Regular service resumes tomorrow. Fool on!

divider

Many Roads Lead to a Sell

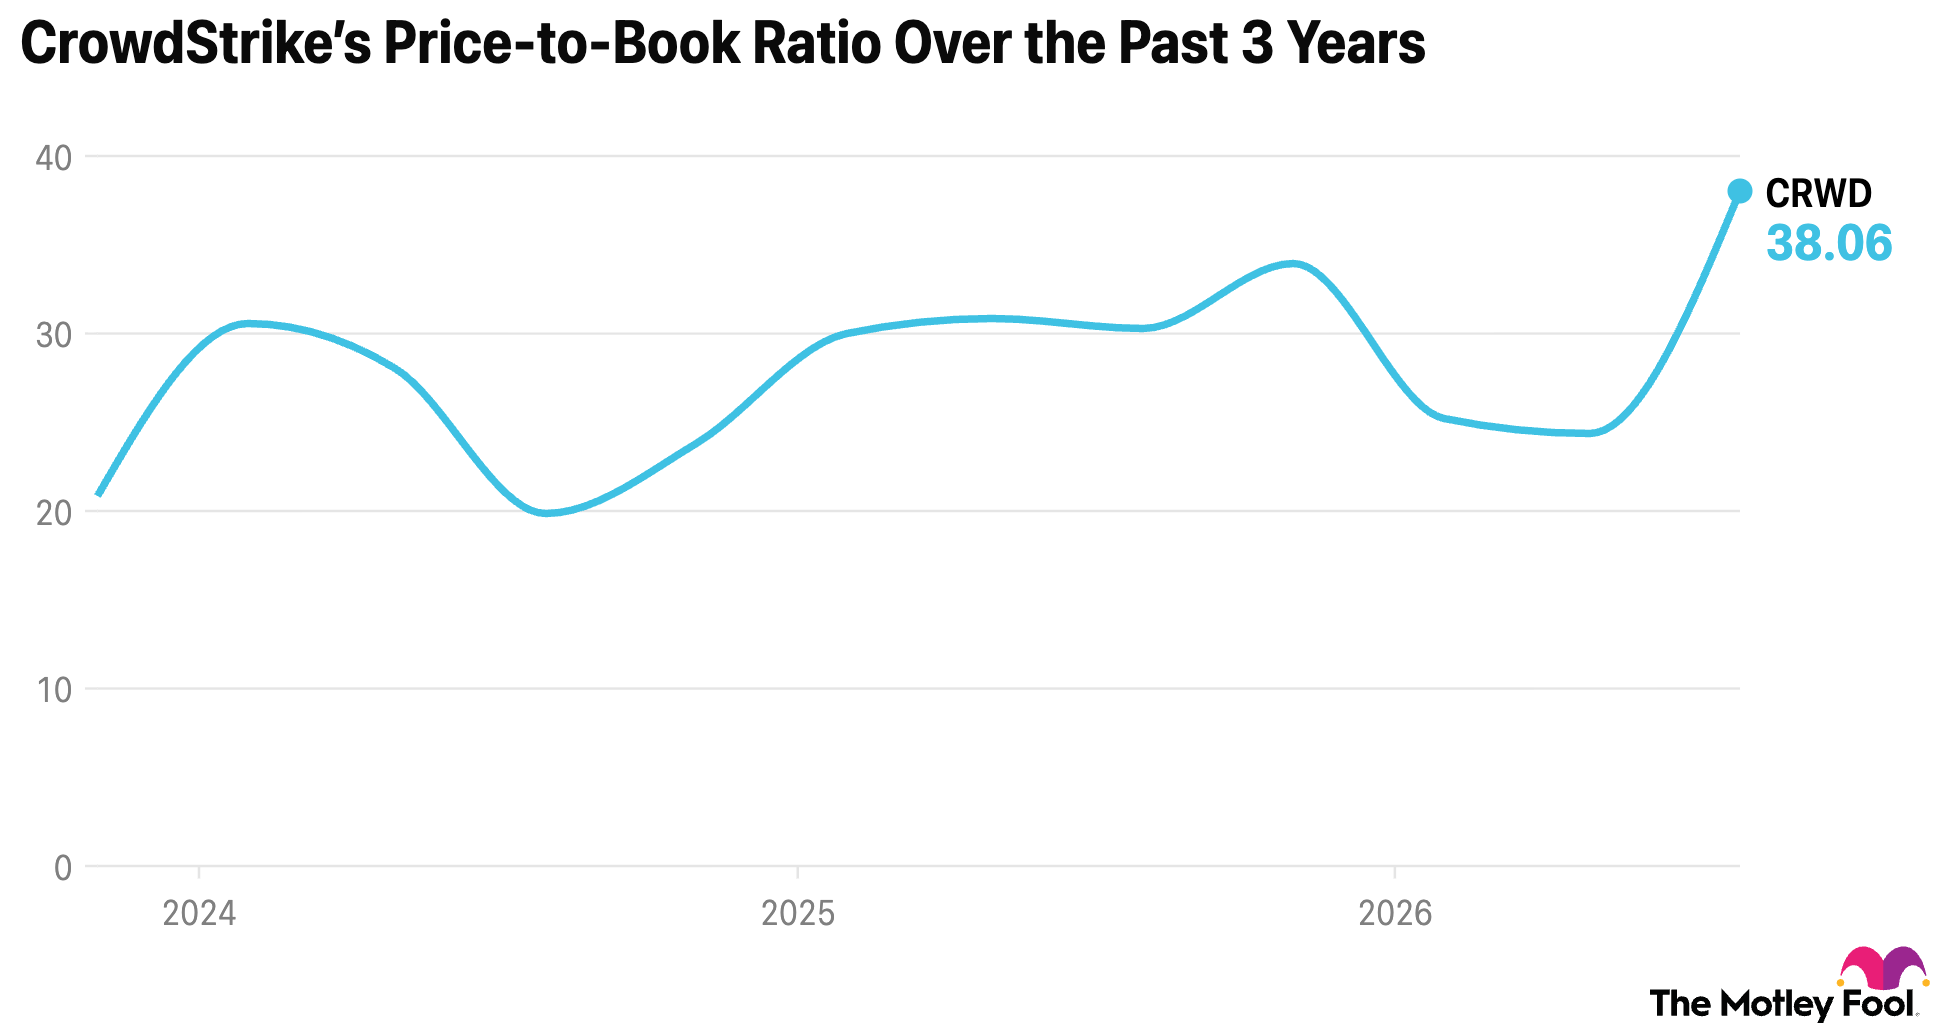
Chart showing CRWD price to book ratio 3 years

Team Rule Breakers

We recently asked what your first instinct is when a stock you own doubles. Almost half of you said hold and stay the course. With CrowdStrike (NASDAQ: CRWD) we announced something in between -- that we will be selling a portion (15%) of our stake, which had grown into the largest holding in the Epic Portfolio.

Our proprietary Potential Growth Indicator sits just above 10% and keeps sliding. CrowdStrike's stock trades near 36 times forward sales (not earnings – sales!). The market has priced it for perfection, and AI cuts both ways for cybersecurity.

PGI indicatior in 2026 down to just over 10

But we still believe in the business, and it still belongs in the portfolio (indeed, it will remain among our largest Epic Portfolio positions). We just want less of it at this price, in this market, at this size.

Tom and David Gardner gave us the cleanest sell rule in The Motley Fool Investment Guide: "When you find a better place for your money, put it there." It's a great rule. It's also one of many. An investor may wisely sell for all kinds of reasons:

  • A winner grew into an uncomfortably large slice of the portfolio.
  • The price outran the business, leaving no room for a stumble.
  • The thesis broke. The moat, the management, or the market changed.
  • The investor never understood the company well enough to hold through a 40% drawdown.
  • Life needs the money: tuition, a medical emergency, a down payment, retirement income.

There are so many other reasons. Also, please notice how these reasons often have very little to do with the company. Selling is less formula than judgment. Thoughtful investors reach different judgments from identical facts.

💡 Epic Portfolio principle: Write your sell rules before you need them.

Your selling discipline has to be yours, and it should exist on paper (or screen) before you need it. In the moment, you'll be reacting to a price rather than a plan. So write down three things for every position: why you own it, what would make that reason untrue, and how large you'll let it grow. Revisit once a year.

If you do that, a "trim" alert becomes information rather than instruction. Some members will sell 15%. Some will sell none. Some will sell more. Every member's situation is different. Selling is an art – your art. The investor who knows why they're selling has already done the hard part.

divider

Stock in Focus: CrowdStrike, of Course

CrowdStrike came into the Epic Portfolio from Team Hidden Gems, and it became our largest holding. It was also Team HG that first brought the stock to the Fooliverse, recommending it in IPO Trailblazers in 2019 at $23.41, then again in early 2020 at $15.61. Tom carried it into Stock Advisor that June at $24. (All prices are split-adjusted.) With the stock over $210 today, those calls are up 810%, 1,265%, and 788%. Take a bow, Team HG, because the company has been delivering.

What

During the recent earnings release, CEO George Kurtz called this the very best quarter in company history. Second-quarter revenue of $1.47 billion surpassed estimates by roughly $30 million, growing 26% year over year. The stock rose 20% on the strength of the report.

Like all Foolish investors, we don't just look at revenue growth. We like to see strong cash flow as well, and the company didn't disappoint. Operating cash flow increased 59% to $530.3 million, and free cash flow rose 33.1%.

Management doesn't see things slowing down, either. It raised the full-year FY2027 revenue outlook to between $5.99 billion and $6.01 billion.

So What?

CrowdStrike's Q2 results offer a compelling combination of strong top-line growth and rapidly improving cash generation, all against a backdrop of surging AI-security demand. Those cash flows will power the company forward: CrowdStrike needs to continue to invest heavily in R&D and equipment to capture the rising demand for its security technologies as AI agents do more and more work, and this quarter says it can fund that through the business rather than from shareholders.

As the "trim" alert pointed out, the stock is not cheap by any measure. Nor would we expect it to be. And as Rule Breakers, we're comfortable with that. We prefer to invest in companies like CrowdStrike with its leadership in the cybersecurity industry as well as its strong financial performance.

Now What?

Even with the recent partial sell recommendation, CrowdStrike remains a buy in every active service in which it's recommended. The Motley Fool has issued more than 100 buy recommendations for CrowdStrike in total across the years, and this quarter has borne out that conviction.

The number to watch from here isn't revenue -- it's whether cash generation keeps pace with the R&D spending that lead depends on. With the company set up to deliver more incredible performance in an industry with so much current and potential demand, we look forward to CrowdStrike setting more records down the road.

A version of this was originally sent to Epic Portfolio members on August 28 as a weekly column.

divider

Today's Question

Tell us about a stock you sold -- and what finally triggered the decision. Would you make the same call again?

Debate with friends and family, or become a member to hear what your fellow Fools are saying!

Where to invest $1,000 right now

When our analyst team has a stock tip, it can pay to listen. After all, Stock Advisor’s total average return is 978%* — a market-crushing outperformance compared to 213% for the S&P 500.

They just revealed what they believe are the 10 best stocks for investors to buy right now, available when you join Stock Advisor.

See the stocks »

*Stock Advisor returns as of September 7, 2026.

The Motley Fool has positions in and recommends CrowdStrike. The Motley Fool has a disclosure policy.
☐ ☆ ✇ The Motley Fool

The Stock Market Has Not Been This Expensive Since the Dot-com Bubble's Peak. History Says to Prepare for What Might Come Next.

By: newsfeedback@fool.com (Brett Schafer)

Key Points

  • The S&P 500's Shiller Cyclically Adjusted Price-to-Earnings ratio has only been higher than its current level at the peak of the dot-com bubble.

  • Earnings per share for U.S. companies are growing rapidly, but this is not sustainable.

  • Diversification is key to surviving any boom-and-bust cycle in the stock market.

Every day, the financial media bombards the world with debates about whether the artificial intelligence (AI) bull market has turned into a bubble. Pundits will go on TV and loudly support one side or the other in this argument, often with little fundamental analysis to back them up. This can leave viewers with few ways to assess the stock market's condition outside of vibes.

But how exactly can you quantitatively define when the stock market is overvalued? The best metric to use might be the Shiller Cyclically Adjusted Price-to-Earnings ratio, otherwise known as the Shiller CAPE ratio. And that metric just hit its most expensive level since the dot-com bubble's peak in late 1999 and early 2000.

Missed Nvidia in 2009? This Rare Signal Is Flashing Again. In 2009, a "Double Down" signal flashed for a little-known chipmaker called Nvidia. For the first time in years, that same "Total Conviction" signal is flashing for a company 1/100th the size of Nvidia. Continue »

Here's what that could mean for the AI bull market.

What is the CAPE ratio?

Unlike the traditional P/E ratio, which simply takes a company's current stock price and divides it by trailing earnings per share (EPS), the CAPE ratio takes a longer-term view to measure earnings and valuation through economic cycles.

Specifically, the CAPE ratio can be applied to something like the S&P 500 index. The numerator of the ratio will remain the same: the combined share price of all the stocks in the index, weighted by market capitalization. But the denominator will be the average EPS -- adjusted for inflation -- over the last 10 years, rather than just the trailing 12 months.

The primary reason investors focus on the market's CAPE ratio instead of its simple P/E ratio is that it's designed to smooth out earnings over a business cycle, where one year may run hot (for example, 2026) and others may run cold (for example, 2020 during the pandemic lockdowns).

The S&P 500 index now trades at a CAPE ratio of over 41, its highest level in history outside of the period at the end of the dot-com bubble in late 1999 and early 2000. This should give even an ultra-bullish investor pause when weighing the question of whether AI stocks are in a bubble.

A robot skeleton blowing a bubble with the letters AI on it.

Image source: Getty Images.

Earnings growth and free cash flow

In 2026, S&P 500 earnings have soared due to rising spending on semiconductors, memory, and AI software, and the rising valuations of start-ups like OpenAI and Anthropic. When big tech companies invest in OpenAI and OpenAI's value climbs in a quarter, those investment gains register as earnings for that quarter. These are one-time benefits that are unrelated to their underlying businesses, though, and they are a key reason analysts estimate that the S&P 500's overall earnings grew by 52% year-over-year in Q2. However, this type of growth is not sustainable and inflates the trailing P/E figure.

True free-cash-flow generation will drive value for the S&P 500 over the long-term, funding stock buybacks and dividend payments for shareholders. And free cash flows are declining among some of the world's largest companies. Big players like Amazon, Alphabet, and Microsoft are close to generating zero in free cash flow if they continue with their current torrid rates of capital expenditures. That also adds some precariousness to this bull market mania.

S&P 500 Shiller CAPE Ratio Chart

S&P 500 Shiller CAPE Ratio data by YCharts.

Here's what investors should do

Given the factors laid out above, it is possible that AI stocks are in a bubble. When bubbles pop, drawdowns of as much as 80% can wipe out years of gains for investors -- which is what happened in the aftermath of the dot-com bubble. The current Shiller CAPE ratio certainly suggests that the bubble scenario is underway. Or, super-intelligent AI systems may be on the immediate horizon that could lead to a rapid acceleration in economic growth and EPS growth. This could be the only way for the S&P 500 to keep performing well over the long haul.

As an individual investor, you should not put all your chips into one side of the argument. It would be foolish to put 100% of your portfolio in risky AI stocks, but it would also be risky to go 100% in bonds or other low-risk assets, as that strategy would limit your long-term upside.

Diversification remains a key tool for helping your portfolio perform adequately, and preserving your wealth through the market cycle.

Should you buy stock in S&P 500 Index right now?

Before you buy stock in S&P 500 Index, consider this:

The Motley Fool Stock Advisor analyst team just identified what they believe are the 10 best stocks for investors to buy now… and S&P 500 Index wasn’t one of them. The 10 stocks that made the cut could produce monster returns in the coming years.

Consider when Netflix made this list on December 17, 2004... if you invested $1,000 at the time of our recommendation, you’d have $421,997!* Or when Nvidia made this list on April 15, 2005... if you invested $1,000 at the time of our recommendation, you’d have $1,413,876!*

Now, it’s worth noting Stock Advisor’s total average return is 978% — a market-crushing outperformance compared to 213% for the S&P 500. Don't miss the latest top 10 list, available with Stock Advisor, and join an investing community built by individual investors for individual investors.

See the 10 stocks »

*Stock Advisor returns as of September 7, 2026.

Brett Schafer has no position in any of the stocks mentioned. The Motley Fool has positions in and recommends Alphabet, Amazon, and Microsoft. The Motley Fool has a disclosure policy.

☐ ☆ ✇ The Motley Fool

Canopy Growth's Revenue Grew 13% Last Quarter. Investors Barely Reacted. Here's Why.

By: newsfeedback@fool.com (Jeff Siegel)

Key Points

  • Canopy Growth's revenue increased 13% year over year in its most recent fiscal quarter.

  • Adjusted gross margin improved, while EBITDA losses narrowed sharply.

  • Investors still need proof that Canopy's turnaround is sustainable.

Canopy Growth (NASDAQ: CGC) grew its revenue by 13% year over year to $58.9 million in its fiscal 2027 first quarter, but the stock barely reacted because investors have seen plenty of nascent Canopy turnarounds that never quite materialized.

To be sure, the company's improvements weren't limited to the top line. Its adjusted gross margin increased from 25% in the prior-year period to 31%, while its adjusted EBITDA loss narrowed by 59% to $2.3 million. Canadian medical cannabis revenue increased 22%, adult-use cannabis sales grew 10%, and international cannabis sales rose 10%. But Canopy Growth still isn't profitable.

Missed Nvidia in 2009? This Rare Signal Is Flashing Again. In 2009, a "Double Down" signal flashed for a little-known chipmaker called Nvidia. For the first time in years, that same "Total Conviction" signal is flashing for a company 1/100th the size of Nvidia. Continue »

The muted response

The company lost $10.6 million during the quarter (which ended June 30), while its free cash outflow increased to $18.6 million, up from $8.4 million a year earlier. That's a problem for a company that has spent years burning cash, restructuring operations, and issuing more shares of stock to raise funds.

There's another wrinkle, too. Some of Canopy's growth this year came from its acquisition of MTL Cannabis. The company specifically attributed portions of its Canadian medical and adult-use growth to the acquisition. So that 13% top-line increase doesn't mean Canopy's existing businesses suddenly returned to double-digit organic growth. That may help explain the market's muted response to the quarterly report.

Cannabis bud under warehouse grow lights.

Image source: Getty Images.

The market clearly wasn't looking for another quarter where Canopy simply lost less money. It was hoping for evidence that the business will eventually be able to support itself without continually consuming cash. The latest results suggest that Canopy is moving in that direction. But after years of disappointment, investors aren't giving management much credit for promises. If revenue continues growing, margins improve, and cash burn starts falling, the stock could become more interesting. Until then, 13% revenue growth is encouraging, but it's not enough to prove Canopy's turnaround has finally arrived.

Should you buy stock in Canopy Growth right now?

Before you buy stock in Canopy Growth, consider this:

The Motley Fool Stock Advisor analyst team just identified what they believe are the 10 best stocks for investors to buy now… and Canopy Growth wasn’t one of them. The 10 stocks that made the cut could produce monster returns in the coming years.

Consider when Netflix made this list on December 17, 2004... if you invested $1,000 at the time of our recommendation, you’d have $421,997!* Or when Nvidia made this list on April 15, 2005... if you invested $1,000 at the time of our recommendation, you’d have $1,413,876!*

Now, it’s worth noting Stock Advisor’s total average return is 978% — a market-crushing outperformance compared to 213% for the S&P 500. Don't miss the latest top 10 list, available with Stock Advisor, and join an investing community built by individual investors for individual investors.

See the 10 stocks »

*Stock Advisor returns as of September 7, 2026.

Jeff Siegel has no position in any of the stocks mentioned. The Motley Fool has no position in any of the stocks mentioned. The Motley Fool has a disclosure policy.

☐ ☆ ✇ The Motley Fool

Target Has Raised Its Dividend Through Every Market Crash Since 1971. Should Income Investors Still Buy It?

By: newsfeedback@fool.com (John Ballard)

Key Points

  • The dividend has grown through seven bear markets over the last 55 years.

  • Target’s sales are back in growth mode after two tough years.

  • Earnings grew 20% year over year last quarter, reflecting growth in higher-margin opportunities like advertising.

Target (NYSE: TGT) has raised its dividend for 55 consecutive years, spanning seven bear markets (a market drop of at least 20% from peak to trough) and multiple recessions. That's the kind of resiliency that income investors love to see.

The stock has climbed about 69% since the beginning of the year and no longer looks cheap on a price-to-earnings (P/E) basis. But that rebound is backed by real progress in sales and profitability, which in turn supports the dividend. With the stock still yielding about 2.8%, it could still be a solid buy, considering the turnaround underway in the business.

Missed Nvidia in 2009? This Rare Signal Is Flashing Again. In 2009, a "Double Down" signal flashed for a little-known chipmaker called Nvidia. For the first time in years, that same "Total Conviction" signal is flashing for a company 1/100th the size of Nvidia. Continue »

Target store

Image source: Target.

Target's improving sales are driving the stock higher

Target is getting back to growth after a couple of years of weak results. Sales decline from fiscal 2024 through fiscal 2026 (ending in January). Multiple factors were to blame, including cautious consumer spending and inflation.

This year has been a different story. Net sales grew 5% year over year in the second quarter, with comparable sales up 3.8% amid solid increases in traffic. Management is guiding for full-year sales to grow about 5%. This followed a major effort to reset stores, such as expanding its fresh-produce selection and adding more space for impulse buys like snacks and candy.

Despite the stronger sales trends, there's still room for improvement. Management noted that home and apparel goods are still not where they need to be. Still, CEO Michael Fiddelke said they see their efforts "resonating with guests," which is building momentum.

Why the stock is still a buy for income investors

Target recently raised its quarterly dividend 1.8% to $1.16 per share. It says a lot about the company's durability that it kept increasing the dividend even while sales were under pressure over the last three years.

Importantly, the company's margins and free cash flow look poised to increase. Over the past year, it paid out 46% of free cash flow in dividends, leaving room to sustain the dividend if traffic softens. Its dividend payout looks very safe, with free cash flow up 51% year-over-year on a trailing 12-month basis.

Adjusted earnings rose 20% year over year in the second quarter, excluding tariff refunds. That strength reflects growth in higher-margin revenue streams, including advertising, and better in-stock levels for frequently purchased items.

Overall, Target appears to be executing well. Over time, investors should expect improving earnings and free cash flow to support continued dividend increases. The stock is fairly valued at a forward P/E of about 16, but for investors who are primarily interested in the dividend, Target is still a solid stock to buy and hold.

Should you buy stock in Target right now?

Before you buy stock in Target, consider this:

The Motley Fool Stock Advisor analyst team just identified what they believe are the 10 best stocks for investors to buy now… and Target wasn’t one of them. The 10 stocks that made the cut could produce monster returns in the coming years.

Consider when Netflix made this list on December 17, 2004... if you invested $1,000 at the time of our recommendation, you’d have $421,997!* Or when Nvidia made this list on April 15, 2005... if you invested $1,000 at the time of our recommendation, you’d have $1,413,876!*

Now, it’s worth noting Stock Advisor’s total average return is 978% — a market-crushing outperformance compared to 213% for the S&P 500. Don't miss the latest top 10 list, available with Stock Advisor, and join an investing community built by individual investors for individual investors.

See the 10 stocks »

*Stock Advisor returns as of September 7, 2026.

John Ballard has no position in any of the stocks mentioned. The Motley Fool has positions in and recommends Target. The Motley Fool has a disclosure policy.

☐ ☆ ✇ The Motley Fool

Should You Avoid Nike Stock, Even at a 12-Year Low?

By: newsfeedback@fool.com (Dave Kovaleski)

Key Points

Investors have been waiting for Nike (NYSE: NKE) stock to hit bottom and start to move up for a long time, but it just keeps going lower.

Since its peak in November 2021, when it traded near $180 per share, Nike stock has plummeted by about 78% to its current price of $38.50 per share. The stock price has not been this low in about 12 years.

Missed Nvidia in 2009? This Rare Signal Is Flashing Again. In 2009, a "Double Down" signal flashed for a little-known chipmaker called Nvidia. For the first time in years, that same "Total Conviction" signal is flashing for a company 1/100th the size of Nvidia. Continue »

This year, the stock price is down about 40% year-to-date, as hopes of a turnaround under new CEO Elliott Hill have been derailed by weak demand and sputtering revenue in a challenging market marked by high inflation, tariffs, and intense competition in the wholesale market that Nike is now trying to reenter.

A person shopping for sneakers.

Image source: Getty Images.

Is Nike stock finally a buy?

A major problem for Nike stock is that, despite a long, steady five-year decline, Nike stock remained overvalued. As recently as June, it was trading at 30 times earnings. For a company that had flat revenue last fiscal year and suffered a 3% decline in earnings, a price/earnings ratio of 30 is just way too high.

But a continued decline in shares through the summer has finally brought down Nike's P/E ratio to a more reasonable 18. It is still too high, given Nike's sluggish earnings outlook. On its fiscal Q4 earnings call in June, Nike management said it expects the difficult environment to remain the same over the next six months, with revenue to be down slightly. But tighter cost controls are anticipated to bring flat earnings and improve cost margins.

So has Nike reached bottom? I honestly don't think so -- not yet. It is getting closer to the buy zone, but the P/E is still too high for its tepid earnings outlook.

Should you buy stock in Nike right now?

Before you buy stock in Nike, consider this:

The Motley Fool Stock Advisor analyst team just identified what they believe are the 10 best stocks for investors to buy now… and Nike wasn’t one of them. The 10 stocks that made the cut could produce monster returns in the coming years.

Consider when Netflix made this list on December 17, 2004... if you invested $1,000 at the time of our recommendation, you’d have $421,997!* Or when Nvidia made this list on April 15, 2005... if you invested $1,000 at the time of our recommendation, you’d have $1,413,876!*

Now, it’s worth noting Stock Advisor’s total average return is 978% — a market-crushing outperformance compared to 213% for the S&P 500. Don't miss the latest top 10 list, available with Stock Advisor, and join an investing community built by individual investors for individual investors.

See the 10 stocks »

*Stock Advisor returns as of September 7, 2026.

Dave Kovaleski has no position in any of the stocks mentioned. The Motley Fool has positions in and recommends Nike. The Motley Fool has a disclosure policy.

☐ ☆ ✇ The Motley Fool

Jensen Huang Just Said a 1-Gigawatt Facility Is Worth $50 Billion to $60 Billion. Here's What That Means for Neocloud Stocks Like Nebius.

By: newsfeedback@fool.com (Marc Guberti)

Key Points

  • Jensen Huang recently valued a 1-gigawatt facility at $50 billion to $60 billion.

  • Higher data center valuations can help neoclouds secure more lucrative deals, which directly translates into higher prepayments.

  • Neoclouds also have the option to do data center financing for additional funds, but prepayments and GPU-backed financing have been responsible for the majority of capital expenditures so far.

The AI infrastructure buildout has been expensive, and Nvidia (NASDAQ: NVDA) CEO Jensen Huang recently put a price on it. He estimated at the G20 Summit that it costs between $50 billion and $60 billion to build a 1-gigawatt facility.

These facilities will become vital for the AI build-out. They make it easier to scale agentic AI, chatbots, and upcoming physical AI, which includes humanoid robots and autonomous vehicles.

Missed Nvidia in 2009? This Rare Signal Is Flashing Again. In 2009, a "Double Down" signal flashed for a little-known chipmaker called Nvidia. For the first time in years, that same "Total Conviction" signal is flashing for a company 1/100th the size of Nvidia. Continue »

This is obviously good news for neocloud providers like Nebius (NASDAQ: NBIS), which build these data centers. However, there are a few key catalysts that investors may not be anticipating.

data center

Image source: Getty Images

Annual recurring revenue isn't the only way to value AI data center providers

When Nebius reported Q2 earnings, it told investors that its revenue jumped by 454% year-over-year to $582 million. Annual recurring revenue reached $3 billion, and it's aiming for $7 billion to $9 billion in annual recurring revenue by the end of the year.

While annual recurring revenue is a good gauge for determining a stock's fair price, investors should also consider the multigigawatt pipeline. Since Huang set $50 billion to $60 billion as the range for a 1-gigawatt facility, Nebius' projected five gigawatts of contracted power by the end of 2026 can be worth up to $300 billion when all of the facilities are finished.

That doesn't mean Nebius should immediately have a $300 billion market cap. However, the data centers offer significant value that goes well beyond the annual recurring revenue that they can generate.

Neoclouds got additional leverage with raising capital

Neoclouds have a compelling opportunity, but high capital costs have been the major weakness. Huang pegging the cost of a 1-gigawatt facility at $50 billion to $60 billion can actually solve that problem, especially if the value of these facilities continues to climb.

Neoclouds like Nebius have been taking customer prepayments to help fund these builds. If people place a higher valuation on a 1-gigawatt facility, Nebius can ask for additional money up front, which goes toward site construction.

Nebius told investors in its Q2 shareholder letter that the annual contract value of a single megawatt stood at $12 million at the start of the year. Q2 deals have exceeded $20 million per year, and the company has been negotiating short-term Q3 deals that are above $40 million per megawatt.

It's reached the point where 50% to 60% of Nebius' capital expenditures have been self-financed by prepayments. That's part of the reason Nebius ended the quarter with an $8 billion cash position. As the value of megawatts and data centers increases, Nebius can get even more prepayments that reduce the necessity of shareholder dilution.

Data centers can be financed in the future

Although prepayments are an excellent funding source, they haven't been enough for Nebius and other neoclouds. However, the data centers themselves can cover the gap if lenders are willing to let neoclouds borrow against them.

Iren (NASDAQ: IREN) CEO Dan Roberts said that prepayments can keep up with most of the neocloud's capital expenditures. However, the company also said that its entire data center portfolio remains unencumbered. Iren can theoretically raise billions of dollars just by taking out loans against its facilities, and the same applies to Nebius. GPU-backed financing has been the popular route for both of these companies.

There's no need to finance the data centers if prepayments, GPU-backed financing, and realized revenue are enough to keep up with expenses. However, it's an extra resource that will make it easier to fund additional projects.

One of the bearish points for neoclouds is how they are going to raise all of the necessary capital for the data center buildouts. A focus on prepayments and GPU-backed financing has mostly answered that question, but data center financing serves as an extra funding source if needed.

Should you buy stock in Nebius Group right now?

Before you buy stock in Nebius Group, consider this:

The Motley Fool Stock Advisor analyst team just identified what they believe are the 10 best stocks for investors to buy now… and Nebius Group wasn’t one of them. The 10 stocks that made the cut could produce monster returns in the coming years.

Consider when Netflix made this list on December 17, 2004... if you invested $1,000 at the time of our recommendation, you’d have $421,997!* Or when Nvidia made this list on April 15, 2005... if you invested $1,000 at the time of our recommendation, you’d have $1,413,876!*

Now, it’s worth noting Stock Advisor’s total average return is 978% — a market-crushing outperformance compared to 213% for the S&P 500. Don't miss the latest top 10 list, available with Stock Advisor, and join an investing community built by individual investors for individual investors.

See the 10 stocks »

*Stock Advisor returns as of September 7, 2026.

Marc Guberti has positions in Iren. The Motley Fool has positions in and recommends Nvidia. The Motley Fool has a disclosure policy.

☐ ☆ ✇ The Motley Fool

3 Historical Reasons I'll Be Completely Avoiding Anthropic's Upcoming and Potentially Record-Breaking IPO

By: newsfeedback@fool.com (Sean Williams)

Key Points

  • AI start-up Anthropic is expected to file its public prospectus after the Labor Day holiday and seek a valuation of around $2 trillion.

  • Tech-driven initial public offerings (IPOs) have often stumbled out of the starting gate.

  • Even with Anthropic delivering a small second-quarter profit, one valuation metric points to big trouble.

  • For more than three decades, game-changing technological innovations have endured bubble-bursting events.

If you thought Elon Musk's Space Exploration Technologies (SpaceX) (NASDAQ:SPCX) was the stand-out initial public offering (IPO) of 2026, you might be sorely mistaken. Although SpaceX rewrote Wall Street's record books with its $1.77 trillion IPO, which raised a record $85.7 billion, including the underwriters' overallotment, artificial intelligence (AI) start-up Anthropic aims to knock SpaceX from its pedestal.

The developer of the increasingly popular Claude large language model has already confidentially filed the necessary paperwork to go public and is widely expected to publish its registration statement (i.e., prospectus) after the Labor Day holiday. It's believed that Anthropic is seeking a late-September or early-October listing and a staggering $2 trillion valuation.

Missed Nvidia in 2009? This Rare Signal Is Flashing Again. In 2009, a "Double Down" signal flashed for a little-known chipmaker called Nvidia. For the first time in years, that same "Total Conviction" signal is flashing for a company 1/100th the size of Nvidia. Continue »

A person is reading a response from a large language model chatbot on a computer screen.

Image source: Getty Images.

While there's little doubt that retail investors will be lining up for their chance to buy into this hypergrowth opportunity, I won't be one of them. I'll be completely avoiding Anthropic's potentially record-breaking IPO for three historical reasons.

1. Tech-driven IPOs often stumble out of the starting gate

To begin with, tech-focused IPOs have been retail investor traps, more often than not, over the last 14 years.

In early June, before SpaceX went public, Truist Financial (NYSE:TFC) published the performance of the last 30 major tech-driven IPOs since mid-2012. Truist found that the average tech-focused IPO endured a year-one maximum drawdown of 55%! For context, SpaceX's all-time high-to-record-low drawdown is 54% thus far.

Moral of the story - do NOT chase hot IPOs

Year-1 average drawdown = 55%
Year-1 median drawdown = 54%

Table: Truist pic.twitter.com/xt864JD4Xh

— Puru Saxena (@saxena_puru) June 3, 2026

Truist's data set exposes the emotional aspect of IPO investing and the unsustainable nature of IPO buzz. While Anthropic was able to generate a small adjusted profit in the second quarter on more than $11.5 billion in sales, according to Bloomberg News, Anthropic's AI infrastructure build-out will cost a proverbial arm and a leg in the coming years and weigh heavily on its profit potential.

2. Anthropic's valuation is historically unsustainable

To state the obvious, valuing public companies involves some subjectivity, and there isn't a one-size-fits-all approach. Nevertheless, one historically unblemished valuation metric suggests that retail investors who pile into Anthropic early will regret it.

Three decades of history have shown that companies at the forefront of game-changing technologies are unable to sustain price-to-sales (P/S) ratios above 30 for an extended period. If Anthropic goes public at a $2 trillion valuation, it would be trading at north of 30 times its annual run rate sales (through July) and well above 30 times its trailing-year sales.

Although progressively higher sales can reduce Anthropic's P/S ratio over time, a trailing 12-month P/S ratio that's well over 30 out of the gate can weigh on its shares.

A twenty-dollar bill paper airplane that's crashed and crumpled into a financial newspaper.

Image source: Getty Images.

3. Game-changing technologies and bubble-bursting events go hand in hand

Lastly, next-big-thing technologies have a checkered past.

On the one hand, almost no one denies that artificial intelligence is a game-changing technology with multitrillion-dollar global potential. Anthropic's outsize revenue growth – sales surged more than 1,300% in the second quarter from the previous year -- offers insight into the scope of this addressable market.

However, every game-changing technology since, and including, the advent of the internet in the mid-1990s has navigated an early innings bubble-bursting event. These bubbles arise and burst because investors consistently overestimate the pace of adoption and optimization of new technologies. While the adoption rate of AI infrastructure and applications isn't in question, businesses are likely several years away from optimizing AI solutions to boost sales and profits.

If the AI bubble bursts, as history suggests it will, Anthropic won't have much of a foundation to lean on.

Where to invest $1,000 right now

When our analyst team has a stock tip, it can pay to listen. After all, Stock Advisor’s total average return is 978%* — a market-crushing outperformance compared to 213% for the S&P 500.

They just revealed what they believe are the 10 best stocks for investors to buy right now, available when you join Stock Advisor.

See the stocks »

*Stock Advisor returns as of September 7, 2026.

Sean Williams has no position in any of the stocks mentioned. The Motley Fool has positions in and recommends Truist Financial. The Motley Fool has a disclosure policy.

☐ ☆ ✇ The Motley Fool

10-Year Treasuries Yield About 4.8%. Here Are 3 High-Yielding Dividend Stocks That Actually Beat That.

By: newsfeedback@fool.com (Geoffrey Seiler)

Key Points

  • AGNC has a ultra-high yield and is currently operating in a good environment.

  • Energy Transfer offers a great combination of a high-yield and growth opportunities.

  • Verizon has a high yield and some nice potential tailwinds.

The yields on 10-year Treasury notes have been hovering near multi-year highs, at around 4.8%. When the 10-year yield hit 4.818% earlier this month, it reached its highest level since November 2023. A combination of inflation and geopolitical risk tied to the U.S.-Iran conflict has largely driven yields higher.

If you're an income-oriented investor, 10-Year Treasuries are an option, but if you're looking for higher yields to better help you keep up with inflation, these three dividend stocks could be great options.

Missed Nvidia in 2009? This Rare Signal Is Flashing Again. In 2009, a "Double Down" signal flashed for a little-known chipmaker called Nvidia. For the first time in years, that same "Total Conviction" signal is flashing for a company 1/100th the size of Nvidia. Continue »

Dividend sign surrounded buy money.

Image source: Getty Images

1. AGNC Investment

AGNC Investment's (NASDAQ: AGNC) 13.5% yield is nearly three times that of the 10-Year Treasury, and the stock pays a monthly dividend. For those unfamiliar with AGNC, it is a mortgage real estate investment trust (REIT) that owns a leveraged portfolio of agency-backed mortgage-backed securities (MBS). Since its MBS investments are backed by government agencies, they carry little default risk. However, interest rates and narrowing and widening spreads between mortgage rates and 10-year Treasury yields can impact the underlying value of its portfolio.

Spreads tend to be the biggest driver of MBS performance and are currently sitting around 2 percentage points. That is below the 3 percentage points they shot to a few years ago, but it is still historically on the high side. With the Fed earlier this year starting to buy back $200 billion in agency MBS and net new MBS supply projected to drop this year, there are the elements in place for spreads to narrow, which would be bullish for AGNC. Overall, this makes it a relatively good environment to own the stock and to collect its juicy yield.

2. Energy Transfer

With a 6.3% yield, Energy Transfer (NYSE: ET) gives investors a higher payout than the 10-year Treasury. More importantly, though, the stock also offers strong upside price appreciation potential. The company is both one of the cheapest in the master limited partnership (MLP) space and has some of the best growth prospects. That's a great combination.

The company has one of the most extensive midstream systems in the U.S., led by its natural gas pipeline system. Its position in the Permian gives it access to cheap natural gas, and the company is seeing many growth opportunities tied to AI data center build-outs, rising electricity demand, and NGL (natural gas liquids) export demand. As a result, it plans to spend up to $5.9 billion on high-return growth projects this year.

Energy Transfer's distribution is well covered by its distributable cash flow (operating cash flow minus maintenance capital expenditures), coming in at a 2.2 time coverage ratio last quarter, and its balance sheet is in good shape. About 90% of its adjusted EBITDA comes from fee-based businesses, but it also has a strong track record of capturing bonus opportunities during energy market dislocations. Meanwhile, it plans to increase its distribution at a 3% to 5% annual pace moving forward.

This all makes Energy Transfer a great high-yield stock to own.

Verizon Communications

Verizon Communications' (NYSE: VZ) 5.6% yield is higher than the 10-year Treasury, and it is another stock that has some nice upside potential. The wireless carrier's strategic shift from being technology-centric to a more customer-focused model has been paying off with lower churn and more subscriber additions. This could be seen last quarter when it added 184,000 postpaid phone subscriptions, its best quarter number in five years.

Meanwhile, Verizon has tailwinds that could help drive its stock higher. The biggest is that it has now closed its acquisition of Frontier, which gives it a huge fiber network and a big bundling opportunity. In addition, the company should benefit from the wireless industry starting to move away from large subsidies, which should help improve margins, and from AI data center operators looking for fiber-optic cable networks to connect their data centers.

Verizon's dividend is well covered by its massive free cash flow, and its balance sheet is in great shape. With a growing dividend and a forward price-to-earnings (P/E) ratio of just 9.5 based on 2027 earnings estimates, this is a great dividend stock to buy.

Should you buy stock in AGNC Investment Corp. right now?

Before you buy stock in AGNC Investment Corp., consider this:

The Motley Fool Stock Advisor analyst team just identified what they believe are the 10 best stocks for investors to buy now… and AGNC Investment Corp. wasn’t one of them. The 10 stocks that made the cut could produce monster returns in the coming years.

Consider when Netflix made this list on December 17, 2004... if you invested $1,000 at the time of our recommendation, you’d have $421,997!* Or when Nvidia made this list on April 15, 2005... if you invested $1,000 at the time of our recommendation, you’d have $1,413,876!*

Now, it’s worth noting Stock Advisor’s total average return is 978% — a market-crushing outperformance compared to 213% for the S&P 500. Don't miss the latest top 10 list, available with Stock Advisor, and join an investing community built by individual investors for individual investors.

See the 10 stocks »

*Stock Advisor returns as of September 7, 2026.

Geoffrey Seiler has positions in Energy Transfer. The Motley Fool recommends Verizon Communications. The Motley Fool has a disclosure policy.

☐ ☆ ✇ The Motley Fool

Here's Why SoFi Isn't Reaching All-Time Highs After a Record Quarter

By: newsfeedback@fool.com (Matt Frankel, CFP®)

SoFi (NASDAQ: SOFI) reported second-quarter earnings that handily beat expectations and showed record highs for revenue, profitability, members, and cross-buying. In this video, I'll discuss why this hasn't produced new highs in the stock.

*Stock prices used were the morning prices of Sept. 3, 2026. The video was published on Sept. 6, 2026.

Missed Nvidia in 2009? This Rare Signal Is Flashing Again. In 2009, a "Double Down" signal flashed for a little-known chipmaker called Nvidia. For the first time in years, that same "Total Conviction" signal is flashing for a company 1/100th the size of Nvidia. Continue »

Should you buy stock in SoFi Technologies right now?

Before you buy stock in SoFi Technologies, consider this:

The Motley Fool Stock Advisor analyst team just identified what they believe are the 10 best stocks for investors to buy now… and SoFi Technologies wasn’t one of them. The 10 stocks that made the cut could produce monster returns in the coming years.

Consider when Netflix made this list on December 17, 2004... if you invested $1,000 at the time of our recommendation, you’d have $421,997!* Or when Nvidia made this list on April 15, 2005... if you invested $1,000 at the time of our recommendation, you’d have $1,413,876!*

Now, it’s worth noting Stock Advisor’s total average return is 978% — a market-crushing outperformance compared to 213% for the S&P 500. Don't miss the latest top 10 list, available with Stock Advisor, and join an investing community built by individual investors for individual investors.

See the 10 stocks »

*Stock Advisor returns as of September 7, 2026.

Matt Frankel, CFP® has positions in SoFi Technologies. The Motley Fool has no position in any of the stocks mentioned. The Motley Fool has a disclosure policy.

Matthew Frankel is an affiliate of The Motley Fool and may be compensated for promoting its services. If you choose to subscribe through their link they will earn some extra money that supports their channel. Their opinions remain their own and are unaffected by The Motley Fool.

☐ ☆ ✇ The Motley Fool

Boeing's Free Cash Flow Turned Positive. Here's What Has to Happen Next for the Turnaround to Stick.

By: newsfeedback@fool.com (Rich Smith)

Key Points

  • Boeing has delivered positive free cash flow in three of the past four quarters.

  • Analysts believe the aerospace giant might generate $15 billion in FCF by 2030.

  • Boeing's Commercial and Defense businesses are both contributing to the turnaround.

For six straight quarters, from the beginning of 2024 all the way through mid-2025, Boeing (NYSE: BA) stock couldn't catch a break. Production volumes were crippled in the wake of the Alaska Airlines door blowout, airplanes piled up, losses mounted, and free cash flow dried up. Every single quarter, Boeing lost money and burned cash -- $12.4 billion in total GAAP losses, and $16.8 billion in negative free cash flow.

But then, a miracle happened.

Missed Nvidia in 2009? This Rare Signal Is Flashing Again. In 2009, a "Double Down" signal flashed for a little-known chipmaker called Nvidia. For the first time in years, that same "Total Conviction" signal is flashing for a company 1/100th the size of Nvidia. Continue »

By mid-2025, Boeing had mostly righted the ship, stabilized its supply chain, and resolved its quality-control issues. Q2 2025 saw Boeing deliver more airplanes in a single quarter than it had ever done since 2018. Revenue rose, losses shrank, and by Q3 2025, free cash flow had turned positive again. While GAAP profitability has remained elusive since, in three of the past four quarters, the aerospace giant has generated positive free cash flow -- $631 million generated last quarter alone -- laying the groundwork for a return to consistent profitability in the future.

Now Boeing just needs to stick the landing.

Boeing 737.

Image source: Getty Images.

Boeing has a plan

After the Alaska Airlines debacle, the U.S. Federal Aviation Administration ordered Boeing to slow down production and ensure each plane was shipshape before delivery. Boeing was initially instructed to take its time and build no more than 38 of its 737 airliners per month, a limit later raised to 42 planes. The company is currently seeking permission to accelerate that rate to 47 planes per month, with plans to increase it to 52, and eventually 63, planes per month.

More planes produced should translate into more planes delivered -- and more cash collected on delivery. Analysts polled by S&P Global Market Intelligence forecast Boeing to generate more than $2.3 billion in free cash flow this year, growing to $6.2 billion in 2027, $9.8 billion in 2028, $13 billion in 2029, and $15 billion in 2030.

Yes, you read that right. Boeing's probably going to return to full-year positive FCF this year, grow that dramatically over the next five years, and even then still be growing free cash flow at a healthy 15% per year.

Assuming all goes as planned, Boeing is trading today at just 11 times its projected FCF five years from now.

What needs to happen next

What does Boeing need to do to make this happen? The good news here is that the issues that upset Boeing's apple cart last time around -- botched introduction of new products -- aren't likely to arise over the next five years, because Boeing doesn't plan to introduce any completely new "clean sheet" models during this period.

New variants of the 737 are undergoing flight tests and certification, however, as is a larger 777-9 airliner, and those have the potential to cause problems. But so long as Boeing keeps a tight focus on quality control, it should have a smooth flight from barely positive free cash flow today to massively profitable $15 billion annual FCF in 2030.

Key to this effort will be taking control over the company's Spirit Aerosystems subsidiary, its supplier of 737 fuselages -- and the company responsible for building the specific 737 that blew out over Oregon in 2024 -- and also turning that business profitable. As The Wall Street Journal reported last week, Boeing's $4.7 billion repurchase of Spirit last year actually cost Boeing closer to $10.3 billion once debt and obligations to perform "money pit" contracts are factored in.

This obstacle isn't insurmountable for a company that may soon make $15 billion a year in cash profit. More importantly, fixing Spirit's quality issues is key to Boeing being allowed to increase production to reach that $15 billion goal -- but it will be a near-term drag on financial results.

What else Boeing needs to do

And Boeing's to-do list doesn't end there; it doesn't end with the Commercial business.

As I pointed out last month, Boeing's defense business is once again profitable, and recently booked a major $131.2 billion contract to upgrade global F-15 fighter jet fleets. Once a headwind for Boeing, the defense business could now become a second tailwind as positive profit margins begin to turn a growing revenue stream into a second source of profit.

For this to play out perfectly, Boeing needs to avoid the temptation to underbid competitors to win big Pentagon projects, such as the 2011 KC-X Tanker project, which is still racking up losses to this day. Boeing should also probably abandon its ill-fated Starliner spacecraft program, which still isn't flying, and is looking increasingly obsolete as SpaceX works to make its Starship spacecraft operational.

So, what does Boeing need to do to ensure its turnaround sticks? Keep doing the things that make it money, and stop doing the things that lose it money. Ultimately, it's as simple as that.

Should you buy stock in Boeing right now?

Before you buy stock in Boeing, consider this:

The Motley Fool Stock Advisor analyst team just identified what they believe are the 10 best stocks for investors to buy now… and Boeing wasn’t one of them. The 10 stocks that made the cut could produce monster returns in the coming years.

Consider when Netflix made this list on December 17, 2004... if you invested $1,000 at the time of our recommendation, you’d have $421,997!* Or when Nvidia made this list on April 15, 2005... if you invested $1,000 at the time of our recommendation, you’d have $1,413,876!*

Now, it’s worth noting Stock Advisor’s total average return is 978% — a market-crushing outperformance compared to 213% for the S&P 500. Don't miss the latest top 10 list, available with Stock Advisor, and join an investing community built by individual investors for individual investors.

See the 10 stocks »

*Stock Advisor returns as of September 7, 2026.

Rich Smith has no position in any of the stocks mentioned. The Motley Fool has positions in and recommends Boeing. The Motley Fool has a disclosure policy.

☐ ☆ ✇ The Motley Fool

The Stock Market Is Flashing a Warning Seen Only 6 Times Since 1871, and History Is Crystal Clear That a Disaster Could Be Heading Toward Wall Street

By: newsfeedback@fool.com (Adam Spatacco)

Key Points

  • The CAPE ratio accounts for 10 years' worth of inflation-adjusted earnings, making it helpful for gauging long-term market trends.

  • While history suggests a correction could be on the horizon, timing is a key variable to consider.

  • CAPE readings that surpass 30 for months at a time always precede a sell-off.

There is a reason the S&P 500 (SNPINDEX: ^GSPC), Dow Jones Industrial Average (DJINDICES: ^DJI), and Nasdaq Composite (NASDAQINDEX: ^IXIC) are among the greatest wealth creation vehicles in financial history.

With indexes, you don't need to time the market or pick the next Nvidia (NASDAQ: NVDA). You also don't need to hop from gold to oil to real estate every time an economic outlook shifts. Over decades, owning productive businesses has been one of the most reliable passive ways to build wealth.

Missed Nvidia in 2009? This Rare Signal Is Flashing Again. In 2009, a "Double Down" signal flashed for a little-known chipmaker called Nvidia. For the first time in years, that same "Total Conviction" signal is flashing for a company 1/100th the size of Nvidia. Continue »

Simply put, companies generate earnings, reinvest capital, create new products, authorize share buybacks, and issue dividends, all while growing alongside the economy. This compounding effect is difficult for alternative assets to replicate over a long-term horizon.

With that said, investing in the stock market is not always smooth sailing. The catch is that the stock market can be an incredible source of wealth while also becoming unusually expensive from time to time. Right now, the price investors are paying for the stock market is the key variable to note.

People in suits, looking at screens on a trading floor.

Image source: Getty Images.

The stock market is doing something for only the sixth time in 155 years

On the surface, investors have plenty of reasons to be bullish as the major indexes hover around record highs. Artificial intelligence (AI) has unleashed an unprecedented capital spending cycle around data centers, graphics processing units (GPUs), networking, memory, power, and everything else needed to build out the AI infrastructure stack. There is a potential glitch in the AI machine, however.

Some investors are becoming increasingly concerned that new Federal Reserve Chairman Kevin Warsh could hike interest rates. The math tells us that if rates move higher, the cost of capital rises as well. This matters for an economy that's pouring hundreds of billions of dollars into AI infrastructure on an annual basis. Since the AI build-out is one of the core pillars supporting the current market rally, anything that threatens the capex cycle's pace could fuel a nasty repricing.

To be sure, I'm not personally distracted by monetary policy decisions. Instead, I am laser-focused on valuation, and so it's natural to immediately look at the price-to-earnings (P/E) ratio to determine whether a stock is expensive or reasonably valued. The problem with this approach is that P/E multiples can be noisy.

The reason is that a company's earnings can fall during a recession or be boosted by a temporary boom. This means that looking at just one year of earnings can give an incomplete picture of what a business is actually capable of earning during the course of a full economic cycle. This is where the CAPE ratio comes in.

The cyclically adjusted price-to-earnings (CAPE) ratio, or the Shiller P/E, smooths out valuation noise by measuring stock prices with average inflation-adjusted earnings over a 10-year horizon. This makes valuation readings less distorted by one unusually good or bad year.

CAPE readings have been backdated to 1871, giving investors 155 years of historical context. The average CAPE level during this period is about 17.8. Currently, the CAPE's reading of 41.1 is more than double its long-term average.

S&P 500 Shiller CAPE Ratio Chart

S&P 500 Shiller CAPE Ratio data by YCharts.

What happens when the CAPE ratio rises?

There have been six periods when the CAPE ratio sustained a reading of 30 or more for consecutive months during a broader bull market. Right now is one of those times. Let's see how the previous five periods played out.

  1. 1929: Stock prices peaked during the Roaring Twenties. For historians, what followed is obvious: the infamous 1929 crash and the devastating bear market that plagued the early 1930s.
  2. 1997 to 2001: During this period, the CAPE reached its all-time high of about 44 as the dot-com boom accelerated. The tech-heavy Nasdaq soared for years, proving that a frothy market can become even more expensive. The optimism, however, was largely supported by nothing more than hope and euphoria. Eventually, the bubble burst, and the Nasdaq dropped roughly 77% from its peak to trough.
  3. 2017 to 2018: The S&P 500 climbed for nearly a year before the market experienced a sharp sell-off during the fourth quarter of 2018.
  4. 2019 to 2020: Stocks were soaring heading into 2020. But within the first two months of the year, the S&P 500 stumbled into a brief bear market as the global economy effectively shut down due to the COVID-19 pandemic. Although the recovery was extraordinarily fast, the timing and scale of the initial decline were severe.
  5. 2020 to 2022: After the pandemic-driven crash, stock prices quickly recovered thanks to monetary stimulus and ultra-low interest rates. The rally eventually came to a halt when inflation peaked at about 9%, prompting the Fed to raise interest rates. The S&P 500 entered a bear market in 2022, and high-growth technology stocks in particular suffered deep losses.

What should investors do if the stock market crashes?

There is an important nuance in the analysis explored in this piece. Specifically, a CAPE ratio above 30 does not mean price will soon fall -- the market can remain expensive for a surprisingly long time. This is why valuation is best viewed as a warning light, not as a stop sign.

Although history suggests a disaster should follow an expensive market, it does not definitively tell us when such an event will occur. History also teaches investors that the stock market survives bubbles, recessions, wars, inflationary shocks, and financial crises -- always coming out the other side and reaching new highs.

^SPX Chart

^SPX data by YCharts.

This is the entire point of staying invested for the long haul. Investors can't control when a correction or crash will inevitably arrive. What they can control is how exposed they are when volatility comes. The biggest mistake an investor can make right now is to confuse an expensive market with a broken one. The same market that brings painful corrections also produces the recoveries that create long-term wealth.

It's a good idea to always keep some cash on hand instead of being 100% invested in stocks. By doing so, you can buy quality businesses at more attractive prices during a downturn. Trimming speculative positions while continuing to own high-quality businesses can help mitigate the blow should the market start to sell off. Diversifying to defensive plays outside the technology industry that has driven much of the market's recent rally is also a good way to hedge against dips in growth stocks.

Although a CAPE reading within shouting distance of all-time highs should make investors cautious about future returns, it shouldn't convince you that the stock market is headed for irreversible damage. Ultimately, the goal isn't to predict when a crash will happen. Rather, your goal should be to build a portfolio that can survive one, while anticipating when the next bull market inevitably begins.

Should you buy stock in S&P 500 Index right now?

Before you buy stock in S&P 500 Index, consider this:

The Motley Fool Stock Advisor analyst team just identified what they believe are the 10 best stocks for investors to buy now… and S&P 500 Index wasn’t one of them. The 10 stocks that made the cut could produce monster returns in the coming years.

Consider when Netflix made this list on December 17, 2004... if you invested $1,000 at the time of our recommendation, you’d have $421,997!* Or when Nvidia made this list on April 15, 2005... if you invested $1,000 at the time of our recommendation, you’d have $1,413,876!*

Now, it’s worth noting Stock Advisor’s total average return is 978% — a market-crushing outperformance compared to 213% for the S&P 500. Don't miss the latest top 10 list, available with Stock Advisor, and join an investing community built by individual investors for individual investors.

See the 10 stocks »

*Stock Advisor returns as of September 7, 2026.

Adam Spatacco has positions in Nvidia. The Motley Fool has positions in and recommends Nvidia. The Motley Fool has a disclosure policy.

☐ ☆ ✇ The Motley Fool

Here's Why This Friday Could Be One of the Most Critical Days for the Stock Market in September

By: newsfeedback@fool.com (Anthony Di Pizio)

Key Points

  • Inflation as measured by the Consumer Price Index has lately been well above the Federal Reserve's 2% target, so it might have to raise interest rates.

  • The August CPI numbers due out Friday could be key to the Fed's interest rate decision next week.

  • The last time the Fed was raising interest rates regularly, the S&P 500 fell by more than 20%.

The Consumer Price Index (CPI) measures U.S. inflation by tracking the changes in the aggregate price of a basket of goods and services over time. The latest data is released monthly by the U.S. Bureau of Labor Statistics, and the Federal Reserve closely analyzes it to inform its decisions on whether to hike, hold, or cut the federal funds rate -- the interest rate it charges banks for overnight loans. That rate influences a host of other interest rates across the economy.

In July, the CPI increased by 3.4% year over year, so inflation remains significantly above the Fed's long-established target rate of 2%. The central bank would normally hike interest rates in this situation, so Wall Street is on edge ahead of the Federal Open Market Committee's next policy meeting on Sept. 15 and 16.

Missed Nvidia in 2009? This Rare Signal Is Flashing Again. In 2009, a "Double Down" signal flashed for a little-known chipmaker called Nvidia. For the first time in years, that same "Total Conviction" signal is flashing for a company 1/100th the size of Nvidia. Continue »

On Thursday, Fed Governor Christopher Waller said the next interest rate decision could hinge on the August CPI report, which will be released on Friday, Sept. 11, at 8:30 a.m. ET. An interest rate hike might be on the table if the inflation reading is higher than expected, and if history is any guide, that would be bad news for the stock market.

A person at the peak of a roller coaster, preparing for a rapid descent.

Image source: Getty Images.

Soaring oil prices are stoking inflation

Energy prices are among the most important components of the CPI. The price of a barrel of oil significantly influences the costs of transporting goods by truck, boat, and plane, which in turn affects how much consumers pay for groceries and retail products. At the start of 2026, a single barrel of West Texas Intermediate crude oil traded for $57.42, but due to the war between the U.S. and Iran, prices surged above $100 a barrel this spring, and after a brief retreat this summer have rocketed back to over $90 in September.

When the conflict started in late February, Iran effectively closed the Strait of Hormuz, a key waterway through which roughly 25% of the world's seaborne oil previously traveled each day. Despite intermittent peace talks, the Strait of Hormuz remains mostly closed to commercial ships, so the upward pressure on energy prices isn't going away anytime soon.

The U.S. has been tapping its Strategic Petroleum Reserve to partially offset the falling global oil supply and rising crude prices, but it now sits at a 44-year low. With just 40% of its capacity remaining, the government will soon have to end that temporary stopgap measure, which could lead to a sharp spike in energy costs for American consumers and businesses.

The energy component of the CPI calculation surged by a whopping 14.7% year over year in July, and the gasoline component specifically soared by 24.6%. Therefore, it's clear that rising oil prices are having a significant impact on the inflation numbers overall.

To get a rough idea of where future CPI readings might be heading, we can look at the Producer Price Index (PPI) -- a different inflation metric that tracks the changes in input costs for businesses. (Those costs are often passed along to consumers, but at a time lag.) In July, the PPI jumped by 4.7% year over year, and the energy component was up by 18.2%.

Interestingly, oil prices have moved even higher since the July PPI report was released, so we can safely assume energy placed even more upward pressure on inflation in August.

According to the CME Group's (NASDAQ: CME) FedWatch tool, which analyzes the 30-day fed funds futures market to predict potential interest rate moves, Wall Street thinks there is a 50% chance the Fed will hike rates at the September meeting. That probability could spike if this Friday's CPI numbers are hotter than expected.

Rising interest rates are typically bad news for stocks

The Fed's last campaign of interest rate hikes started in March 2022 and ended in August 2023, when the central bank was trying to tame an 8% CPI. The S&P 500 index plunged by more than 20% from its peak during that 18-month hiking cycle, putting Wall Street into a bear market.

^SPX Chart

^SPX data by YCharts.

Rising interest rates are bad for stocks for a few reasons. First, they force consumers to allocate more of their household budgets to debt repayments, leaving them with less money for discretionary spending. Second, businesses have less borrowing power when rates are higher, so they can't invest as aggressively in growth.

Third, rising interest rates increase the yields on low-risk assets like U.S. Treasury bonds, giving investors some very attractive alternatives to the stock market.

I'm not suggesting one interest rate hike will plunge the S&P 500 into bear territory, but it could certainly spark a shift in sentiment, particularly because of the index's high valuation. The Shiller Cyclically Adjusted Price-to-Earnings (CAPE) ratio -- a broad measurement of the entire market's valuation -- is currently 41.2. The only period in history during which it reached higher levels was at the peak of the dot-com bubble in 2000.

Therefore, many investors might be tempted to take some money off the table if they see trouble on the horizon, which is why Friday's CPI report will be so critical.

Should you buy stock in S&P 500 Index right now?

Before you buy stock in S&P 500 Index, consider this:

The Motley Fool Stock Advisor analyst team just identified what they believe are the 10 best stocks for investors to buy now… and S&P 500 Index wasn’t one of them. The 10 stocks that made the cut could produce monster returns in the coming years.

Consider when Netflix made this list on December 17, 2004... if you invested $1,000 at the time of our recommendation, you’d have $421,997!* Or when Nvidia made this list on April 15, 2005... if you invested $1,000 at the time of our recommendation, you’d have $1,413,876!*

Now, it’s worth noting Stock Advisor’s total average return is 978% — a market-crushing outperformance compared to 213% for the S&P 500. Don't miss the latest top 10 list, available with Stock Advisor, and join an investing community built by individual investors for individual investors.

See the 10 stocks »

*Stock Advisor returns as of September 7, 2026.

Anthony Di Pizio has no position in any of the stocks mentioned. The Motley Fool has positions in and recommends CME Group. The Motley Fool has a disclosure policy.

☐ ☆ ✇ The Motley Fool

Not a Crash, Not a Correction: What the September Effect Really Means for Artificial Intelligence (AI) Chip Stocks

By: newsfeedback@fool.com (Adam Spatacco)

Key Points

  • Over the last several decades, the S&P 500, Nasdaq Composite, and Dow Jones Industrial Average have averaged negative returns during September.

  • Artificial intelligence (AI) chip stocks had mixed performances during the last three Septembers.

  • Chip-themed ETFs offer a compelling way to invest in semiconductor stocks without picking individual names.

Wall Street has a habit of turning the occasional quirk into full-blown folklore, and few stories get recycled as hard as the September Effect. Every year around Labor Day, the same storyline makes its way into the headlines: Money managers come back from vacation, they start rebalancing their funds, and stocks subsequently take a hit.

For most of the market, this pattern brings unwanted selling pressure. For names that have already run hot for years, namely artificial intelligence (AI) chip stocks, it can feel like someone purposely yanked the rug from underneath things.

Missed Nvidia in 2009? This Rare Signal Is Flashing Again. In 2009, a "Double Down" signal flashed for a little-known chipmaker called Nvidia. For the first time in years, that same "Total Conviction" signal is flashing for a company 1/100th the size of Nvidia. Continue »

The question right now isn't whether the September Effect actually exists. It's whether they will deliver a lasting punch while the market leans hard on semiconductor leaders like Nvidia (NASDAQ: NVDA), Broadcom (NASDAQ: AVGO), Advanced Micro Devices (NASDAQ: AMD), and a handful of other silicon darlings.

Smiling person at desk, beside computers displaying charts.

Image source: Getty Images.

What does the September Effect actually look like?

Over the long haul, September is the only month that features a negative average return. Since 1928, the S&P 500 (SNPINDEX: ^GSPC) has lost 1.1% on average during the month of September and finished lower roughly 56% of the time. Meanwhile, the Nasdaq Composite (NASDAQINDEX: ^IXIC) has dropped 0.9% on average since its inception in 1971. What's interesting is that the Nasdaq has actually finished in the green 52% of the time, but the ugly years drag the index's long-term September average below zero.

The Dow Jones Industrial Average (DJINDICES: ^DJI) isn't any prettier. Since 1897, the Dow has dropped 1.1% on average during September and finished the month positive only 42% of the time.

As you can see, not every September is a bloodbath for stocks. Nevertheless, the pattern is consistent enough that traders treat this month as a legitimate seasonal headwind rather than a coincidence. The usual explanations are pretty straightforward: Portfolio managers rebalance after summer and get a head start on tax-loss harvesting. From there, it's just a self-fulfilling prophecy once enough investors decide to get defensive and rotate out of growth and into areas like consumer staples and utilities.

How have AI chip stocks performed during the September Effect?

The AI revolution includes a small number of September Effects so far: 2023, 2024, and 2025. To see how semiconductor stocks fared during these periods, I'll benchmark the category leaders against two popular chip-themed exchange-traded funds (ETFs).

The VanEck Semiconductor ETF (NASDAQ: SMH) is a concentrated basket of 26 chip names. Nvidia is the 800-pound gorilla, comprising roughly 23% of the fund. Other major holdings include Taiwan Semiconductor Manufacturing, Broadcom, Micron Technology, AMD, and ASML. The iShares Semiconductor ETF (NASDAQ: SOXX) is built around 30 AI chip stocks, including Nvidia, Micron, Intel, Marvell Technology, and Applied Materials.

In September 2023, both SMH and SOXX dropped about 7%. While that's pretty ugly, it beat Nvidia's decline of 10% and was on par with TSMC, AMD, and Marvell. In September 2024, both ETFs finished the month flat. While this underperformed the positive performances of major AI chip stocks, it was also insulated from the losses seen in select laggards.

Last year, the VanEck Semiconductor ETF gained 12% in September while the iShares Semiconductor ETF soared 11%. As you'd expect, the broader chip complex sported much higher gains.

SOXX Chart

Data by YCharts.

The lesson here is straightforward: Individual chip stocks can move much higher or much lower relative to a basket of stocks. These ETFs give investors exposure to the same AI chip theme, but come with less of the whiplash from single stocks.

Will the stock market correct this September?

The analysis in this piece is meant to drive home the point that September has never been a reliable signal that a correction or crash is on the way. At best, it is a seasonal phenomenon that sometimes shows up and drags the market down. The last two years proved that strong earnings, falling interest rates, and insatiable demand for AI compute can overpower the historical pattern.

Investors need to accept that AI chip stocks are growth names with frothy valuations and high liquidity. When the market gets uneasy, stocks that previously rallied hard are precisely the ones that get sold first. This is not the same thing as a fracture in the AI infrastructure thesis. Data center build-outs are accelerating, hyperscalers are investing in custom ASICs, and memory demand is not going away just because September arrived.

The practical move is not to dump all of your chip stocks this month. Instead, you need to decide how much volatility you can actually tolerate. If you own individual stocks, size them in such a way that a 10% drop doesn't force you to panic-sell.

If you want to participate in the AI chip theme without the risks that come with picking individual stocks, SMH and SOXX offer compelling upside while keeping downside pressure relatively insulated.

Remember, the market's worst month has a history of being followed by better ones -- I'm looking at you, Santa Claus rally! While the September Effect is real enough to respect, it should not be influential enough to dictate decisions that can affect your portfolio for the rest of the year.

Should you buy stock in iShares Trust - iShares Semiconductor ETF right now?

Before you buy stock in iShares Trust - iShares Semiconductor ETF, consider this:

The Motley Fool Stock Advisor analyst team just identified what they believe are the 10 best stocks for investors to buy now… and iShares Trust - iShares Semiconductor ETF wasn’t one of them. The 10 stocks that made the cut could produce monster returns in the coming years.

Consider when Netflix made this list on December 17, 2004... if you invested $1,000 at the time of our recommendation, you’d have $421,997!* Or when Nvidia made this list on April 15, 2005... if you invested $1,000 at the time of our recommendation, you’d have $1,413,876!*

Now, it’s worth noting Stock Advisor’s total average return is 978% — a market-crushing outperformance compared to 213% for the S&P 500. Don't miss the latest top 10 list, available with Stock Advisor, and join an investing community built by individual investors for individual investors.

See the 10 stocks »

*Stock Advisor returns as of September 7, 2026.

Adam Spatacco has positions in Nvidia. The Motley Fool has positions in and recommends ASML, Advanced Micro Devices, Applied Materials, Broadcom, Intel, Marvell Technology, Micron Technology, Nvidia, Taiwan Semiconductor Manufacturing, and iShares Trust-iShares Semiconductor ETF. The Motley Fool has a disclosure policy.

☐ ☆ ✇ The Motley Fool

The Stock Market Just Did Something For the 3rd Time in Over 100 Years. If History Is Any Guide, Prepare For This to Come Next.

By: newsfeedback@fool.com (Brett Schafer)

Key Points

  • Using cyclically adjusted earnings, stocks look very expensive today.

  • The only other times in history stocks reached this valuation level were before the Great Depression and the dot-com bubble.

  • Diversification is the key to strong performance through the market cycle.

Earnings per share (EPS) for the S&P 500 grew at 52% year over year in second-quarter 2026, according to FactSet estimates -- one of the fastest rates of growth in market history. It is also unsustainable.

Big tech companies are benefiting from reported earnings gains from artificial intelligence (AI), which are dragging down free cash flow, while also marking up stakes in start-ups and recent IPOs like SpaceX, which is inflating S&P 500 earnings power.

Missed Nvidia in 2009? This Rare Signal Is Flashing Again. In 2009, a "Double Down" signal flashed for a little-known chipmaker called Nvidia. For the first time in years, that same "Total Conviction" signal is flashing for a company 1/100th the size of Nvidia. Continue »

The market now trades at a forward price-to-earnings ratio (P/E) under 20, which does not look unreasonable. However, if you take a more comprehensive look at the cyclically adjusted P/E ratio (CAPE), this stock market has done something that has only happened twice before.

History suggests that trouble happens next.

One long bull market since 2009

The cyclically adjusted P/E ratio, otherwise known as the CAPE ratio, takes the current price of the S&P 500 index and divides it by the average earnings power of the index over the last 10 years. It does this to smooth out the bumps in earnings from any one year, such as 2026, when earnings power may be temporarily inflated.

The CAPE ratio has been above 30 for most of the last 10 years, and recently hit a new high above 41. The only other time in history the CAPE ratio was above 40 was the dot-com bubble in 1999. The only other time it was above 30? 1929, the peak of the bull market before the onset of the Great Depression.

A small data set is not going to be statistically relevant, and the stock market is a highly complex system, but I think it should be a flashing alarm to investors that the only other times in history that the CAPE ratio went above 30 were eventually followed by a collapse in stock prices.

A person looking at a computer screen with a shocked look on their face.

Image source: Getty Images.

Are AI stocks in a bubble?

This historical evidence should raise the question of whether AI stocks are now in a bubble. It certainly feels frothy, with trillions of dollars in stock market value centered on AI stocks and AI supply chain stocks, such as semiconductors.

AI stocks exhibit characteristics similar to booms and busts in the history of the United States, such as those of railroads, electricity, automobiles, and radios. It didn't matter that the internet changed our lives, but when you price in growth decades before the fundamentals catch up, your share prices are in a precarious spot.

No investor should boldly predict that a stock market crash will happen tomorrow. Nothing in markets is 100% certain. It's possible that the CAPE ratio will keep climbing before the eventual fall, or that the productivity gains from AI will make the tens of trillions in stock market gains worthwhile from an earnings perspective. However, any investor needs to understand the possibility that AI stocks are in a bubble. It doesn't matter how much you use ChatGPT.

S&P 500 Shiller CAPE Ratio Chart

S&P 500 Shiller CAPE Ratio data by YCharts.

How to properly position your portfolio

So, what is an investor to do? First, if you are heavily positioned in AI stocks, now might be the time to diversify (especially if you are trading on margin). This does not mean you need to immediately dump all your AI stocks. A lot of these are high-quality businesses that may perform well over the long term, even if it is possible they'll fall 80% in a stock market crash.

Diversification is key for anyone looking to generate strong returns in the stock market through the cycle. With the CAPE ratio near an all-time high, smart investors should look to add stocks from different sectors to their portfolios, as well as some fixed income like Treasury bonds that will help them generate strong performance through any booms and busts.

Should you buy stock in S&P 500 Index right now?

Before you buy stock in S&P 500 Index, consider this:

The Motley Fool Stock Advisor analyst team just identified what they believe are the 10 best stocks for investors to buy now… and S&P 500 Index wasn’t one of them. The 10 stocks that made the cut could produce monster returns in the coming years.

Consider when Netflix made this list on December 17, 2004... if you invested $1,000 at the time of our recommendation, you’d have $421,997!* Or when Nvidia made this list on April 15, 2005... if you invested $1,000 at the time of our recommendation, you’d have $1,413,876!*

Now, it’s worth noting Stock Advisor’s total average return is 978% — a market-crushing outperformance compared to 213% for the S&P 500. Don't miss the latest top 10 list, available with Stock Advisor, and join an investing community built by individual investors for individual investors.

See the 10 stocks »

*Stock Advisor returns as of September 7, 2026.

Brett Schafer has no position in any of the stocks mentioned. The Motley Fool has no position in any of the stocks mentioned. The Motley Fool has a disclosure policy.

☐ ☆ ✇ The Motley Fool

How Much Would You Need in Realty Income (O) Stock to Collect $500 a Month in Dividends?

By: newsfeedback@fool.com (Selena Maranjian)

Key Points

Anyone seeking dividend income should check out Realty Income (NYSE: O).

It's a real estate investment trust (REIT) -- a company that owns lots of real estate properties, leasing them out to tenants. Since REITs are required to pay out at least 90% of their taxable earnings as dividends, they tend to sport meaningful dividend payouts, and their yields tend to be higher than the average stock.

Missed Nvidia in 2009? This Rare Signal Is Flashing Again. In 2009, a "Double Down" signal flashed for a little-known chipmaker called Nvidia. For the first time in years, that same "Total Conviction" signal is flashing for a company 1/100th the size of Nvidia. Continue »

Realty Income's dividend yield these days is hovering around 5.3%.

The Realty Income logo against a red background.

Image source: The Motley Fool.

Let's say you want $500 per month ($6,000 annually) in dividend income from Realty Income. How many shares should you buy? Well, its recent monthly payout was $0.271. So divide $500 by that and you'll get 1,845 shares. At a recent share price of $62, those shares would cost you $114,390.

Why invest in Realty Income?

There are multiple reasons to consider buying Realty Income. For example:

  • That fat dividend will grow over time, and it is paid monthly, not quarterly.
  • The stock's valuation is attractive, with a recent forward-looking price-to-earnings (P/E) ratio of 35, below the five-year average of 40, and a recent price-to-sales ratio of 9.6, below the five-year average of 10.5.
  • If you're worried about the stock market crashing this year, Realty Income has a low beta of 0.72, meaning that it tends to rise or fall less than the overall market. So if the S&P 500 drops by, say, 10%, Realty Income's stock might fall by around 7.2%, based on past performance.
  • It owns approximately 15,500 leased properties across all 50 states and parts of Europe, and they span 92 industries. That diversity is important.
  • It employs triple-net leases, which require tenants to cover real estate taxes, property insurance, and operating expenses. That keeps things simple for the company and reduces its risk.
  • Its portfolio occupancy level was recently 98.8% and has never been below 96%.
  • It's looking to juice its growth via data centers. It's partnering with other companies to develop data centers.

Give this solid dividend payer a closer look if you're seeking income.

Should you buy stock in Realty Income right now?

Before you buy stock in Realty Income, consider this:

The Motley Fool Stock Advisor analyst team just identified what they believe are the 10 best stocks for investors to buy now… and Realty Income wasn’t one of them. The 10 stocks that made the cut could produce monster returns in the coming years.

Consider when Netflix made this list on December 17, 2004... if you invested $1,000 at the time of our recommendation, you’d have $421,997!* Or when Nvidia made this list on April 15, 2005... if you invested $1,000 at the time of our recommendation, you’d have $1,413,876!*

Now, it’s worth noting Stock Advisor’s total average return is 978% — a market-crushing outperformance compared to 213% for the S&P 500. Don't miss the latest top 10 list, available with Stock Advisor, and join an investing community built by individual investors for individual investors.

See the 10 stocks »

*Stock Advisor returns as of September 7, 2026.

Selena Maranjian has positions in Realty Income. The Motley Fool has positions in and recommends Realty Income. The Motley Fool has a disclosure policy.

☐ ☆ ✇ The Motley Fool

Where Will Tesla Be in 5 Years?

By: newsfeedback@fool.com (Neil Patel)

Key Points

  • Based on the stock’s immediate reaction, Tesla's Cybercab launch on Sept. 3 failed to impress investors.

  • When it comes to robotaxi and humanoid robotics, the timing and magnitude of the potential financial impact are complete unknowns.

  • The EV stock’s nosebleed valuation, reflective of rosy expectations, sets prospective investors up for subpar performance.

In typical fashion, Tesla (NASDAQ: TSLA) has been an extremely volatile stock to own in the past five years. During this time, the share price fell at least 30% on three separate occasions.

But unlike historical trends, this electric vehicle (EV) stock has underperformed the S&P 500 index over the trailing half decade. It's up only 54% during this time (as of Sept. 4), while the benchmark has climbed 71%.

Missed Nvidia in 2009? This Rare Signal Is Flashing Again. In 2009, a "Double Down" signal flashed for a little-known chipmaker called Nvidia. For the first time in years, that same "Total Conviction" signal is flashing for a company 1/100th the size of Nvidia. Continue »

This business continues to live in the spotlight, which will certainly result in persistently heightened volatility for investors to deal with. Where will Tesla be in five years?

Tesla logo on red filter with Cybercab in background.

Image source: The Motley Fool.

Dreams are better than reality

On Sept. 3, Tesla held an invite-only event launching its much-hyped Cybercab vehicle. The car design, which comes with no pedals and no steering wheel, was revealed nearly two years ago in October 2024. However, the company finally introduced a small number of Cybercabs to its Austin robotaxi fleet. There are 250 vehicles in the total robotaxi fleet (also including model Y's) that Tesla operates both in Texas and Florida.

As of this writing on the morning of Sept. 4 just after the market open, shares are down 6%. Investors initially appear to be disappointed by this news.

The latest event perfectly highlights what being a Tesla shareholder feels like. So far, the business has been defined not by its current operations, but by the possibility of outsized success in the future. New product or service announcements need to wow the followers. When they don't, there can be volatility.

Even though the stock has lagged the broader index in the past five years, the company sports a $1.1 trillion market capitalization, making it one of the most valuable enterprises on Earth. The market values shares based mostly on the narrative. For Tesla, the dreams of what it could become hold more weight than the reality on the ground.

But this can only last for as long as the market remains patient. The stock's dip might be an early warning that the investment community wants tangible results sooner rather than later.

Driving uphill on a steep road

Let's assume that in five years, Tesla shows notable progress in its two most important areas: robotaxi and humanoid robotics. For the robotaxi, this means expanding into many more markets across the country and even internationally. For the humanoid robotics, it means increasing production capacity, selling to enterprise customers, and possibly selling to consumers as well.

I believe Tesla bulls would view this outcome favorably. This optimistic scenario, though, might fail to lift the stock enough to outperform the S&P 500 index.

Of Tesla's $28.2 billion in second-quarter revenue, virtually nothing comes from robotaxi and robotics. I'd bet that in five years, the majority of the company's sales will still come from EVs. Even with technological progress being made, which is what the market wants, it could be some time until these ambitious projects move the financial needle in a meaningful way.

History says that this is the case with Tesla. The market is captivated by the story. But reaching milestones takes longer than expected.

This "Magnificent Seven" stock currently trades at around $353. According to consensus analyst estimates, Tesla will report earnings per share of $1.77 this year. Assuming this figure rises to $8.85 in 2031, a 400% gain, shares still trade today at a steep valuation of 40 times that extremely rosy forecast five years from now. Skyrocketing profits aren't enough.

Not even the smartest analysts can confidently predict what this business will look like in the future, adding tremendous uncertainty. Tesla could end up making good on all its promises. However, the timing and magnitude of the financial impact is a huge unknown. And the valuation shows that the stock is priced for perfection.

Investors who buy Tesla shares today shouldn't be surprised if the return disappoints between now and 2031.

Don’t miss this second chance at a potentially lucrative opportunity

Ever feel like you missed the boat in buying the most successful stocks? Then you’ll want to hear this.

On rare occasions, our expert team of analysts issues a “Double Down” stock recommendation for companies that they think are about to pop. If you’re worried you’ve already missed your chance to invest, now is the best time to buy before it’s too late. And the numbers speak for themselves:

  • Nvidia: if you invested $1,000 when we doubled down in 2009, you’d have $598,219!*
  • Apple: if you invested $1,000 when we doubled down in 2008, you’d have $61,037!*
  • Netflix: if you invested $1,000 when we doubled down in 2004, you’d have $421,997!*

Right now, we’re issuing “Double Down” alerts for three incredible companies, available when you join Stock Advisor, and there may not be another chance like this anytime soon.

See the 3 stocks »

*Stock Advisor returns as of September 7, 2026.

Neil Patel has no position in any of the stocks mentioned. The Motley Fool has positions in and recommends Tesla. The Motley Fool has a disclosure policy.

☐ ☆ ✇ The Motley Fool

Social Security’s 2027 COLA Forecast Just Got Smaller. But There Is Good News for Retirees.

By: newsfeedback@fool.com (Trevor Jennewine)

Key Points

  • The Senior Citizens League recently lowered its 2027 cost-of-living adjustment (COLA) forecast to 3.6%, down from its previous estimate of 3.9%.

  • Social Security's COLAs are calculated based on the CPI-W, a metric that critics argue does not accurately track inflation for retired workers.

  • Social Security benefits have arguably lost buying power in each of the last three years, but the latest inflation data suggests that trend could end in 2027.

Each October, the Social Security Administration announces the cost-of-living adjustment (COLA) for the subsequent year. COLAs are designed to ensure benefit payments increase in lockstep with inflation, thereby preserving the purchasing power of Social Security.

The Senior Citizens League (TSCL) recently revised its 2027 COLA forecast lower. Despite the downward revision, there is some good news for retired workers on Social Security. Here are the important details.

Missed Nvidia in 2009? This Rare Signal Is Flashing Again. In 2009, a "Double Down" signal flashed for a little-known chipmaker called Nvidia. For the first time in years, that same "Total Conviction" signal is flashing for a company 1/100th the size of Nvidia. Continue »

U.S. currency pictures with Social Security cards.

Image source: Getty Images.

TSCL estimates Social Security's 2027 COLA will be 3.6%

The Senior Citizens League (TSCL) is a nonpartisan advocacy group focused on issues that impact seniors, especially Medicare and Social Security. TSCL conducts surveys and publishes reports, but the group is best known for its forecasts concerning Social Security's annual cost-of-living adjustments (COLAs).

Each month, TSCL updates its Social Security COLA forecast for the upcoming year based on a statistical model that incorporates known inflation data from the Consumer Price Index (CPI) as well as projected inflation data based on interest rates and unemployment.

In May, TSCL said Social Security's 2027 COLA would be 3.9%. But that number was based on the incorrect assumption that CPI inflation would continue to rise as the energy shock tied to the Iran war drove prices up across the economy. In reality, CPI inflation has moderated since May despite the ongoing conflict in the Middle East.

In August, TSCL adjusted its 2027 COLA forecast down to 3.6% to account for new inflation data. While that is modestly below estimates made in the preceding months, it would still be 0.8 percentage points higher than the 2026 COLA and it would represent the largest percent increase in benefits since 2023.

The chart below shows how a hypothetical 3.6% COLA in 2027 would impact the average Social Security benefit paid to retired workers, spouses, survivors, and disabled workers.

Benefit Type Average Benefit (Before 3.6% COLA) Average Benefit (After 3.6% COLA) Additional Monthly Income
Retired Workers $2,086 $2,161 $75
Spouses $987 $1,023 $36
Survivors $1,635 $1,694 $59
Disabled Workers $1,635 $1,694 $59

Data source: Social Security Administration. The chart shows the average monthly Social Security benefit before and after a hypothetical 3.6% COLA in 2027.

On the surface, TSCL reducing its COLA forecast from 3.9% to 3.6% seems like bad news. It means retired workers on Social Security will receive less additional benefit income next year than originally anticipated. However, that bad news comes with an important silver lining.

Social Security benefits are on pace to maintain their purchasing power next year

Social Security's annual COLAs are based on a subset of the Consumer Price Index known as the CPI-W, which tracks price increases based on the spending habits of workers who live in urban households where at least half of total income comes from clerical or wage occupations.

In other words, CPI-W tracks inflation based on how working-age adults spend money. But critics argue the metric should not be used for Social Security's COLAs because workers generally spend money differently than retired workers. In particular, retirees typically spend more on housing and medical care, which means the CPI-W puts too little weight on those spending categories.

What's the solution? Critics of the CPI-W usually prefer another subset of the CPI known as the CPI-E, which tracks inflation based on the spending habits of individuals aged 62 and older. CPI-E inflation outpaced CPI-W inflation by 0.7 percentage points annually over the last three years, which arguably means Social Security benefits lost more than 2% of their purchasing power during that period.

However, CPI-E inflation is currently running even with CPI-W inflation in 2026. If that trend holds through September -- inflation data from July, August, and September is used to determine the official COLA -- 2027 will be the first year in which Social Security at least maintains its purchasing power since 2023. That's good news for retirees, despite the recent downward revision in TSCL's COLA forecast.

The $23,760 Social Security bonus most retirees completely overlook

If you're like most Americans, you're a few years (or more) behind on your retirement savings. But a handful of little-known "Social Security secrets" could help ensure a boost in your retirement income.

One easy trick could pay you as much as $23,760 more... each year! Once you learn how to maximize your Social Security benefits, we think you could retire confidently with the peace of mind we're all after. Join Stock Advisor to learn more about these strategies.

View the "Social Security secrets" »

The Motley Fool has a disclosure policy.

☐ ☆ ✇ The Motley Fool

Rocket Lab's Neutron Just Slipped Again. Here's the Only Date That Still Matters for Shareholders.

By: newsfeedback@fool.com (Rich Smith)

Key Points

  • Rocket Lab's Neutron rocket may not launch until 2027.

  • Also happening in 2027 is something even more important: Rocket Lab will acquire Iridium Communications.

  • With Iridium in-house, Rocket Lab will become profitable and free cash flow-positive.

Uh-oh. Here we go again!

It's been nearly five years since Sir Peter Beck, the founder and CEO of Rocket Lab (NASDAQ: RKLB), announced plans to build a Neutron rocketship in 2020. The 43-meter-tall craft, incorporating an expendable second stage within a reusable first stage, can carry 13 tons of cargo to Low Earth Orbit -- 43 times the payload of Rocket Lab's current Electron rocket.

Missed Nvidia in 2009? This Rare Signal Is Flashing Again. In 2009, a "Double Down" signal flashed for a little-known chipmaker called Nvidia. For the first time in years, that same "Total Conviction" signal is flashing for a company 1/100th the size of Nvidia. Continue »

Assuming, that is to say, it ever launches.

Rocket Lab, you see, has been promising to launch Neutron for years -- first positing a 2024 launch date, then "mid-2025," followed by late 2025, Q1 2026, and most recently late 2026. Last month, the deadline slipped yet again when Beck told investors on a conference call he was targeting "delivery of Neutron to the pad in Q4 2026."

That sounds like a reiteration of the late 2026 goal. Unfortunately, delivering the rocket to the pad is just the first step. Next follows a series of pre-launch tests preceding the actual launch.

And as a result, it's entirely possible we won't see Neutron take off before 2027.

Artist's impression of Rocket Lab Flatellite spacecraft loaded into a Neutron launch vehicle fairing.

Image source: Rocket Lab.

"An-ti-ci-pa-tion, anticipa-yay-shun! [Rocket Lab's] making us wait"

As you can imagine, investors in Rocket Lab stock are getting just a wee bit impatient with all the delays. And Rocket Lab stock is down 24% in the past two weeks, or nearly $20 per share.

The distress is understandable. (Still, one imagines they'd be even more upset if Rocket Lab moved too fast and launched a rocket that blew up!) Bearing that in mind, here's another date that Rocket Lab investors might want to focus on instead, just in case Rocket Lab has to delay launch yet again:

June 30, 2027.

What happens on June 30, 2027?

Three months ago, Rocket Lab announced it would acquire iconic satellite communications company Iridium Communications (NASDAQ: IRDM) in an $8 billion deal slated to close in "mid-2027."

Granted, that deadline's a bit fuzzy. But June 30, 2027, is about as close to mid-2027 as one can get, so that's the date I'm hoping we will see Iridium officially become part of Rocket Lab. And why is this important?

Why Iridium is important to Rocket Lab

Neutron is great and all, don't get me wrong. I'm personally looking forward to seeing it fly -- maybe even in person!

But as an investor, I realize that even the $50 million in revenue Neutron will bring to Rocket Lab with each flight, with 44% gross margins, pales in significance to the $884 million in annual revenue -- with 72% gross profit margins, according to data from S&P Global Market Intelligence -- that Rocket Lab will receive once it acquires Iridium.

Analysts forecast that in 2027, Iridium will earn more than $135 million in GAAP profit and generate more than $313 million in positive free cash flow. That's enough profit and cash to offset all the losses and cash burn at Rocket Lab, and turn Rocket Lab instantly profitable and free cash flow-positive -- a full year before Wall Street analysts anticipated that would happen.

To me, this makes June 30, 2027, the date to watch. Assuming Rocket Lab can close the deal on time, it'll be a much more attractive investment on that date -- with Neutron or without it.

Don’t miss this second chance at a potentially lucrative opportunity

Ever feel like you missed the boat in buying the most successful stocks? Then you’ll want to hear this.

On rare occasions, our expert team of analysts issues a “Double Down” stock recommendation for companies that they think are about to pop. If you’re worried you’ve already missed your chance to invest, now is the best time to buy before it’s too late. And the numbers speak for themselves:

  • Nvidia: if you invested $1,000 when we doubled down in 2009, you’d have $598,219!*
  • Apple: if you invested $1,000 when we doubled down in 2008, you’d have $61,037!*
  • Netflix: if you invested $1,000 when we doubled down in 2004, you’d have $421,997!*

Right now, we’re issuing “Double Down” alerts for three incredible companies, available when you join Stock Advisor, and there may not be another chance like this anytime soon.

See the 3 stocks »

*Stock Advisor returns as of September 7, 2026.

Rich Smith has positions in Rocket Lab. The Motley Fool has positions in and recommends Rocket Lab. The Motley Fool has a disclosure policy.

☐ ☆ ✇ The Motley Fool

A Once-in-a-Decade Opportunity: 1 Magnificent S&P 500 Stock Down 41% to Buy Right Now

By: newsfeedback@fool.com (Josh Kohn-Lindquist)

Key Points

  • SaaS company Tyler Technologies provides mission-critical solutions to government agencies.

  • Due to the regulations about how governments must handle their data, AI isn't likely to disrupt Tyler's business.

  • The company has been buying back its shares at decade-low valuations.

Over the course of 2026, the market has swung from a "SaaSpocalypse" panic that pushed software-focused exchange-traded funds (ETFs) down by roughly 30% to a recognition that artificial intelligence (AI) could be a boon for the same companies it was previously expected to demolish.

However, despite this sell-off and subsequent rebound, the iShares Expanded Tech-Software Sector ETF (NYSEMKT: IGV) remains down 4% over the last 12 months compared to the S&P 500's total returns of 21%.

Missed Nvidia in 2009? This Rare Signal Is Flashing Again. In 2009, a "Double Down" signal flashed for a little-known chipmaker called Nvidia. For the first time in years, that same "Total Conviction" signal is flashing for a company 1/100th the size of Nvidia. Continue »

While the fears of AI disruption may have begun to abate (at least for software-as-a-service stocks), there are still plenty of compelling opportunities in the space. Below, we will look at a top-tier option that remains 41% below its high and explain why the SaaS stock's once-in-a-decade valuation and wide moat make it an excellent long-term buy.

Tyler Technologies: Surviving (and thriving with) AI

Tyler Technologies (NYSE: TYL) combines niche-specific vertical software onto a single, mission-critical platform that acts as the operating backbone for government agencies. Working with state and local entities, courts and justice departments, and school and public administration customers, Tyler and its platform benefit from high switching costs, as well as the inherent inertia of government agencies, which tend to be reluctant to overhaul their systems.

In addition to this customer stickiness, AI companies can't really sneak into Tyler's territory (at least, not without the company using it to its advantage) due to the extensive regulations around government agencies' behaviors, and the legal risks inherent to allowing "vibecoded" solutions to manage citizen or governmental data. Furthermore, Tyler Technologies has been a roll-up acquisition machine, targeting companies with software solutions for niche verticals (think jury selection algorithms or student transportation and bus routing) that its potential peers have no interest in competing with because of their small size.

A black-and-white "compass" has its needle pointing to the word "opportunity."

Image source: Getty Images.

Despite being somewhat "weird" niche processes, these types of solutions are mission-critical for local governments. This means they can't easily be cut from government budgets, giving Tyler strong pricing power. It's the market leader at handling these types of vertical software solutions across government agencies and boasts decades of state- and municipality-specific insights and customizations that would be hard for any peer to replace without spending millions, if not billions of dollars. For example, DMV processes differ in some aspects across every state, but Tyler has customized its solutions state by state to comply with all necessary regulations.

Now the company is actively transitioning its government customers to the cloud with its SaaS solutions, enticing them to switch with the allure of AI-powered offerings. Tyler Technologies explains that only its cloud services customers can access AI offerings like document processing, permit review, reconciliations, resident support, and report writing.

With sales and SaaS revenue up 8% and 22%, respectively, and free-cash-flow margins continuing to march toward management's low-30% goal by 2030, it seems as though the AI trend is adding momentum to Tyler's SaaS shift rather than disrupting its business.

Tyler's once-in-a-decade valuation

Though Tyler Technologies stock has jumped 22% in the last month, the company's valuation on a free-cash-flow basis still sits near a 10-year low.

TYL Price to Free Cash Flow Chart

TYL Price to Free Cash Flow data by YCharts.

Trading at just 23 times free cash flow (or 29 times even after accounting for stock-based compensation), Tyler remains more reasonably priced than it has been at any time over the past decade. This discount exists despite sales growth slowing only marginally from 15% annually over the last decade to an expected 9.5% this year, based on management's latest guidance.

Best yet, the company has been buying back its shares hand over fist. As the stock plummeted in 2026, management jumped in and lowered Tyler's outstanding share count by 6%, retiring a hefty chunk of stock at historically discounted valuations.

With management raising Tyler's 2030 free-cash-flow guidance to between $1.1 billion and $1.2 billion -- a range they say doesn't include the potential of acquisitions or new AI solutions -- the company's current market cap of just $15 billion could be outgrown quickly. Considering Tyler Technologies' track record of success at integrating acquisitions, paired with the fact that its newly purchased roll-ups have grown their sales twice as fast as the company's core businesses, there may be more upside in the S&P 500 stock than the market is giving it credit for today.

Should you buy stock in Tyler Technologies right now?

Before you buy stock in Tyler Technologies, consider this:

The Motley Fool Stock Advisor analyst team just identified what they believe are the 10 best stocks for investors to buy now… and Tyler Technologies wasn’t one of them. The 10 stocks that made the cut could produce monster returns in the coming years.

Consider when Netflix made this list on December 17, 2004... if you invested $1,000 at the time of our recommendation, you’d have $421,997!* Or when Nvidia made this list on April 15, 2005... if you invested $1,000 at the time of our recommendation, you’d have $1,413,876!*

Now, it’s worth noting Stock Advisor’s total average return is 978% — a market-crushing outperformance compared to 213% for the S&P 500. Don't miss the latest top 10 list, available with Stock Advisor, and join an investing community built by individual investors for individual investors.

See the 10 stocks »

*Stock Advisor returns as of September 7, 2026.

Josh Kohn-Lindquist has positions in Tyler Technologies. The Motley Fool has positions in and recommends Tyler Technologies. The Motley Fool has a disclosure policy.

☐ ☆ ✇ The Motley Fool

There Are Only a Handful of S&P 500 Stocks That Yield Over 5%. Here's My Top Pick to Buy in September.

By: newsfeedback@fool.com (James Brumley)

Key Points

  • Interest rates have edged upward of late to multiyear highs, driving up yields on bonds and other fixed-income instruments.

  • With safer alternatives now offering reliable returns, the number of truly attractive high-income stocks just got much smaller.

  • One large-cap, high-yield dividend stock in particular is positioned for reliable dividend growth regardless of the market environment and future changes to interest rates: Verizon Communications.

With interest rates on U.S. Treasuries now firmly in multiyear-high territory, income investors have much to think about. The sort of yields that only dividend stocks were able to offer just a short while ago can now be matched -- if not topped -- by longer-term bonds. For perspective, 30-year Treasuries are now yielding 5.25%. An income-generating stock is going to need to bring something special to the table, so to speak, to justify its risk when safer and similarly yielding bonds are available.

There are some names out there that are up to the task, however, even if you're limiting your options to S&P 500 (SNPINDEX: ^GSPC) constituents. My pick of the litter this month is Verizon Communications (NYSE: VZ), which at the current share price boasts a forward yield of 5.7%.

Missed Nvidia in 2009? This Rare Signal Is Flashing Again. In 2009, a "Double Down" signal flashed for a little-known chipmaker called Nvidia. For the first time in years, that same "Total Conviction" signal is flashing for a company 1/100th the size of Nvidia. Continue »

Verizon and its dividend are built to last

Verizon, of course, doesn't need much in the way of introduction. As of the middle of this year, nearly 147 million different mobile devices were connected to its wireless network, making it the United States' top cellphone service provider. It's serving nearly 350,000 broadband internet customers as well.

Its sheer size isn't the big selling point, though, and for that matter, neither is its sizable dividend yield (although it certainly doesn't hurt). Rather, the more nuanced reason Verizon is my top S&P 500 dividend stock pick is that the company's got 19 consecutive years of dividend hikes under its belt, and there's no sign that streak is going to come to an end.

Think about it. For better or worse, consumers are practically glued to their mobile phones, and their smartphones in particular. Pew Research reports that 98% of adults in the United States own a mobile phone, with over 90% of those being smartphones. And among those smartphone owners, 45% made an attempt within the past 12 months to use them less often -- cutting back on the 5-plus hours that Harmony Healthcare IT says they're staring at their device's screens -- but only one-fourth of that 45% say they were very successful in their efforts.

A person is looking at a smartphone while shopping in a store.

Image source: Getty Images.

Connect the dots. Americans are effectively addicted to their mobile phones. Mentally healthy or not, they're not likely to disconnect their pocket-sized connections to the rest of the world now or anytime soon. This means plenty of reliable cash flow ahead for the nation's top name in the business.

Just understand what it is, and isn't

There's a trade-off to owning a stake in Verizon, to be clear. That's a lack of capital gains. While the telecom giant is entrenched, the wireless market is saturated. The bulk of its growth potential comes from population growth and price increases, neither of which is a huge growth engine. There are more effective and productive ways of driving capital gains (and still collect decent dividends along the way). This stock should be viewed strictly as an income and dividend growth holding.

For that particular purpose, though, you'll find few -- if any -- better options than this one.

So, don't overthink it. The yield is solid, and with the stock priced at only about 10 times this year's expected earnings, it's not likely to run into a valuation headwind anytime soon, either.

Should you buy stock in Verizon Communications right now?

Before you buy stock in Verizon Communications, consider this:

The Motley Fool Stock Advisor analyst team just identified what they believe are the 10 best stocks for investors to buy now… and Verizon Communications wasn’t one of them. The 10 stocks that made the cut could produce monster returns in the coming years.

Consider when Netflix made this list on December 17, 2004... if you invested $1,000 at the time of our recommendation, you’d have $421,997!* Or when Nvidia made this list on April 15, 2005... if you invested $1,000 at the time of our recommendation, you’d have $1,413,876!*

Now, it’s worth noting Stock Advisor’s total average return is 978% — a market-crushing outperformance compared to 213% for the S&P 500. Don't miss the latest top 10 list, available with Stock Advisor, and join an investing community built by individual investors for individual investors.

See the 10 stocks »

*Stock Advisor returns as of September 7, 2026.

James Brumley has no position in any of the stocks mentioned. The Motley Fool recommends Verizon Communications. The Motley Fool has a disclosure policy.

☐ ☆ ✇ The Motley Fool

Billionaire Bill Ackman Sells Alphabet Stock and Buys a Mega-Cap Stock Down 42% From Its High

By: newsfeedback@fool.com (Trevor Jennewine)

Key Points

  • In the second quarter, Bill Ackman's hedge fund sold its entire stake in Alphabet and started a position in Netflix.

  • Alphabet is spending aggressively on artificial intelligence infrastructure, which could make the stock volatile in the near term.

  • Netflix is down 42% from its high because investors are worried about its growth prospects, but the stock is too cheap to ignore.

Billionaire Bill Ackman runs Pershing Square, one of the 20 most successful hedge funds in the world as measured by net gains since inception, according to LCH Investments. That makes him a good source of inspiration for individual investors

Ackman made a number of trades in the second quarter, but the two listed below warrant closer inspection:

Missed Nvidia in 2009? This Rare Signal Is Flashing Again. In 2009, a "Double Down" signal flashed for a little-known chipmaker called Nvidia. For the first time in years, that same "Total Conviction" signal is flashing for a company 1/100th the size of Nvidia. Continue »

  • Ackman sold his stake in Alphabet (NASDAQ:GOOGL) (NASDAQ:GOOG), an AI stock up 100% in 18 months.
  • Ackman started a position in Netflix (NASDAQ:NFLX), a mega-cap stock down 42% from its record high.

Here's what investors should know about Alphabet and Netflix.

Bill Ackman in suit, speaking at podium at Pershing Square Sohn Cancer Research event

Bill Ackman speaks at an event for the Pershing Square Sohn Cancer Research Alliance. Image source: Getty Images.

Alphabet: The stock Bill Ackman sold

Alphabet reported strong financial results in the second quarter despite missing estimates on the bottom line. Revenue rose 24% to $120 billion, marking the 12th consecutive quarter of double-digit growth. Meanwhile, GAAP operating income (which eliminates unrealized gains from its investment in SpaceX) increased 31% to $41 billion.

Alphabet is primarily a digital advertising company supported by a plethora of popular web properties, such as Google Search and YouTube. Advertising products and services still account for more than two-thirds of total revenue, but cloud computing has become an increasingly consequential part of the big picture.

Google Cloud revenue rose 82% in the second quarter, the fifth consecutive acceleration, driven by strong demand for artificial intelligence (AI) infrastructure. For the first time, the company earned revenue by selling custom AI accelerators called tensor processing units (TPUs) to external customers, representing an attempt to compete more directly with the market leader Nvidia.

Meanwhile, CEO Sundar Pichai said Gemini APIs (i.e., interfaces that let outside companies integrate Gemini models into their own applications) now process about 22 billion tokens per minute, up from 16 billion one quarter earlier. Pichai also said 90% of Fortune 100 companies use Gemini Enterprise, an AI platform for business work.

In total, Google gained two percentage points of market share in cloud infrastructure and platform services in the past year, and custom chips and proprietary models could certainly drive further share gains in the future. Google Cloud is running circles around its two largest rivals, Amazon and Microsoft, which reported cloud revenue growth of 37% and 43%, respectively, in the most recent quarter.

So, why did Bill Ackman sell his shares? While Alphabet is well-positioned for long-term growth, it faces near-term headwinds related to AI infrastructure spending. In the second quarter, Alphabet reported negative free cash flow for the first time as a public company. It also raised its 2026 capex guidance to $200 billion, up from $91 billion last year.

Negative free cash flow could make the stock volatile as bulls and bears squabble about whether the company is spending too much money on AI infrastructure. Indeed, the stock fell sharply following the second-quarter earnings report, and still trades 2% below the pre-report level as of Sept. 4.

Netflix: The stock Bill Ackman bought

The streaming industry has become much more crowded over the last decade, but Netflix is still the dominant player by virtually every important metric. It has more monthly active users, generates more revenue, boasts better retention rates, and accounts for a larger percentage of TV viewing time than any other subscription streaming service.

In turn, Netflix has a data advantage. With deep insight into viewing behavior, the company has an edge when personalizing content and making production decisions. Indeed, Netflix consistently produces more engaging content than its rivals. Among the 10 most-watched original streaming series and movies in the final week of August, Netflix made four of the series and six of the movies.

Netflix is down 42% from its high in June 2025, primarily because the market is worried about the company's growth prospects after it failed to win bidding wars for Warner Bros. Discovery and Roku. However, I think the market is underestimating Netflix. The company has pricing power in the streaming space, a market forecast to grow at 10% annually through 2030, and it has largely untapped opportunities in advertising, live sports, and theatrical releases.

Wall Street estimates Netflix's earnings will increase at 21% annually over the next three years. That makes the current valuation of 24.7 times earnings look cheap. Indeed, most analysts view the stock as undervalued. Netflix has a median target price of $94 per share, which implies 20% upside from the current share price of $78. Patient investors should feel comfortable buying a small position today.

Should you buy stock in Alphabet right now?

Before you buy stock in Alphabet, consider this:

The Motley Fool Stock Advisor analyst team just identified what they believe are the 10 best stocks for investors to buy now… and Alphabet wasn’t one of them. The 10 stocks that made the cut could produce monster returns in the coming years.

Consider when Netflix made this list on December 17, 2004... if you invested $1,000 at the time of our recommendation, you’d have $421,997!* Or when Nvidia made this list on April 15, 2005... if you invested $1,000 at the time of our recommendation, you’d have $1,413,876!*

Now, it’s worth noting Stock Advisor’s total average return is 978% — a market-crushing outperformance compared to 213% for the S&P 500. Don't miss the latest top 10 list, available with Stock Advisor, and join an investing community built by individual investors for individual investors.

See the 10 stocks »

*Stock Advisor returns as of September 7, 2026.

Trevor Jennewine has positions in Amazon, Nvidia, and Roku. The Motley Fool has positions in and recommends Alphabet, Amazon, Netflix, Nvidia, Roku, and Warner Bros. Discovery. The Motley Fool has a disclosure policy.

☐ ☆ ✇ The Motley Fool

If the Fed Hikes Interest Rates This Month, History Says This Is the Smartest ETF to Buy Right Now

By: newsfeedback@fool.com (Todd Shriber)

Key Points

The next Federal Reserve meeting is on Wednesday, Sept. 16, and it could be a doozy because the central bank could deliver its first interest rate hike in more than three years. Many professional investors believe that will happen as Fed funds futures implied a 59.4% chance of a rate increase as of Sept. 4.

Inflation tells the tale of why a hawkish stance is very much on the table for the Fed. While headline inflation is expected to cool this month, a deeper dive reveals that Core Personal Consumption Expenditures (PCE) are climbing. That gauge, which is a preferred tool of the Federal Open Market Committee (FOMC), strips out volatile energy and food prices, implying that consumers are paying higher prices for an array of goods beyond gas and groceries.

Missed Nvidia in 2009? This Rare Signal Is Flashing Again. In 2009, a "Double Down" signal flashed for a little-known chipmaker called Nvidia. For the first time in years, that same "Total Conviction" signal is flashing for a company 1/100th the size of Nvidia. Continue »

A doctor talking to a patient.

This healthcare could be just what the doctor ordered if interest rates rise. Image source: Getty Images.

So it's not a stretch to say that the Fed's hand may be forced and that a rate hike is imminent. Investors may find some rate-hike protection in healthcare stocks and exchange-traded funds, such as the State Street Health Care Select Sector SPDR ETF (NYSEMKT: XLV).

XLV's relevancy then and now

Time will tell whether the Fed merely nudges rates higher once or twice, or embarks on a rate-tightening regime à la 2022-23. Ideally, it's not the latter, but if it is, this healthcare ETF has a favorable recent history. When the Fed began raising interest rates in 2022 to curb inflation, the S&P 500 tumbled 18.6%, while this healthcare ETF lost just 1.1%.

XLV Total Return Level Chart

XLV Total Return Level data by YCharts

The $45 billion healthcare ETF's history against the backdrop of Fed tightening is relevant here and now because of some wonky correlation stuff. Put simply, the correlation between equities and 10-year Treasury yields is now negative, indicating that Mr. Market is walking on sticky inflation eggshells.

Defensive sectors, including healthcare, have a history of proving durable or less bad when the aforementioned "correlation conundrum" appears. One reason is that those groups are chock-full of dividend-paying stocks, which can serve as a buffer when broader benchmarks slip. For its part, the SPDR ETF carries a 30-day SEC yield of 1.47%.

The ETF is home to four Dividend Kings -- those companies that have raised payouts in 50 consecutive years -- three of which are among the fund's top 10 holdings. That trio is led by Johnson & Johnson, which is the healthcare ETF's second-largest component.

Inflation backs the case for this ETF

Some certainties make the SPDR ETF a smart idea this month. First, new Federal Reserve Chair Kevin Warsh is eager to ward off inflation. Second, larger, higher-quality healthcare stocks tend to be somewhat insensitive to rate hikes while still generating solid earnings when Fed hawkishness cools economic growth.

Another certainty is that Fed rate actions, be they cuts or increases, take time to work their way through the economy. That is to say, a rate hike could arrive this month, but its inflation-cooling effects may not be felt for months. If that proves to be the case, the healthcare sector's reputation for growing earnings in inflationary environments becomes all the more coveted, underscoring why some experts call the group the "antidote" for inflationary times.

So the State Street Health Care Select Sector SPDR ETF isn't a cure for undesirable monetary policy, but it is a smart investment when rates rise.

Should you buy stock in Select Sector SPDR Trust - State Street Health Care Select Sector SPDR ETF right now?

Before you buy stock in Select Sector SPDR Trust - State Street Health Care Select Sector SPDR ETF, consider this:

The Motley Fool Stock Advisor analyst team just identified what they believe are the 10 best stocks for investors to buy now… and Select Sector SPDR Trust - State Street Health Care Select Sector SPDR ETF wasn’t one of them. The 10 stocks that made the cut could produce monster returns in the coming years.

Consider when Netflix made this list on December 17, 2004... if you invested $1,000 at the time of our recommendation, you’d have $421,997!* Or when Nvidia made this list on April 15, 2005... if you invested $1,000 at the time of our recommendation, you’d have $1,413,876!*

Now, it’s worth noting Stock Advisor’s total average return is 978% — a market-crushing outperformance compared to 213% for the S&P 500. Don't miss the latest top 10 list, available with Stock Advisor, and join an investing community built by individual investors for individual investors.

See the 10 stocks »

*Stock Advisor returns as of September 7, 2026.

Todd Shriber has no position in any of the stocks mentioned. The Motley Fool recommends Johnson & Johnson. The Motley Fool has a disclosure policy.

☐ ☆ ✇ The Motley Fool

Worried About a Stock Market Crash? History Says This Mistake Could Cost You Tens of Thousands of Dollars.

By: newsfeedback@fool.com (David Dierking)

Key Points

Nobody wants to see their portfolio fall by 30%.

That's why a lot of investors decide to sell their stocks when it looks like the risk of a market crash is getting higher. If you can get out before the drawdown, you might be able to avoid at least some of the losses, wait for things to improve, and hopefully get back in when prices are lower. At least, that's the idea.

Missed Nvidia in 2009? This Rare Signal Is Flashing Again. In 2009, a "Double Down" signal flashed for a little-known chipmaker called Nvidia. For the first time in years, that same "Total Conviction" signal is flashing for a company 1/100th the size of Nvidia. Continue »

It sounds reasonable enough. In reality, it's incredibly difficult to pull off. Even a lot of the pros have trouble doing it with any consistency.

The true downside of market timing comes from what you might miss out on. History suggests that trying to time a crash could actually cost you a lot of money.

Hand drawing a stock chart showing a market crash.

Image source: Getty Images.

Missing just a few good days can make a huge difference

Fidelity recently did a study that looked at what would have happened to $10,000 invested in the S&P 500 (SNPINDEX: ^GSPC) from the beginning of 1998 through the end of 2025.

An investment that was bought and held throughout this time period would have turned into roughly $616,000. But missing out on the five best days during that time frame would have reduced the total return to just $380,000. That's nearly a quarter-million dollars lost!

This is an important consideration because big down days and big up days often get clustered together during periods of high volatility. If you're staying out of the S&P 500 because of the down days, there's a good chance you're missing out on the up days, too. That will negatively affect your long-term returns.

Here's the move I'd make with the S&P 500 instead

If you're a long-term investor, continuing to buy the S&P 500 through a fund like the Vanguard S&P 500 ETF (NYSEMKT: VOO) makes the most sense.

Simply put, volatility is the price of admission for owning stocks. Corrections and bear markets should be expected if you're investing for years and years. It's how you handle them that matters most. If you continue buying through market pullbacks, you get the opportunity to buy shares at discounted prices. Doing this could actually help improve your long-term returns.

History provides some useful perspective. Vanguard calculated that from 1980 to 2023, bear markets produced an average loss of 30% and lasted more than nine months. Bull markets, on the other hand, generated an average gain of 96% and lasted nearly three years.

Nobody knows when the next crash will come, but investors with time horizons of decades don't really need to worry about that. They just need to know to ride out the short-term volatility.

Market pullbacks don't need to be feared, but if you give in to the fear, it could prove costly in the long run.

Should you buy stock in S&P 500 Index right now?

Before you buy stock in S&P 500 Index, consider this:

The Motley Fool Stock Advisor analyst team just identified what they believe are the 10 best stocks for investors to buy now… and S&P 500 Index wasn’t one of them. The 10 stocks that made the cut could produce monster returns in the coming years.

Consider when Netflix made this list on December 17, 2004... if you invested $1,000 at the time of our recommendation, you’d have $421,997!* Or when Nvidia made this list on April 15, 2005... if you invested $1,000 at the time of our recommendation, you’d have $1,413,876!*

Now, it’s worth noting Stock Advisor’s total average return is 978% — a market-crushing outperformance compared to 213% for the S&P 500. Don't miss the latest top 10 list, available with Stock Advisor, and join an investing community built by individual investors for individual investors.

See the 10 stocks »

*Stock Advisor returns as of September 7, 2026.

David Dierking has no position in any of the stocks mentioned. The Motley Fool has positions in and recommends Vanguard S&P 500 ETF. The Motley Fool has a disclosure policy.

☐ ☆ ✇ The Motley Fool

A Once-in-a-Generation Market Warning Just Flashed. What History Says Happens Next.

By: newsfeedback@fool.com (Geoffrey Seiler)

Key Points

The S&P 500 (SNPINDEX: ^GSPC) is again on its way to a strong annual return. The artificial intelligence (AI) boom has helped the index climb a wall of worry that would likely have derailed many past bull markets. After all, the U.S. remains in conflict with Iran, consumers are struggling with high costs, and long-duration interest rates have been edging higher.

AI has sparked one of the largest corporate spending booms in history, with major tech companies investing an unfathomable amount of money in AI infrastructure and seeing strong returns. At the same time, AI investments are helping companies across industries reduce costs and improve efficiency, boosting corporate earnings.

Missed Nvidia in 2009? This Rare Signal Is Flashing Again. In 2009, a "Double Down" signal flashed for a little-known chipmaker called Nvidia. For the first time in years, that same "Total Conviction" signal is flashing for a company 1/100th the size of Nvidia. Continue »

However, while the market remains in bull mode, a valuation red flag from the dot-com era has just resurfaced.

Bull and bear figurines trading stocks on phone.

Image source: Getty Images

For three consecutive months, the S&P 500's cyclically adjusted price-to-earnings (CAPE) ratio has remained above 40. This metric was devised by famed economist Robert Shiller in 1988 to help smooth out earnings cyclicality and is based on a 10-year average of inflation-adjusted earnings.

To put that into context, the CAPE ratio has only hovered above 40 one other time in history, and that was right before the tech bubble burst in 2000. That 40 score is about 50% above its 20-year historical average and well above its historical baseline of around 17.

Meanwhile, history shows that the S&P 500 has never had a positive three-year return after the CAPE index finished a month above 40.

Why history may not repeat itself

Despite history indicating that the market could be in for a rough ride over the next three years, there is no guarantee this will happen.

First, the sample size of the CAPE hitting 40, is very small. Second, the S&P 500 is much different today than it was 10 years ago, but the CAPE ratio gives the 2016 S&P 500 index as much weight as it does today's S&P 500.

A decade ago, the benchmark index had far more exposure to lower-margin, asset-heavy industrial and energy companies. Today, the index is heavily weighted toward high-margin tech companies that generate tremendous operating cash flow and have fortress balance sheets.

At the same time, AI looks like a huge technological game changer that is quickly moving the needle, while the technology innovation curve is also accelerating. While the internet was a massive breakthrough, it took telecom and web infrastructure companies over a decade to generate a return on their investment. Amazon recently said it expects to break even on its AI infrastructure investments within two to three years, while Space Exploration Technologies (SpaceX) has said it will achieve payback within a year. At the same time, AI is helping corporate America save costs and become more efficient, driving profit growth.

Most large tech companies that currently dominate the S&P 500's top holdings aren't expensive based on future earnings expectations. Meanwhile, if hyperscalers (owners of large data centers) can continue to show strong returns on their AI infrastructure investments and enterprise customers continue to use AI to help drive operational efficiencies, corporate earnings growth should continue to outpace earlier years. The CAPE ratio does not capture what could be a major fundamental shift in the market driven by AI.

How investors should play it

A CAPE ratio of 40 isn't an automatic sign that you should dump your stock holdings and start hiding cash under your mattress. However, it is a warning signal, and if AI infrastructure spending slows dramatically in the coming years, you can be sure the S&P 500 will take a hit, given its current tech-heavy makeup.

That said, there is no need to panic. I'd personally follow Warren Buffett's current strategy and keep some cash on the sidelines in case the market does see a major pullback. Otherwise, I'd keep dollar-cost averaging into top exchange-traded funds (ETFs), such as the Vanguard S&P 500 ETF (NYSEMKT: VOO), because generally, trying to time a market crash is a foolhardy endeavor.

Where to invest $1,000 right now

When our analyst team has a stock tip, it can pay to listen. After all, Stock Advisor’s total average return is 978%* — a market-crushing outperformance compared to 213% for the S&P 500.

They just revealed what they believe are the 10 best stocks for investors to buy right now, available when you join Stock Advisor.

See the stocks »

*Stock Advisor returns as of September 7, 2026.

Geoffrey Seiler has positions in Amazon and Vanguard S&P 500 ETF. The Motley Fool has positions in and recommends Amazon and Vanguard S&P 500 ETF. The Motley Fool has a disclosure policy.

☐ ☆ ✇ The Motley Fool

SpaceX Stock Is Down 34% From Its High. History Suggests a $10,000 Investment Will Be Worth This Much by Mid-2027.

By: newsfeedback@fool.com (Adam Spatacco)

Key Points

  • SpaceX completed the largest IPO in history back in June.

  • Since peaking just days after its IPO, volatility has been constant for SpaceX stock.

  • An analysis of how other heavily hyped IPOs performed shows a consistent pattern: More selling could be in store for SpaceX in the short term.

By now, you probably don't need an elaborate explanation about Space Exploration Technologies' (NASDAQ: SPCX) initial public offering (IPO). The company's June debut was the largest IPO in history, raising roughly $85 billion at a valuation of around $2.1 trillion. For a brief moment, SpaceX was actually more valuable than Amazon. This part of the story is old news for those who have been following the stock, though.

What's more interesting is how SpaceX has traded since its IPO pop. Just days after the IPO, shares reached an intraday high of roughly $226. However, after the company's initial euphoric ascent, concerns about SpaceX's aggressive capital expenditure plans and the potential for post-IPO lockup expirations to pressure the stock fueled a flurry of selling prior to its first earnings report as a public company. After bottoming out at just under $105, shares have started to rebound again.

Missed Nvidia in 2009? This Rare Signal Is Flashing Again. In 2009, a "Double Down" signal flashed for a little-known chipmaker called Nvidia. For the first time in years, that same "Total Conviction" signal is flashing for a company 1/100th the size of Nvidia. Continue »

Still, SpaceX now trades roughly 34% below its post-IPO peak, and in the vicinity of the $150 per share price where it opened on its first day of trading. Investors may be wondering whether this is an opportunity to buy the dip or the precursor to yet another drawdown. While I don't have a crystal ball, I do have a useful data set that shows a consistent pattern among mega-hyped IPOs. Spoiler alert: The direction of SpaceX stock is anyone's guess. Investors who want to add it to their portfolios should buckle up and prepare for a bumpy ride.

A stock chart moving down in a declining fashion.

Image source: Getty Images.

Analyzing blockbuster IPOs

The first IPO I am going to analyze is Palantir Technologies (NASDAQ: PLTR), which went public via a direct listing in September 2020. Shares opened at $10 and rocketed to a high of around $45 within the first year. At the time, Palantir was not seen as a darling of the artificial intelligence (AI) software complex. Instead, the company's early ascent was driven by meme stock era updrafts, fueled by Reddit users on the WallStreetBets forum. After that initial parabolic rise, Palantir spent most of 2021 giving back its gains and eventually settled in the mid-$20s range.

Snowflake (NYSE: SNOW) had a similar arc to Palantir, although the degree to which the stock moved was more dramatic and prolonged. The data warehouse specialist priced its IPO at $120, but shares actually opened their first day of trading at around $245. Before the end of 2020, Snowflake stock had surged to almost $400. While shares then sold off from this peak, Snowflake was still changing hands at prices of around $300 one year following its IPO.

Those two performances might suggest IPO investing usually leads to multibagger gains, but smart investors know there is more to this analysis. Figma (NYSE: FIG) is where the cautionary tale begins.

Figma stock opened at $85 last July and closed its debut session above $115. The very next day, shares spiked to nearly $143. Sounds great, right? Unfortunately for those who chased the momentum, Figma stock eventually crashed -- bottoming near $17 this spring. While Figma has started to show some signs of a comeback, the stock still experienced a peak-to-trough drawdown of more than 80%. That is absolutely brutal.

Cerebras (NASDAQ: CBRS) is a semiconductor company that went public earlier this year. While the stock hasn't reached its first anniversary as a public company, I still see the direction of its price action as useful information.

The Cerebras IPO was priced at $185, but early interest pushed its opening day first-trade price to $350. On that first day of trading, Cerebras stock touched $386. But over the last few months, shares have been all over the place -- ranging as low as $170 and swinging as high as $250. Its current price represents a drawdown of roughly 55% from its opening peak.

Tech IPOs tend to follow a similar path

Back in July, wealth management firm SCS Financial put together an interesting analysis featuring the performance of nearly two dozen IPOs across the technology and tech-enabled services landscapes.

The data includes offerings as far back as the late 1990s, when Amazon and Nvidia went public, as well as a number of early to mid-2000s names like Alphabet, Netflix, Facebook (now Meta Platforms), Tesla, and Uber. The most recent IPOs in the data set included, unsurprisingly, Snowflake, Palantir, and Cerebras.

The takeaway was that the stocks in this cohort experienced a median decline of about 53% from their post-IPO highs. The report also found that IPOs as a broader group have trailed the S&P 500 meaningfully over the last decade or so. For reference, since its inception in late 2013, the Renaissance IPO ETF has significantly underperformed the benchmark index. That ETF holds IPO stocks from recent years such as CoreWeave, Astera Labs, Reddit, and Rubrik. The fund holds onto its positions for up to three years before exchanging them for new IPO stocks.

IPO Chart

IPO data by YCharts.

Where could SpaceX stock be trading by June 2027?

If I apply the same median 53% haircut to SpaceX's $226 peak, then a potential floor for the stock sits somewhere around $105 (which is about where it sat at its lowest point so far). On the more extreme end -- closer to what Figma experienced -- SpaceX stock could bottom closer to $45. I don't think that will happen, though.

If I put the entire peer group in this analysis together, a defensible range for SpaceX stock one year after its IPO could be something around $105 on the realistic bearish end, roughly $160 in a base case, and potentially upward of $200 in an upside scenario that mirrors those IPOs that have displayed the rare ability to reclaim and subsequently build on prior highs.

If you invest $10,000 today at SpaceX's current $147 share price, then it could be worth anywhere between the following by next June:

  • Bear case ($105): Worth about $7,100 -- a loss of roughly 29%.
  • Base case ($160): Worth about $10,900 -- a modest gain of roughly 9%.
  • Bull case ($210): Worth about $14,300 -- a gain of roughly 43%.

While none of this is a perfect forecast, it does represent a series of plausible outcomes supported by comparably hyped IPOs. Ultimately, the analysis here serves as a reminder that even category-defining companies like SpaceX can be particularly risky short-term investments if you chase them when they're at the wrong altitude.

Should you buy stock in Space Exploration Technologies right now?

Before you buy stock in Space Exploration Technologies, consider this:

The Motley Fool Stock Advisor analyst team just identified what they believe are the 10 best stocks for investors to buy now… and Space Exploration Technologies wasn’t one of them. The 10 stocks that made the cut could produce monster returns in the coming years.

Consider when Netflix made this list on December 17, 2004... if you invested $1,000 at the time of our recommendation, you’d have $421,997!* Or when Nvidia made this list on April 15, 2005... if you invested $1,000 at the time of our recommendation, you’d have $1,413,876!*

Now, it’s worth noting Stock Advisor’s total average return is 978% — a market-crushing outperformance compared to 213% for the S&P 500. Don't miss the latest top 10 list, available with Stock Advisor, and join an investing community built by individual investors for individual investors.

See the 10 stocks »

*Stock Advisor returns as of September 7, 2026.

Adam Spatacco has positions in Alphabet, Amazon, Nvidia, Palantir Technologies, and Tesla. The Motley Fool has positions in and recommends Alphabet, Amazon, Figma, Meta Platforms, Netflix, Nvidia, Palantir Technologies, Reddit, Snowflake, and Tesla. The Motley Fool recommends Uber Technologies. The Motley Fool has a disclosure policy.

☐ ☆ ✇ The Motley Fool

This is the Best Bargain in the “Magnificent Seven” Right Now

By: newsfeedback@fool.com (Adria Cimino)

Key Points

  • The “Magnificent Seven” tech stocks are each, to some degree, involved in the artificial intelligence market.

  • This particular player is already generating significant growth from its AI platform.

The "Magnificent Seven" technology stocks have powered the S&P 500 higher in recent years, and this is thanks to their position in the growth area of artificial intelligence (AI). Most of these players are involved to a certain degree in the field, and at the same time, they offer investors well-established, profitable businesses. So, when you buy a "Magnificent Seven" stock, you gain the safety of a company that's proven itself and the potential for a new wave of growth ahead.

You might expect these particular stocks to trade at lofty valuations, but many of them actually are quite reasonably priced right now. And one in particular -- a company that's already delivering billions of dollars in revenue from its AI efforts -- is dirt cheap. This is the best bargain in the "Magnificent Seven" right now. Let's check it out.

Missed Nvidia in 2009? This Rare Signal Is Flashing Again. In 2009, a "Double Down" signal flashed for a little-known chipmaker called Nvidia. For the first time in years, that same "Total Conviction" signal is flashing for a company 1/100th the size of Nvidia. Continue »

Smiling woman with glasses working on a laptop at a table in a bright home office.

Image source: Getty Images.

A group of AI leaders

First, let's start out by identifying these exciting tech players. They are Apple, Amazon, Alphabet (NASDAQ:GOOG) (NASDAQ:GOOGL), Meta Platforms, Microsoft, Nvidia, and Tesla. They specialize in different tech fields -- from smartphones to cloud computing and even electric vehicles -- but they each are involved in AI to some extent, so they may benefit as this technology evolves.

Of this bunch, today, the best bargain is also the cheapest in relation to forward earnings estimates, and this is Alphabet.

Trading at only 16x forward earnings estimates, it looks dirt cheap considering its track record of growth and long-term prospects.

AAPL PE Ratio (Forward) Chart

AAPL PE Ratio (Forward) data by YCharts

Most of us know Alphabet best for something we may use daily. And that's Google Search. The platform is the most popular search engine worldwide, with more than 90% market share, and is also the key to Alphabet's billion-dollar revenue. Advertisers pay to promote their products and services to us across the Google platform, and this has created a steady revenue growth engine for Alphabet.

In the recent quarter, Google ad revenue climbed 14% to more than $81 billion -- this is on a total of $119 billion in revenue for the company.

So, this is a revenue stream the company can rely on, and that creates a certain sense of safety for investors. This is a long-proven business model that works.

The potential for explosive growth ahead

Meanwhile, investors also may benefit from potentially explosive growth in the quarters to come as Alphabet has become a major player in AI. The company has built its own large language models, such as Gemini, and these are helping Alphabet in many ways. Alphabet's AI is making Google Search better, improving the ad experience and results for advertisers, and expanding the offerings of Google Cloud. Today, customers rush to Google Cloud for both AI and non-AI products and services, and all of this is significantly lifting revenue.

For example, in the second quarter, Google Cloud revenue surged 82% to more than $24 billion. In the second quarter of last year, cloud revenue already was considered strong with 32% growth to reach about $13 billion -- but this now seems small compared to today's figures.

And just recently, Alphabet announced more good news. The Gemini app surpassed one billion monthly users, a move that makes it Alphabet's fastest-growing product ever. This is key because it shows users are spending more and more time on Google, something that should support growth in advertising.

Alphabet stock has advanced about 8% so far this year, but with this performance, it's underperforming the market.

Why hasn't the stock climbed higher? Investors have worried about tech companies' heavy investments in AI infrastructure and whether the revenue opportunity will make it all worthwhile. This has prompted some to shy away from players such as Alphabet, which has poured billions into compute and data centers.

I see this as creating a fantastic buying opportunity. Demand for AI remains high, and this is likely to continue as AI is applied to real-world needs. All of this favors ongoing growth at Alphabet, and this, along with current valuation, makes it the best bargain in the "Magnificent Seven."

Should you buy stock in Alphabet right now?

Before you buy stock in Alphabet, consider this:

The Motley Fool Stock Advisor analyst team just identified what they believe are the 10 best stocks for investors to buy now… and Alphabet wasn’t one of them. The 10 stocks that made the cut could produce monster returns in the coming years.

Consider when Netflix made this list on December 17, 2004... if you invested $1,000 at the time of our recommendation, you’d have $421,997!* Or when Nvidia made this list on April 15, 2005... if you invested $1,000 at the time of our recommendation, you’d have $1,413,876!*

Now, it’s worth noting Stock Advisor’s total average return is 978% — a market-crushing outperformance compared to 213% for the S&P 500. Don't miss the latest top 10 list, available with Stock Advisor, and join an investing community built by individual investors for individual investors.

See the 10 stocks »

*Stock Advisor returns as of September 7, 2026.

Adria Cimino has positions in Amazon and Tesla. The Motley Fool has positions in and recommends Alphabet, Amazon, Apple, Meta Platforms, Microsoft, Nvidia, and Tesla. The Motley Fool has a disclosure policy.

☐ ☆ ✇ The Motley Fool

History Says There Are $8.3 Trillion Reasons the Trump Bull Market Is on Thin Ice

By: newsfeedback@fool.com (Sean Williams)

Key Points

  • The Dow Jones Industrial Average, S&P 500, and Nasdaq Composite have thrived under both of Donald Trump’s terms as president.

  • Total financial assets held in money market funds rocketed to a fresh all-time high in the first quarter.

  • Despite six Federal Reserve interest rate cuts, assets held in money market funds have gone parabolic, signaling skepticism with the Trump bull market.

Although the stock market has advanced under most presidents, the annualized returns of the iconic Dow Jones Industrial Average (DJINDICES:^DJI), benchmark S&P 500 (SNPINDEX:^GSPC), and innovation-driven Nasdaq Composite (NASDAQINDEX:^IXIC) are higher with President Donald Trump in the White House than under most other presidents.

During Trump's first term, the Dow, S&P 500, and Nasdaq Composite gained 57%, 70%, and 142%, respectively. His second, non-consecutive term has delivered an encore performance, with the Dow, S&P 500, and Nasdaq rallying 22%, 28%, and 34% through the closing bell on Sept. 2.

Missed Nvidia in 2009? This Rare Signal Is Flashing Again. In 2009, a "Double Down" signal flashed for a little-known chipmaker called Nvidia. For the first time in years, that same "Total Conviction" signal is flashing for a company 1/100th the size of Nvidia. Continue »

Donald Trump is speaking with reporters from the White House Press Briefing Room.

The stock market has thrived under President Trump. Image source: Official White House Photo by Andrea Hanks, courtesy of the National Archives.

While it might seem as if nothing can stop the Trump bull market from heading even higher, one historical figure looms large. This $8.3 trillion warning suggests that Wall Street's historic bull market under President Trump is on thin ice.

Money market fund assets are soaring, and that's terrible news for stocks

Though several headwinds serve as a warning for investors, including record-high outstanding margin debt and nosebleed stock valuations, the total financial assets held in money market funds could be the biggest red flag of them all.

Money market funds are a type of mutual fund that invests in extremely safe, high-quality assets, such as short-term Treasury bills and certificates of deposit. Investors putting their money to work in money market funds typically want to protect their principal and generate reliable interest income.

When the Federal Reserve undertook an aggressive rate-hiking cycle between March 2022 and July 2023 to combat a rapid rise in inflation, fixed-income yields soared. This marked the ideal time for income investors to shift some of their assets into money market funds.

$8.3 Trillion is now sitting in money market funds, an all-time high 🚨 🤑 💰 pic.twitter.com/a63K7h0ell

— Barchart (@Barchart) August 5, 2026

But between September 2024 and December 2025, the central bank lowered the federal funds target rate six times, reducing yields on fixed-income securities and making money market funds less attractive. We would have expected to see capital flow out of money market funds as interest rates declined, but the opposite has been true.

The latest quarterly update from the Board of Governors of the Federal Reserve is that total financial assets held in money market funds reached a record high of $8.29 trillion in the first quarter. Even as yields have fallen, investors have been piling into money market funds like there's no tomorrow.

Ideally, we'd like to see this capital flowing back into the stock market -- but it's not, and that's quite telling.

The stock market entered 2026 at its second-priciest valuation spanning nearly 156 years. History tells us that premium valuations aren't sustainable over extended periods, which may have investors skittish about putting their capital to work in the high-flying Trump bull market.

Stock Market Shiller PE Ratio on the verge of taking out its Dot Com Bubble all-time high 🚨 🤯 👀 pic.twitter.com/CtCmSgWnLt

— Barchart (@Barchart) July 11, 2026

Furthermore, Wall Street's bull market under Trump has been powered by the artificial intelligence (AI) revolution. History has shown that, for decades, every game-changing innovation has endured an early-stage bubble-bursting event. Soaring assets in money market funds may signal that investors expect an AI bubble to form and burst.

To round things out, more than half a century of history shows that significant increases in assets held in money market funds have commonly been a precursor to economic and stock market downturns. Since the midpoint of 2022, total assets held in money market funds have soared 65%! Other instances in which money market fund assets soared include the lead-ups to the financial crisis and the COVID-19 crash.

Should you buy stock in S&P 500 Index right now?

Before you buy stock in S&P 500 Index, consider this:

The Motley Fool Stock Advisor analyst team just identified what they believe are the 10 best stocks for investors to buy now… and S&P 500 Index wasn’t one of them. The 10 stocks that made the cut could produce monster returns in the coming years.

Consider when Netflix made this list on December 17, 2004... if you invested $1,000 at the time of our recommendation, you’d have $421,997!* Or when Nvidia made this list on April 15, 2005... if you invested $1,000 at the time of our recommendation, you’d have $1,413,876!*

Now, it’s worth noting Stock Advisor’s total average return is 978% — a market-crushing outperformance compared to 213% for the S&P 500. Don't miss the latest top 10 list, available with Stock Advisor, and join an investing community built by individual investors for individual investors.

See the 10 stocks »

*Stock Advisor returns as of September 7, 2026.

Sean Williams has no position in any of the stocks mentioned. The Motley Fool has no position in any of the stocks mentioned. The Motley Fool has a disclosure policy.

☐ ☆ ✇ The Motley Fool

Sandisk Just Made the Next Memory Crash a Lot Less Scary

By: newsfeedback@fool.com (Daniel Sparks)

Key Points

  • Sandisk's 10 long-term supply agreements commit eight customers to buy set volumes of flash memory for a weighted average of more than four years.

  • Management expects the agreements, which carry contractual price floors, to cover more than half of the bits Sandisk ships in fiscal 2027.

  • The stock sits more than a quarter below its 52-week high and costs about 8 times expected fiscal 2027 earnings.

Sandisk (NASDAQ:SNDK) earned $6.9 billion of net income in its latest quarter, largely because memory prices went on an extraordinary run. The market clearly doubts the run can last.

The growth stock still sits more than a quarter below its 52-week high. And the stock costs only about 8 times expected fiscal 2027 earnings. A price like that assumes much of today's profit won't survive the cycle.

Missed Nvidia in 2009? This Rare Signal Is Flashing Again. In 2009, a "Double Down" signal flashed for a little-known chipmaker called Nvidia. For the first time in years, that same "Total Conviction" signal is flashing for a company 1/100th the size of Nvidia. Continue »

The flash memory specialist's answer is written into contracts. It now has 10 long-term supply agreements with eight data center and edge customers, and they are expected to produce at least $93.9 billion of revenue over their lives -- assuming prices settle at their contractual floors. For scale, fiscal 2026 revenue, up 175% year over year, was $20.25 billion.

How much downside protection does a floor like that buy?

A robotic arm working over a silicon wafer in a chip factory.

Image source: Getty Images.

A $93.9 billion minimum

The agreements (Sandisk calls them New Business Model agreements) commit the company to deliver, and its customers to buy, set volumes of flash memory over multiyear terms -- more than four years on a weighted-average basis, and up to five. Pricing combines fixed and variable elements, and the variable part is subject to floors and ceilings. The $93.9 billion is the minimum those terms produce if every variable price lands at its floor. It isn't an annual figure or a conventional backlog -- it's contracted revenue spread across the agreements' lives. The agreements also carry financial guarantees (customer cash deposits and other instruments totaling $16.5 billion) in case a buyer walks away. And on the company's August earnings call, chief financial officer Luis Visoso said Sandisk expects them to cover more than half of its bits (the volume of memory shipped) in fiscal 2027 (the fiscal year that began in July), and about two-thirds the following year.

Notably, the floor assumption cuts only one way. If market prices hold above the floors, revenue comes in higher, up to the contracts' ceilings.

The contracted book is still building, too. Remaining performance obligations (contracted product not yet delivered) went from $41.6 billion in early April to $59.8 billion by July 3. And two agreements signed after the fiscal year closed, with a combined contract value the annual report puts at $31.3 billion, aren't in that total.

How bad could the next bust be?

Sandisk's recent history shows what an unprotected downturn looks like. In the final quarter of fiscal 2025, the company generated just $1.9 billion of revenue, ran a 26.2% gross margin, and posted a small net loss. Four quarters later, revenue was $8.97 billion, gross margin was 84.6%, and net income came to $6.9 billion.

Most of that swing came from price, not volume. Management said higher pricing accounted for about two-thirds of the quarter's growth from the prior quarter. And its outlook asks for more of the same: fiscal first-quarter 2027 revenue of $10.3 billion to $10.8 billion, with non-GAAP gross margin expected to hold between 83% and 85%.

The floors are aimed at the reverse trip. In fiscal 2025, nothing stood between Sandisk's revenue and a falling spot price.

If the cycle turns now, more than half of this fiscal year's volumes can't reprice below their contractual minimums, whatever the spot market does. That, I'd argue, is the biggest change in Sandisk's story.

"We expect attractive margins even at floor pricing," Visoso said on the August call.

A price floor isn't a profit floor

However, it's worth noting what that promise covers. Attractive margins at the floor make a case for staying profitable -- not a case that an 84.6% gross margin survives a downturn. In fact, the multi-year model management presented at its August investor day assumes non-GAAP (adjusted) gross margin settles near 80% for fiscal 2028 through fiscal 2030. And management hasn't said how far below today's prices the floors sit.

The rest of the business has no floor at all. Nearly half of this year's bits still sell at whatever the market pays. And no downturn has tested the structure, or customers' willingness to keep paying above-market minimums through one.

Ultimately, the downside case shrinks, but it doesn't go away. A memory crash would still hit nearly half of Sandisk's volumes at full force, and it would still pull contracted pricing down toward the floors.

What it arguably can't do anymore is drag the company back to $1.9 billion quarters and a net loss, as long as customers honor their agreements.

At about 8 times expected fiscal 2027 earnings, I think the stock is priced for a steep decline in earnings, and the contracts make the harshest versions of that decline harder to reach. Still, I'd like to see one quarter where memory pricing falls and margins hold before treating the floors as proven. Until then, I'm not a buyer.

Should you buy stock in Sandisk right now?

Before you buy stock in Sandisk, consider this:

The Motley Fool Stock Advisor analyst team just identified what they believe are the 10 best stocks for investors to buy now… and Sandisk wasn’t one of them. The 10 stocks that made the cut could produce monster returns in the coming years.

Consider when Netflix made this list on December 17, 2004... if you invested $1,000 at the time of our recommendation, you’d have $421,997!* Or when Nvidia made this list on April 15, 2005... if you invested $1,000 at the time of our recommendation, you’d have $1,413,876!*

Now, it’s worth noting Stock Advisor’s total average return is 978% — a market-crushing outperformance compared to 213% for the S&P 500. Don't miss the latest top 10 list, available with Stock Advisor, and join an investing community built by individual investors for individual investors.

See the 10 stocks »

*Stock Advisor returns as of September 7, 2026.

Daniel Sparks and his clients do not have positions in any of the stocks mentioned. The Motley Fool has no position in any of the stocks mentioned. The Motley Fool has a disclosure policy.

☐ ☆ ✇ The Motley Fool

Nvidia's Toughest Competition in 2028 May Be the Chips It Already Sold

By: newsfeedback@fool.com (Daniel Sparks)

Key Points

  • Microsoft and Alphabet depreciate servers over as long as six years, and Meta Platforms raised its assumption to 5.5 years in 2025.

  • Amazon cut its assumption for a subset of servers to five years, citing the pace of AI development.

  • Nvidia's data center revenue totaled about $309 billion across fiscal 2025 and fiscal 2026 combined.

Nvidia (NASDAQ:NVDA) can't build artificial intelligence (AI) hardware fast enough for its customers. But the chips it has already delivered aren't going anywhere.

Nvidia's data center business generated $47.5 billion of revenue in fiscal 2024. In fiscal 2025, that figure jumped 142% to $115.2 billion. And in fiscal 2026, it climbed another 68% to $193.7 billion (Nvidia's fiscal years end in late January). That adds up to about $309 billion of shipments across the last two of those years alone -- and nearly all of that hardware is likely still racked up and running.

Missed Nvidia in 2009? This Rare Signal Is Flashing Again. In 2009, a "Double Down" signal flashed for a little-known chipmaker called Nvidia. For the first time in years, that same "Total Conviction" signal is flashing for a company 1/100th the size of Nvidia. Continue »

How long it keeps running is something Nvidia's biggest customers estimate in their filings, and those estimates carry real money. When Meta Platforms (NASDAQ:META) raised its estimated useful life for most servers to 5.5 years in 2025, the change added $1.00 to its earnings per share for the year.

And the schedules raise an awkward question for Nvidia: What does demand look like in 2028, when the boom-era chips aren't yet due for retirement?

Rows of computer servers in a data center.

Image source: Getty Images.

Nvidia's buyers assume the chips last five or six years

According to its latest annual filing, Microsoft depreciates servers and network equipment over two to six years. Alphabet generally uses six years for servers and network equipment. And Meta's 5.5 years took effect at the start of 2025 and covers most of its servers and network assets. The change cut that year's depreciation expense by about $2.9 billion.

Amazon (NASDAQ:AMZN) went the other way. Its reasoning, I'd argue, is the most interesting part.

The company raised its server estimate from five years to six at the start of 2024. A year later, it reversed, cutting a subset of servers and networking equipment back to five. The shorter lives, Amazon said, are due to "the increased pace of technology development, particularly in the area of artificial intelligence and machine learning." The reversal added $1.4 billion to its 2025 depreciation and amortization expense.

What retires in 2028?

Not much of this hardware is due to come out of service in 2028. A machine bought in 2024 on a five-year clock retires in 2029 at the earliest. On a six-year clock, 2030.

In other words, nearly everything from the 2024 and 2025 spending waves should still be working in 2028. The demand Nvidia is counting on that year is almost entirely new capacity, not replacement.

Chief financial officer Colette Kress said on the company's late-August earnings call that Nvidia expects revenue to grow about 70% in fiscal 2028, which runs through late January 2028. She called that a supply constrained outlook.

Nvidia itself makes the case that the schedules are honest. On its earnings call last November, Kress said the A100 chips Nvidia shipped six years earlier were "still running at full utilization today," crediting its CUDA software.

That defense also describes the problem. A chip that stays productive is capacity Nvidia has already been paid for once -- and it competes with whatever the company wants to sell next.

Sure, the dollars can grow even if the units don't. On the August call, CEO Jensen Huang said each new generation carries more revenue per gigawatt of data center capacity (about $18 billion for Hopper, about $40 billion for the new Vera Rubin platform). And "customers want to race to the next generation as fast as they can," he said.

A paid-off chip can work for cheap

The competition gets sharper once a server finishes its schedule. With no cost left on the books, its owner can rent it out at any price that covers electricity and space. Priced that way, a 2024-vintage chip is cheap competition for inference (the everyday work of running AI models), which arguably doesn't require the newest hardware.

Of course, that market is only starting to form (a marketplace for used Nvidia chips opened this summer). And Nvidia's results suggest why. Kress said in August that Nvidia's computing capacity is fully utilized across every cloud it serves. Supply should remain a bottleneck at least through the end of fiscal 2028. Nobody sells a machine that's earning rent.

Ultimately, the disclosures themselves are worth watching. Amazon's cut says AI hardware ages out faster than planned, which would pull replacement demand forward. Meta's extension says the fleet lasts, leaving 2028 resting that much more on new construction.

As for the stock, shares trade around $230 as of this writing, at about 29 times earnings. Given the growth Nvidia has already guided for, that price strikes me as fair, and I'd still buy shares here.

But the next time the cloud companies change those useful-life estimates, the direction will matter. If they extend again, the chips Nvidia already sold are lasting longer -- and some of the demand investors expect in 2028 may take longer to show up.

Should you buy stock in Nvidia right now?

Before you buy stock in Nvidia, consider this:

The Motley Fool Stock Advisor analyst team just identified what they believe are the 10 best stocks for investors to buy now… and Nvidia wasn’t one of them. The 10 stocks that made the cut could produce monster returns in the coming years.

Consider when Netflix made this list on December 17, 2004... if you invested $1,000 at the time of our recommendation, you’d have $421,997!* Or when Nvidia made this list on April 15, 2005... if you invested $1,000 at the time of our recommendation, you’d have $1,413,876!*

Now, it’s worth noting Stock Advisor’s total average return is 978% — a market-crushing outperformance compared to 213% for the S&P 500. Don't miss the latest top 10 list, available with Stock Advisor, and join an investing community built by individual investors for individual investors.

See the 10 stocks »

*Stock Advisor returns as of September 7, 2026.

Daniel Sparks and his clients do not have positions in any of the stocks mentioned. The Motley Fool has positions in and recommends Alphabet, Amazon, Meta Platforms, Microsoft, and Nvidia. The Motley Fool has a disclosure policy.

☐ ☆ ✇ The Motley Fool

A Key Clue About Social Security's 2027 COLA Should Be Revealed This Week

By: newsfeedback@fool.com (Maurie Backman)

Key Points

  • Many seniors are hoping for a generous Social Security COLA in the new year.

  • While the number won't come out until mid-October, retirees could get a better picture of the 2027 COLA later this week.

  • Even if next year's COLA is fairly large, it may not be enough to improve your financial situation.

There are many older Americans today who are struggling to get by on their Social Security benefits.

Granted, those benefits were never meant to sustain retirees without additional income. But the reality is that plenty of people struggle to save for retirement. And in a situation like that, Social Security benefits become a lifeline, as do the annual cost-of-living adjustments (COLAs) those checks are eligible for every year.

Missed Nvidia in 2009? This Rare Signal Is Flashing Again. In 2009, a "Double Down" signal flashed for a little-known chipmaker called Nvidia. For the first time in years, that same "Total Conviction" signal is flashing for a company 1/100th the size of Nvidia. Continue »

Social Security cards.

Image source: Getty Images.

At this point, many seniors are eager to know what the 2027 COLA will amount to. And they won't have to wait all that much longer, since an official announcement should arrive in mid-October. But later this week, seniors on Social Security should get a key clue about their upcoming COLA they won't want to miss.

A big piece of data should soon arrive

Social Security COLAs are based on third quarter data from the Consumer Price Index for Urban Wage Earners and Clerical Workers (CPI-W). We already have numbers for July, but August's reading is scheduled to be released on Sept. 11.

Once that data comes out, we can expect experts to update their Social Security COLA forecasts accordingly, or confirm whether their current projections remain valid. As of now, the nonpartisan Senior Citizens League, an advocacy group, expects 2027's Social Security COLA to be 3.6%, while independent analyst Mary Johnson is calling for a 3.4% boost.

Have realistic expectations

If you're on Social Security, you may be eager to find out what your 2027 raise will look like. But one thing you must realize is that your upcoming COLA probably won't improve your financial situation all that much, even if that raise is fairly generous.

Any time there's a larger COLA than average, it comes at the cost of higher inflation. So what you gain in the form of a more significant boost to your Social Security checks, you lose in the form of more expensive groceries, gas, and other essentials.

This doesn't mean that the number isn't important. But if you're struggling to cover your costs across the board, don't assume that a large COLA in 2027 will make your expenses easier to manage. You may want to take other steps to improve your situation, like reducing expenses to the most reasonable extent possible or pursuing some type of part-time work arrangement.

If you manage to earn a few hundred dollars a month, those wages will most likely put more money in your pocket than the upcoming COLA by far, thereby actually helping you better keep up with your bills.

The $23,760 Social Security bonus most retirees completely overlook

If you're like most Americans, you're a few years (or more) behind on your retirement savings. But a handful of little-known "Social Security secrets" could help ensure a boost in your retirement income.

One easy trick could pay you as much as $23,760 more... each year! Once you learn how to maximize your Social Security benefits, we think you could retire confidently with the peace of mind we're all after. Join Stock Advisor to learn more about these strategies.

View the "Social Security secrets" »

The Motley Fool has a disclosure policy.

☐ ☆ ✇ The Motley Fool

What a $10,000 Investment in SpaceX Could Be Worth by September 2027

By: newsfeedback@fool.com (Jack Delaney)

Key Points

  • The SpaceX stock price has recently rebounded above its IPO price of $135.

  • The median one-year price target for SpaceX is $216, representing a potential 46% gain by September 2027.

  • SpaceX is not profitable, and it will continue to lose money for the foreseeable future.

Space Exploration Technologies (NASDAQ: SPCX) stock has climbed 18% over the last month, bringing welcome news for shareholders. Over the stock's short trading history, it's already been a wild ride, with shares trading as low as $104.83.

SpaceX stock did a lot of work to get back above its initial public offering pricing of $135, and according to forecasts, that's just the start of where it could be heading by September 2027.

Missed Nvidia in 2009? This Rare Signal Is Flashing Again. In 2009, a "Double Down" signal flashed for a little-known chipmaker called Nvidia. For the first time in years, that same "Total Conviction" signal is flashing for a company 1/100th the size of Nvidia. Continue »

A person holding a rocket in their hand.

Image source: Getty Images.

What a $10,000 investment today could be worth by next year

Based on the Sept. 4 closing price of $147.95, purchasing $10,000 worth of SpaceX stock would yield a little more than 67 shares through fractional investing.

For where analysts think the stock price could go next, of the 41 who cover the stock, the median price target over the next 12 months for SpaceX is $216, according to CNN. If SpaceX hit that price, that would turn a $10,000 investment at the Sept. 4 closing price of $147.95 into approximately $14,599.

For a broader range of scenarios, we can also estimate the potential value of a $10,000 investment in SpaceX by looking at the lowest price target. I won't go over the highest price target, $800, which seems more of a long-term possibility over the next several years than something feasible in the next 12 months.

The lowest price target from that group of analysts is $75. If the SpaceX stock price were to sink that low, that would turn a $10,000 investment into a loss of approximately $5,069.

There's no guarantee that SpaceX will reach any of those prices. Rather, price targets offer a mental model investors can use to gauge sentiment around the stock and develop a risk-to-reward framework to assess whether the stock is a potential portfolio fit.

Investment considerations

In the near term, SpaceX will remain unprofitable. While its 2026 second-quarter earnings report showed its net loss narrowed from $1 billion the year before to $541 million, it's still a loss.

That said, this still could be a stock worth considering adding to a portfolio for more aggressive investors. The upside potential with SpaceX lies in its ability to lead the charge in the next wave of artificial intelligence (AI) infrastructure, with SpaceX forecasting a $26.5 trillion total addressable market (TAM).

It's showing early signs of what it can do through its ground-based data centers, striking deals with both Alphabet and Anthropic to rent out compute capacity. Together, those two contracts could generate $26 billion in annual revenue for SpaceX. As a reference point, SpaceX generated $18.7 billion in revenue for all of 2025.

But that could just be an early preview of what to expect from its data-center deals, as SpaceX plans to launch over 1 million satellites to serve as orbital data centers, with launches expected to begin in 2028. Over time, if SpaceX executes on that AI infrastructure build-out and captures as much of that $26.5 trillion TAM as is possible, it could make the $800 price target mentioned earlier much more realistic to reach over the long term.

Should you buy stock in Space Exploration Technologies right now?

Before you buy stock in Space Exploration Technologies, consider this:

The Motley Fool Stock Advisor analyst team just identified what they believe are the 10 best stocks for investors to buy now… and Space Exploration Technologies wasn’t one of them. The 10 stocks that made the cut could produce monster returns in the coming years.

Consider when Netflix made this list on December 17, 2004... if you invested $1,000 at the time of our recommendation, you’d have $421,997!* Or when Nvidia made this list on April 15, 2005... if you invested $1,000 at the time of our recommendation, you’d have $1,413,876!*

Now, it’s worth noting Stock Advisor’s total average return is 978% — a market-crushing outperformance compared to 213% for the S&P 500. Don't miss the latest top 10 list, available with Stock Advisor, and join an investing community built by individual investors for individual investors.

See the 10 stocks »

*Stock Advisor returns as of September 7, 2026.

Jack Delaney has no position in any of the stocks mentioned. The Motley Fool has positions in and recommends Alphabet. The Motley Fool has a disclosure policy.

☐ ☆ ✇ The Motley Fool

Here's How Long the Average S&P 500 Bull Market Lasts, According to History. Should Investors Be Nervous?

By: newsfeedback@fool.com (James Brumley)

Key Points

  • Given that the economy’s moving parts, policymakers’ decisions, and investor behavior are seemingly consistent, it’s reasonable to assume most of them more or less mirror one another.

  • And it’s true that while no two bull markets are exactly the same, certainly many of them are similar.

  • Enough of them are so different than the average, however, that it’s best to avoid assuming any of them will adhere to a particular schedule.

With a start date of Oct. 12, 2022, the current bull market is now nearly four years old. And by some measures, that's a potential problem. See, the S&P 500's (SNPINDEX: ^GSPC) average bull market only lasts 2.7 years.

That's the number from mutual fund company Hartford, anyway, based on the 27 bull markets since 1928. Since 1949, Fisher Investments notes the typical (and more recent) bull market lasts just over five years, which jibes with figures from brokerage firm Charles Schwab. Raymond James (NYSE: RJF) puts the number at 51 months, or four years and three months.

Missed Nvidia in 2009? This Rare Signal Is Flashing Again. In 2009, a "Double Down" signal flashed for a little-known chipmaker called Nvidia. For the first time in years, that same "Total Conviction" signal is flashing for a company 1/100th the size of Nvidia. Continue »

In other words, most of the statistics say there's probably at least a little more life left ahead for this one.

Just don't get too fixated on the typical bull market's time frame.

It's not a time-based matter

Those figures are averages across all bull markets that start at different times. In all of these cases, however, the length of the S&P 500's underlying bull markets still varied widely. The one that began shortly after the onset of the COVID-19 pandemic only lasted less than two years, for instance. The one stemming from the subprime mortgage meltdown back in 2008 persisted for nearly 11 years. Before that, the recovery from the dot-com collapse of 2000 lasted a predictable five years. Anything's possible.

A person seated at a desk is using a laptop.

Image source: Getty Images.

No two bull markets are the same. Their economic underpinnings are always different and always changing. These changes aren't exactly predictable either. Neither is the response of investors nor that of policymakers to them.

Your best bet, therefore, is not falling into the trap of expecting the S&P 500's cyclical ebbs and flows to adhere to any particular time frame. It's not that you can't or shouldn't look to the future for warning signs. It's just that you want to make sure you're seeing those red flags regardless of what the calendar suggests.

To this end (and in answer to the titular question), no, there's no need for investors to be nervous. Just be alert.

Should you buy stock in S&P 500 Index right now?

Before you buy stock in S&P 500 Index, consider this:

The Motley Fool Stock Advisor analyst team just identified what they believe are the 10 best stocks for investors to buy now… and S&P 500 Index wasn’t one of them. The 10 stocks that made the cut could produce monster returns in the coming years.

Consider when Netflix made this list on December 17, 2004... if you invested $1,000 at the time of our recommendation, you’d have $421,997!* Or when Nvidia made this list on April 15, 2005... if you invested $1,000 at the time of our recommendation, you’d have $1,413,876!*

Now, it’s worth noting Stock Advisor’s total average return is 978% — a market-crushing outperformance compared to 213% for the S&P 500. Don't miss the latest top 10 list, available with Stock Advisor, and join an investing community built by individual investors for individual investors.

See the 10 stocks »

*Stock Advisor returns as of September 7, 2026.

Charles Schwab is an advertising partner of Motley Fool Money. James Brumley has positions in Raymond James Financial. The Motley Fool recommends Charles Schwab and recommends the following options: short September 2026 $95 calls on Charles Schwab. The Motley Fool has a disclosure policy.

☐ ☆ ✇ The Motley Fool

Okta CFO Dumps 80,000 Company Shares Worth $12.9 Million After the Stock Hit a 52-Week High

By: newsfeedback@fool.com (Robert Izquierdo)

Key Points

  • The disposition of 80,000 shares on September 2, 2026, generated total proceeds of ~$12.9 million.

  • The traded volume was equal to 47% of the total equity stake held before the filing.

  • The transaction involved 38,749 shares held directly and 41,251 shares held indirectly by a trust.

Brett Tighe, Chief Financial Officer of Okta, Inc. (NASDAQ:OKTA), sold 80,000 shares of Class A Common Stock on September 2, 2026, according to a recent SEC Form 4 filing.

Transaction summary

MetricValue
Shares sold80,000
Shares sold (directly held)38,749
Shares sold (indirectly held)41,251
Transaction value$12.9 million
Post-transaction shares (directly held)82,046
Post-transaction shares (indirectly held)7,693
Post-transaction value$14.64 million
Insider ownership0.0540%

Transaction value based on SEC Form 4 weighted average sale price ($160.97); post-transaction value based on September 02, 2026 market close ($163.15).

Key questions

  • What prompted this disposition of Class A Common Stock?
    The sale was conducted pursuant to a Rule 10b5-1 trading plan established by Brett Tighe on April 8, 2026. The plan allows corporate insiders to schedule share sales in advance to satisfy liquidity needs while maintaining compliance with insider trading laws.
  • How has the stock performed leading up to this filing?
    The shares were sold at a weighted average price of $160.97, following a period where Okta generated an 82% return over the 12 months ending on the September 2, 2026 transaction date.
  • What is the status of the executive's remaining equity position?
    After this transaction, Brett Tighe continues to hold 82,046 shares directly and 7,693 shares indirectly through a trust, and the filing also reports 50,808 direct derivative securities and 27,795 indirect derivative securities.
  • How does this disposition affect the insider's ownership percentage?
    The Chief Financial Officer now maintains a direct and indirect ownership interest of 0.0540% in the company.

Company Overview

MetricValue
Share Price (as of market close 2026-09-04)$170.60
Market Capitalization$28.4 billion
Revenue (TTM)$3.1 billion
Net Income (TTM)$296.0 million

Company Snapshot

  • Okta delivers comprehensive identity management solutions through its flagship Okta Identity Cloud platform, which includes integrated products such as authentication services, generating revenue primarily through subscription-based licensing and professional services.
  • The company operates a cloud-based software-as-a-service (SaaS) business model, monetizing its identity infrastructure platform through recurring subscription fees from enterprise and mid-market customers seeking secure access management solutions.
  • Okta serves a diverse customer base spanning large corporations, small and medium-sized businesses, educational institutions, charitable organizations, and governmental bodies across both domestic and international markets.

Okta, Inc. is a leading provider of identity and access management solutions with trailing 12-month revenue of $3.1 billion, reflecting strong demand for cloud-based security infrastructure. The company's Okta Identity Cloud platform represents a comprehensive, integrated approach to identity management, positioning the organization as a critical infrastructure provider for enterprises navigating digital transformation and heightened security requirements.

With a global customer base, Okta has established itself as a market leader in the identity management sector, benefiting from secular trends toward cloud adoption and the increasing criticality of identity security in enterprise IT environments.

What this transaction means for investors

CFO Brett Tighe's September 2 sale of Okta stock for a weighted average price of $160.97 took place just days after shares reached a 52-week high of $174.85 on Aug. 27. The timing was fortuitous, since Tighe's disposition was a non-discretionary transaction executed as part of a pre-arranged Rule 10b5-1 plan.

While the disposal represented a significant 47% of his equity stake, it involved the conversion of 41,251 shares of Class B Common Stock into Class A and immediate sale of those shares. This action is a common approach taken by executives as part of a structured liquidity strategy, since they hold so many shares.

In fact, post-transaction, Tighe retained nearly 80,000 direct and indirect derivative securities in addition to 82,046 directly held Class A shares and 7,693 indirectly held Class A shares in a trust. Combined, this is a substantial equity position, although future sales of this size could begin to raise investor concern.

Okta stock is up thanks to strong business performance. The company exited its fiscal second quarter, ended July 31, with $805 million in sales, representing 11% year-over-year growth.

Should you buy stock in Okta right now?

Before you buy stock in Okta, consider this:

The Motley Fool Stock Advisor analyst team just identified what they believe are the 10 best stocks for investors to buy now… and Okta wasn’t one of them. The 10 stocks that made the cut could produce monster returns in the coming years.

Consider when Netflix made this list on December 17, 2004... if you invested $1,000 at the time of our recommendation, you’d have $421,997!* Or when Nvidia made this list on April 15, 2005... if you invested $1,000 at the time of our recommendation, you’d have $1,413,876!*

Now, it’s worth noting Stock Advisor’s total average return is 978% — a market-crushing outperformance compared to 213% for the S&P 500. Don't miss the latest top 10 list, available with Stock Advisor, and join an investing community built by individual investors for individual investors.

See the 10 stocks »

*Stock Advisor returns as of September 7, 2026.

Robert Izquierdo has positions in Okta. The Motley Fool has positions in and recommends Okta. The Motley Fool has a disclosure policy.

☐ ☆ ✇ The Motley Fool

History Says What Nvidia's Last Big Acquisition Became. Hugging Face Will Cost Nearly Twice as Much.

By: newsfeedback@fool.com (Daniel Sparks)

Key Points

  • Nvidia completed its acquisition of Mellanox in April 2020 at a transaction value of $7 billion, the largest it has ever closed.

  • Nvidia's disclosed data center networking revenue was $31.4 billion in fiscal 2026, up from $8.6 billion two fiscal years earlier.

  • Nvidia announced on September 3 that it agreed to buy Hugging Face in a deal valued at about $12.9 billion, expected to close in the first half of 2027.

Nvidia (NASDAQ:NVDA) announced on September 3 that it has agreed to acquire Hugging Face, which runs one of the most widely used platforms for sharing artificial intelligence (AI) models. The total deal value is about $12.9 billion.

Nvidia expects the deal to close in the first half of 2027. And the company says Hugging Face will stay an open platform for the whole AI ecosystem, with Nvidia compute never required to build on it.

Missed Nvidia in 2009? This Rare Signal Is Flashing Again. In 2009, a "Double Down" signal flashed for a little-known chipmaker called Nvidia. For the first time in years, that same "Total Conviction" signal is flashing for a company 1/100th the size of Nvidia. Continue »

That price invites a comparison. The largest acquisition Nvidia has ever closed is Mellanox, the data center networking specialist it agreed to buy for about $6.9 billion in 2019. Hugging Face will cost nearly twice as much.

Technician wearing protective gear works among NVIDIA servers in a data center.

Image source: Nvidia.

What $6.9 billion bought

Nvidia agreed on March 11, 2019, to pay $125 per share in cash for Mellanox, about $6.9 billion in enterprise value. The deal closed more than a year later, on April 27, 2020, at a transaction value of $7 billion.

Mellanox was a substantial business. In 2019, its last full year as a stand-alone company, it generated $1.33 billion in revenue, up 22% year over year, and $205 million in net income, up 53%. The price came to about five times Mellanox's 2019 sales, and about 34 times its earnings.

"With Mellanox, the new NVIDIA has end-to-end technologies from AI computing to networking," CEO Jensen Huang said when the deal closed.

Networking became a $31 billion business

Nvidia doesn't report Mellanox's results separately. But its annual filings disclose data center networking revenue, the line where the acquisition landed. Networking revenue was $8.6 billion in fiscal 2024, $13 billion in fiscal 2025, and $31.4 billion in fiscal 2026, the year that ended this past January -- growth that accelerated from 51% to 142%.

That line isn't all Mellanox, though. Nvidia says fiscal 2026's networking growth was driven by the ramp of NVLink, an interconnect Nvidia announced back in 2014, along with the Ethernet and InfiniBand platforms that came with the deal.

And the disclosure has since gone quiet. Nvidia's commentary on its fiscal second quarter of 2027 (the period ended July 26, 2026) splits data center revenue by customer type and doesn't break out networking at all.

Even so, the business Nvidia bought for $7 billion anchors a product line that generated $31.4 billion in revenue in a single fiscal year -- more than four times the purchase price. However the credit gets divided, I think few big acquisitions anywhere have turned out better.

What does $12.9 billion buy?

Nvidia's announcement puts the total deal value at $12.9 billion, including an equity-based retention program of up to $1 billion for Hugging Face employees who join the company. The platform's scale helps explain the interest. More than 18 million developers, researchers, and creators use Hugging Face to share more than 3 million models and 500,000 datasets.

Hugging Face, founded in 2016, already counts Nvidia among its investors and was valued at $4.5 billion in a funding round three years ago. As for what the company brings in today: The Information reported in August that annualized revenue had climbed 50% in two months, to more than $150 million.

Set that figure against the total deal value, and Nvidia is paying around 86 times reported annualized revenue. It paid about five times sales for Mellanox.

What Nvidia has to believe, I'd argue, is that Hugging Face can pay off the way Mellanox did -- indirectly. The Mellanox deal worked because networking became an integral part of the AI data center systems Nvidia sells, not because Mellanox kept growing as a business apart.

The equivalent belief is that owning the platform where developers pick their models keeps them, and their compute budgets, on Nvidia's hardware and software. If a return comes, it comes through chip and system sales, not Hugging Face's revenue line.

One more difference favors the deal. Nvidia had about $11.7 billion in annual revenue when it announced the Mellanox acquisition, so that price equaled nearly 60% of a year's sales. The $12.9 billion for Hugging Face is small for today's Nvidia, which generated $96.2 billion in revenue and nearly $60 billion in net income in the fiscal second quarter alone. (Nvidia's December 2025 Groq deal was bigger, reportedly valued at about $20 billion, but that was a technology license and hiring, not a purchase of the company.)

Ultimately, the Mellanox price ended up looking like a bargain. But the payoff ran through Nvidia's own product line, and at around 86 times revenue, Hugging Face will need the same indirect kind of payoff.

I wouldn't buy or sell the stock over this deal. With shares around $230 as of this writing, a check this size likely won't decide where the stock goes. And I think management has earned some patience on deals like this one.

Should you buy stock in Nvidia right now?

Before you buy stock in Nvidia, consider this:

The Motley Fool Stock Advisor analyst team just identified what they believe are the 10 best stocks for investors to buy now… and Nvidia wasn’t one of them. The 10 stocks that made the cut could produce monster returns in the coming years.

Consider when Netflix made this list on December 17, 2004... if you invested $1,000 at the time of our recommendation, you’d have $421,997!* Or when Nvidia made this list on April 15, 2005... if you invested $1,000 at the time of our recommendation, you’d have $1,413,876!*

Now, it’s worth noting Stock Advisor’s total average return is 978% — a market-crushing outperformance compared to 213% for the S&P 500. Don't miss the latest top 10 list, available with Stock Advisor, and join an investing community built by individual investors for individual investors.

See the 10 stocks »

*Stock Advisor returns as of September 6, 2026.

Daniel Sparks and his clients do not have positions in any of the stocks mentioned. The Motley Fool has positions in and recommends Nvidia. The Motley Fool has a disclosure policy.

☐ ☆ ✇ The Motley Fool

Prediction: Data Center Passes 70% of AMD's Revenue in 2027, Before the Helios Ramp Is Finished

By: newsfeedback@fool.com (Daniel Sparks)

Key Points

  • Data center generated 58% of AMD's revenue in the second quarter, versus about 42% a year earlier.

  • Third-quarter guidance implies the segment reaches roughly 63% of sales if the rest of the company holds steady.

  • Management expects data center revenue to more than double in 2027 as Helios systems ramp for OpenAI, Meta and Anthropic.

In the second quarter of 2025, data center products generated about 42% of Advanced Micro Devices' (NASDAQ:AMD) revenue. Last quarter, they generated 58% -- $6.7 billion of the chipmaker's record $11.5 billion total.

Behind that shift is a simple growth gap. In the second quarter, data center revenue climbed 107% from a year earlier. Everything else AMD sells (client processors, gaming chips and embedded products) grew about 8% combined.

Missed Nvidia in 2009? This Rare Signal Is Flashing Again. In 2009, a "Double Down" signal flashed for a little-known chipmaker called Nvidia. For the first time in years, that same "Total Conviction" signal is flashing for a company 1/100th the size of Nvidia. Continue »

With a gap that wide, the mix shifts every quarter on its own.

My prediction: the segment passes 70% of AMD's revenue at some point in 2027, before the Helios rack ramp is finished. Here's the math, step by step, and what could break it.

An AMD sign in front of an office building.

Image source: AMD.

A widening spread

The second quarter's 50% companywide growth blended two very different businesses. Data center, home to EPYC server processors and the Instinct graphics processing units (GPUs) behind artificial intelligence (AI) computing, more than doubled over the year, from about $3.2 billion to $6.7 billion. The rest of the company combined for about $4.8 billion. Client revenue, at $3.1 billion, was up 23%, embedded grew 19%, and gaming fell 31%.

Third-quarter guidance widens the gap. Management's guide calls for revenue near $13 billion in the third quarter -- about 41% growth, down from the second quarter's 50%. But chief financial officer Jean Hu said the company expects data center sales to accelerate in the second half of the year. In other words, nearly every incremental dollar in that guide is a data center dollar.

If everything outside data center simply holds near $4.8 billion combined, data center lands around $8.2 billion in the third quarter. That would be about 63% of revenue, five percentage points of mix shift in one quarter.

What does it take to get to 70%?

For the segment to reach 70% of revenue, it has to grow to about 2.3 times the size of everything else AMD sells. Last quarter, it was about 1.4 times that size.

Run those two rates forward a year, with data center slowing from 107% to 90% and the rest still growing about 8%.

By the second quarter of 2027, the segment would be producing roughly $12.8 billion against about $5.2 billion for everything else. That comes to about 71% of revenue. And even a sharper slowdown to about 85% growth still gets there within a year.

Management is aiming higher than my scenario assumes. "Taken together, we now expect data center segment revenue to more than double year-over-year in 2027," CEO Lisa Su said on the company's second-quarter earnings call.

Helios, AMD's rack-scale AI system built on MI400 series chips, is in production, and Su said initial shipments are on track to begin late this quarter, with the ramp building through the fourth quarter and into 2027.

OpenAI has agreed to deploy 6 gigawatts of AMD GPUs, with the first gigawatt of MI450 series chips set to begin deploying later this year. Meta Platforms signed its own 6-gigawatt agreement, with first shipments on the same timeline. And Anthropic plans up to 2 gigawatts, with the first gigawatt beginning in the first half of 2027.

AMD's other businesses could get in the way

The likeliest way this prediction fails isn't a data center stumble -- it's strength everywhere else.

Client revenue grew 23% in the latest quarter, a healthy rate hidden inside that combined 8% figure because gaming fell 31% alongside it. And at about $780 million a quarter, gaming may soon be too small for its declines to keep masking that.

A PC upgrade cycle could push client growth toward 30% while gaming stops falling, lifting the rest of the company to about 20% growth. Hold data center at 90%, and the segment sits near 69% of revenue by mid-2027, just under the line.

Of course, that outcome would be good for AMD. It would likely push the crossover out a quarter or two, still inside 2027.

But a Helios stumble is what breaks the prediction outright. If shipments slip and data center growth gets cut in half to about 50%, the segment could sit around 66% of revenue in mid-2027, and I think 70% waits until 2028.

Ultimately, the spread between 107% and 8% is wide enough that the prediction doesn't need a best-case 2027. It survives a real data center slowdown, and a client revival mostly delays it.

Investors, I'd argue, are already pricing AMD like a data center company. The stock trades at about $474 as of this writing, or around 30 times what AMD is expected to earn in 2027.

The valuation looks reasonable next to 41% guided revenue growth, but a smooth Helios ramp is already baked into the price.

I expect the crossover to come around the middle of 2027, give or take a quarter.

Should you buy stock in Advanced Micro Devices right now?

Before you buy stock in Advanced Micro Devices, consider this:

The Motley Fool Stock Advisor analyst team just identified what they believe are the 10 best stocks for investors to buy now… and Advanced Micro Devices wasn’t one of them. The 10 stocks that made the cut could produce monster returns in the coming years.

Consider when Netflix made this list on December 17, 2004... if you invested $1,000 at the time of our recommendation, you’d have $421,997!* Or when Nvidia made this list on April 15, 2005... if you invested $1,000 at the time of our recommendation, you’d have $1,413,876!*

Now, it’s worth noting Stock Advisor’s total average return is 978% — a market-crushing outperformance compared to 213% for the S&P 500. Don't miss the latest top 10 list, available with Stock Advisor, and join an investing community built by individual investors for individual investors.

See the 10 stocks »

*Stock Advisor returns as of September 6, 2026.

Daniel Sparks and his clients do not have positions in any of the stocks mentioned. The Motley Fool has positions in and recommends Advanced Micro Devices and Meta Platforms. The Motley Fool has a disclosure policy.

☐ ☆ ✇ The Motley Fool

Nuclear Stock Face-Off: Is Constellation Energy or Vistra the Better Buy Right Now?

By: newsfeedback@fool.com (Manali Pradhan, CFA)

Key Points

  • Constellation Energy's nuclear portfolio is much larger, but Vistra has also locked in significant long-term demand from major technology companies.

  • Constellation Energy expects base EPS to grow at least 20% annually through 2029, although that metric represents only part of total earnings.

  • Vistra combines long-term nuclear contracts with additional earnings opportunities that are not yet included in its 2027 EBITDA expectations.

Constellation Energy (NASDAQ: CEG) operates the largest U.S. nuclear power portfolio, with over 22 gigawatts of capacity at the end of fiscal 2025. Although Vistra's (NYSE: VST) nuclear portfolio is smaller, with 6,448 megawatts of capacity, its contracted opportunity is substantial. Both companies have been signing long-term deals with technology companies that need reliable electricity for data centers.

Professionals discussing in a meeting.

Image source: Getty Images

Missed Nvidia in 2009? This Rare Signal Is Flashing Again. In 2009, a "Double Down" signal flashed for a little-known chipmaker called Nvidia. For the first time in years, that same "Total Conviction" signal is flashing for a company 1/100th the size of Nvidia. Continue »

But the better stock is not simply the company with more nuclear capacity. Constellation Energy and Vistra trade at roughly 22.4 times and 14.4 times forward one-year earnings, respectively. The significant valuation gap is an important factor in deciding which stock offers the better opportunity today.

Constellation has significant revenue visibility

Constellation Energy has signed a 20-year agreement to supply Microsoft with power from the planned restart of the 835-megawatt Crane Clean Energy Center. The company has also signed a 20-year agreement to supply Meta Platforms with 1,121 megawatts of nuclear power from the Clinton Clean Energy Center. Constellation Energy also signed another 920 megawatts of long-term power purchase agreements for nuclear generation in the second quarter. (ending June 30, 2026).

Management expects base earnings per share to compound at 20% or more annually from 2026 through 2029. However, base earnings represent only about 60% to 70% of total adjusted operating earnings. So investors should not assume total adjusted operating earnings per share (EPS) will grow at the same rate.

Vistra also looks attractive

Vistra's 20-year agreements with Meta Platforms cover 2,609 megawatts, including 433 megawatts of new capacity expected from upgrades at existing plants. Amazon's AWS has also signed a 20-year agreement for up to 1,200 megawatts of power from Vistra's Comanche Peak nuclear plant.

Vistra sees a 2027 adjusted EBITDA opportunity of $7.4 billion to $7.8 billion from its ongoing operations, excluding potential benefits from the pending Cogentrix Energy acquisition and its agreements with Meta Platforms. The company has also reduced its share count by roughly 30% since November 2021, which has helped boost earnings per share even without relying entirely on faster business growth.

Hence, while Constellation Energy deserves a premium, Vistra offers the stronger risk-reward proposition today.

Should you buy stock in Vistra right now?

Before you buy stock in Vistra, consider this:

The Motley Fool Stock Advisor analyst team just identified what they believe are the 10 best stocks for investors to buy now… and Vistra wasn’t one of them. The 10 stocks that made the cut could produce monster returns in the coming years.

Consider when Netflix made this list on December 17, 2004... if you invested $1,000 at the time of our recommendation, you’d have $421,997!* Or when Nvidia made this list on April 15, 2005... if you invested $1,000 at the time of our recommendation, you’d have $1,413,876!*

Now, it’s worth noting Stock Advisor’s total average return is 978% — a market-crushing outperformance compared to 213% for the S&P 500. Don't miss the latest top 10 list, available with Stock Advisor, and join an investing community built by individual investors for individual investors.

See the 10 stocks »

*Stock Advisor returns as of September 6, 2026.

Manali Pradhan, CFA has no position in any of the stocks mentioned. The Motley Fool has positions in and recommends Amazon, Constellation Energy, Meta Platforms, Microsoft, and Vistra. The Motley Fool has a disclosure policy.

☐ ☆ ✇ The Motley Fool

This Vanguard ETF Is Up 27% This Year: Is It Still a Buy for Long-Term Investors?

By: newsfeedback@fool.com (Marc Guberti)

Key Points

The Vanguard Information Technology Index Fund ETF (NYSEMKT: VGT) has crushed the S&P 500 this year, with a 27% return. Some investors think they missed out on the rally when a stock or ETF gains momentum, but that may not be the case for this tech ETF. A closer look at the fund's top holdings indicates that there is more to the strong year-to-date performance than investors may realize.

Person typing on an AI-enabled laptop.

Image source: Getty Images.

Missed Nvidia in 2009? This Rare Signal Is Flashing Again. In 2009, a "Double Down" signal flashed for a little-known chipmaker called Nvidia. For the first time in years, that same "Total Conviction" signal is flashing for a company 1/100th the size of Nvidia. Continue »

This tech ETF offers significant exposure to the AI trade

The Vanguard Information Technology Index Fund ETF is filled with chipmakers. Nvidia (NASDAQ: NVDA) is the largest position, making up 17% of the fund's total assets. Broadcom (NASDAQ: AVGO), Micron (NASDAQ: MU), and Advanced Micro Devices (NASDAQ: AMD) hold the top four to six positions in the fund and account for a combined 11% of total assets.

Hyperscalers need these chips for their artificial intelligence infrastructure, and as long as cloud platforms and other businesses perform well thanks to AI, those investments will continue. Nvidia and Broadcom both gave multi-year guidance that implies AI revenue will continue to compound.

The largest positions in the portfolio look poised to deliver exceptional fundamental growth amid the AI boom. It's this type of growth that could help the Vanguard Information Technology Index Fund ETF extend its gains.

It's all tech

The tech sector has historically been one of the best ways to beat the S&P 500 over the long run, and this ETF serves as an excellent example. The tech-focused Vanguard fund has an annualized return of 24.4% over the past decade.

Looking deeper into the fund reveals a major allocation to semiconductors and tech hardware, which together account for more than 60% of total assets, including semiconductor equipment.

It still has some exposure to other tech opportunities, such as e-commerce and online advertising. While these types of investments could beat the S&P 500, artificial intelligence is the hottest opportunity right now.

Grand View Research projects a 30.6% compound annual growth rate (CAGR) for the artificial intelligence industry through 2033. Some companies will grow faster than others as the rising tide of AI lifts many businesses, but chipmakers have been the market leaders. Nvidia, Micron, Broadcom, and Advanced Micro Devices are all posting revenue growth rates far more impressive than the average S&P 500 company, and multi-year deals suggest that it will continue.

The Vanguard Information Technology Index Fund ETF has a long history of beating the market and charges only a 0.09% expense ratio. It doesn't cost much to get a well-diversified portfolio of tech companies that should benefit from continued AI demand.

Should you buy stock in Vanguard Information Technology ETF right now?

Before you buy stock in Vanguard Information Technology ETF, consider this:

The Motley Fool Stock Advisor analyst team just identified what they believe are the 10 best stocks for investors to buy now… and Vanguard Information Technology ETF wasn’t one of them. The 10 stocks that made the cut could produce monster returns in the coming years.

Consider when Netflix made this list on December 17, 2004... if you invested $1,000 at the time of our recommendation, you’d have $421,997!* Or when Nvidia made this list on April 15, 2005... if you invested $1,000 at the time of our recommendation, you’d have $1,413,876!*

Now, it’s worth noting Stock Advisor’s total average return is 978% — a market-crushing outperformance compared to 213% for the S&P 500. Don't miss the latest top 10 list, available with Stock Advisor, and join an investing community built by individual investors for individual investors.

See the 10 stocks »

*Stock Advisor returns as of September 6, 2026.

Marc Guberti has positions in Broadcom. The Motley Fool has positions in and recommends Advanced Micro Devices, Broadcom, Micron Technology, and Nvidia. The Motley Fool has a disclosure policy.

☐ ☆ ✇ The Motley Fool

Cathie Wood's 2 Biggest Positions Are Both Elon Musk Companies. Together They Are 16% of the Fund.

By: newsfeedback@fool.com (Daniel Sparks)

Key Points

  • Tesla and SpaceX together account for about 16% of ARK Innovation's assets, according to ARK's own daily holdings file.

  • Tesla fell 5.92% on Friday after its invite-only Cybercab launch event disappointed investors and safety regulators opened an audit query into the robotaxi.

  • Tesla alone accounted for most of the fund's decline on Friday.

Shares of Tesla (NASDAQ:TSLA) fell 5.92% on Friday, after the company's invite-only Cybercab launch event left investors underwhelmed and federal safety regulators opened an audit query into the new robotaxi. Cathie Wood's ARK Innovation ETF (NYSEMKT:ARKK) slipped 1.06% the same day.

Those two moves are more connected than they look. Not only is Tesla the fund's biggest position, but the second-biggest position, SpaceX (NASDAQ:SPCX), answers to the same CEO. SpaceX fell 1.2% on Friday, too.

Missed Nvidia in 2009? This Rare Signal Is Flashing Again. In 2009, a "Double Down" signal flashed for a little-known chipmaker called Nvidia. For the first time in years, that same "Total Conviction" signal is flashing for a company 1/100th the size of Nvidia. Continue »

Together, the two Elon Musk companies make up about 16% of a fund with 47 holdings.

Cathie Wood speaking in a television studio.

Image source: Getty Images.

Two stocks, one CEO

ARK publishes the fund's holdings daily, and the file dated Friday, Sept. 4, shows how top-heavy the ARK Innovation ETF is. Tesla sits at 9.62% of assets, and SpaceX sits at 6.28% -- about 16% combined. Stablecoin issuer Circle Internet Group is the No. 3 position at 6.06%, just behind SpaceX. And the top 10 positions account for about half of the fund's $6.6 billion in assets.

Of course, the fund is concentrated at the top generally, not just in Musk's companies. The Musk pairing is different, though. Two positions run by the same person can move on the same news, and owning both doesn't spread the risk the way owning two unrelated companies would.

Zoom out, and the concentration hasn't been an obvious edge lately, either. The fund gained about 15% over the past year, a stretch in which the S&P 500 (SNPINDEX:^GSPC) rose about 19%.

How much of Friday came from Tesla?

Thursday was supposed to be a milestone for Tesla. The company put its two-seat Cybercab robotaxi into service in Austin, Texas.

But the launch event was invite-only, wasn't streamed, and CEO Elon Musk didn't appear. The event also gave no details on pricing, production pace, or deployment plans.

Regulators moved the same day, too. The National Highway Traffic Safety Administration opened an audit query into Tesla's self-certification of the Cybercab (a vehicle with no steering wheel or pedals) as compliant with federal safety standards.

Tesla's stock had climbed 5.4% on Thursday ahead of the event. By Friday's close, it was down 5.92% to about $354, leaving it about 29% below its 52-week high.

For ARK Innovation, the effect was mostly a matter of weight. A position that makes up 9.62% of assets and falls 5.92% takes about 0.6 of a percentage point off the fund by itself. The fund fell 1.06% on Friday. In other words, more than half of the day's decline came from one stock.

And that stock isn't cheap. Tesla trades at about 155 times the earnings it's expected to produce next year, a price that I'd argue assumes products like the Cybercab ramp quickly and smoothly.

SpaceX is even more expensive

The fund's other Musk position has been a public company for less than three months. SpaceX, the satellite internet and rocket company, went public on June 12 at $135 per share in the largest initial public offering on record.

To be fair, the business is growing impressively. Second-quarter revenue came in at $7.8 billion, up 92% year over year from $4.1 billion. The connectivity segment, built around Starlink's satellite internet service, produced $4.3 billion of that, more than the company's other two segments combined. And the growth is accelerating: revenue rose about 15% year over year in the first quarter before the second quarter's surge.

The company isn't close to profitable, though. SpaceX lost $541 million in the second quarter, an improvement from a $1 billion loss a year earlier. But over the first six months of 2026, its net loss widened to $4.8 billion from $1.5 billion.

Shares trade around $148 as of this writing, modestly above their offering price. That puts SpaceX's market value near $2 trillion -- about 64 times sales, measuring a full year of revenue at the second quarter's pace.

Ultimately, a fund with 47 holdings sounds diversified, and in most respects this one is. At the very top, it isn't. About 16% of the fund rides on one CEO's two companies, and both are arguably among the most expensive stocks in the market.

For investors who own ARK Innovation as a spread-out bet on innovation, the pairing at the top may deserve more attention than the fund's 47 holdings suggest.

Don’t miss this second chance at a potentially lucrative opportunity

Ever feel like you missed the boat in buying the most successful stocks? Then you’ll want to hear this.

On rare occasions, our expert team of analysts issues a “Double Down” stock recommendation for companies that they think are about to pop. If you’re worried you’ve already missed your chance to invest, now is the best time to buy before it’s too late. And the numbers speak for themselves:

  • Nvidia: if you invested $1,000 when we doubled down in 2009, you’d have $598,219!*
  • Apple: if you invested $1,000 when we doubled down in 2008, you’d have $61,037!*
  • Netflix: if you invested $1,000 when we doubled down in 2004, you’d have $421,997!*

Right now, we’re issuing “Double Down” alerts for three incredible companies, available when you join Stock Advisor, and there may not be another chance like this anytime soon.

See the 3 stocks »

*Stock Advisor returns as of September 6, 2026.

Daniel Sparks has clients with positions in Tesla. The Motley Fool has positions in and recommends Tesla. The Motley Fool has a disclosure policy.

☐ ☆ ✇ The Motley Fool

A StubHub Executive Dumps Over 10% of Their Company Shares Worth $1.1 Million

By: newsfeedback@fool.com (Robert Izquierdo)

Key Points

  • The disposition involved ~166,000 shares executed at a weighted average price of $6.36 per share on September 2 and 3, 2026.

  • The transaction size was equal to 12% of the equity stake held directly by the insider prior to the filing.

  • All shares were sold from direct holdings, leaving the insider with a remaining balance of ~1.2 million shares.

Mark Streams, Executive Vice Chairman of the Board of Directors and the Chief Legal Officer at StubHub Holdings, Inc. (NYSE:STUB), sold ~166,000 shares of Class A Common Stock for ~$1.1 million on September 2 and 3, 2026 according to a recent SEC Form 4 filing.

Transaction summary

MetricValue
Transaction value~$1.1 million
Shares sold (directly held)~166,000
Post-transaction shares (directly held)~1.2 million
Post-transaction value$8.01 million

Transaction value based on SEC Form 4 weighted average sale price ($6.36); post-transaction value based on September 03, 2026 market close ($6.53).

Key questions

  • What was the scale of the disposition relative to the insider's total equity?
    The sale of ~166,000 shares represented 12% of the Class A Common Stock held directly by Mark Streams before the transaction.
  • At what price levels were the shares executed during this period?
    Execution occurred across multiple transactions at weighted average prices ranging from $6.20 to $6.4350 per share.
  • What is the current market value of the remaining direct equity interest?
    The insider retains direct ownership of ~1.2 million shares, which carries a market value of $8.01 million based on the September 3, 2026 valuation price of $6.53.
  • How does the insider's residual ownership compare to the total shares outstanding?
    The remaining direct stake represents an ownership interest of 0.35% in the company.

Company Overview

MetricValue
Share Price (as of market close 2026-09-04)$6.60
Market Capitalization$2.3 billion
Revenue (TTM)$1.9 billion
Net Income (TTM)-$1.8 billion

Company Snapshot

  • StubHub operates a global ticketing marketplace that facilitates the buying and selling of live event tickets through its StubHub and viagogo brand platforms, generating revenue from transaction fees on ticket sales across concerts, sports, theater, and other live experiences.
  • The company operates a commission-based business model, capturing value as an intermediary between ticket buyers and sellers on its digital marketplace, with revenue derived primarily from transaction fees on each ticket sale completed on its platforms.
  • StubHub serves individual consumers seeking to purchase or resell tickets to live events, as well as event organizers and venues that utilize the platform to reach secondary market buyers, with a customer base spanning multiple geographies and event categories.

StubHub Holdings operates the world's largest peer-to-peer ticketing marketplace, facilitating billions of dollars in annual ticket transactions across a global customer base of hundreds of millions of users.

The company leverages its dual-brand strategy -- StubHub in North America and viagogo internationally -- to maintain market leadership in the secondary ticket resale market. Despite significant revenue generation, the company is currently navigating profitability challenges as it invests in platform expansion and market penetration.

What this transaction means for investors

StubHub's Executive Vice Chairman and Chief Legal Officer Mark Streams sold a substantial 12% of his directly held company shares on Sept. 2 and Sept. 3. This was a discretionary transaction at a weighted average price of $6.36, which is not far from the stock's 52-week low of $5.74, and well below the initial public offering price of $23.50 per share.

Although he sold a large percentage of his holdings, Streams still retains 1.2 million directly held shares. This significant equity position ensures his continued alignment with shareholder interests. However, a discretionary sale of this size does not instill investor confidence.

StubHub experienced strong sales in the second quarter thanks to the World Cup. It reported record revenue of $573.1 million, which represents excellent 33% year-over-year growth. That said, the stock remained down as costs also increased, resulting in a disappointing net loss attributable to common shareholders of $40,000.

Consequently, Wall Street analysts downgraded the stock, noting a slowdown in StubHub's gross merchandise sales in the second half of 2026, which is at odds with the growth seen by competitors.

Should you buy stock in StubHub right now?

Before you buy stock in StubHub, consider this:

The Motley Fool Stock Advisor analyst team just identified what they believe are the 10 best stocks for investors to buy now… and StubHub wasn’t one of them. The 10 stocks that made the cut could produce monster returns in the coming years.

Consider when Netflix made this list on December 17, 2004... if you invested $1,000 at the time of our recommendation, you’d have $421,997!* Or when Nvidia made this list on April 15, 2005... if you invested $1,000 at the time of our recommendation, you’d have $1,413,876!*

Now, it’s worth noting Stock Advisor’s total average return is 978% — a market-crushing outperformance compared to 213% for the S&P 500. Don't miss the latest top 10 list, available with Stock Advisor, and join an investing community built by individual investors for individual investors.

See the 10 stocks »

*Stock Advisor returns as of September 6, 2026.

Robert Izquierdo has no position in any of the stocks mentioned. The Motley Fool has no position in any of the stocks mentioned. The Motley Fool has a disclosure policy.

☐ ☆ ✇ The Motley Fool

Berkshire Hathaway's Cash Fell From $397 Billion to $366 Billion in a Single Quarter

By: newsfeedback@fool.com (James Brumley)

Key Points

  • Berkshire Hathaway had been amassing an ever-growing war chest since 2022.

  • But in the second quarter, the company bought more stock than it sold for the first time in 14 quarters.

  • Although this doesn’t guarantee more immediate deployment of the remaining cash balance, it does suggest Berkshire is more open-minded on the matter than it had been of late.

After nearly four years of steadily amassing a cash balance of $397 billion, Berkshire Hathaway (NYSE: BRKA) (NYSE: BRKB) is finally putting a measurable amount of that money back to work.

Oh, most of it still remains on the sidelines, undeployed. Specifically, as of the end of the conglomerate's second fiscal quarter, which ended in June, it still had nearly $366 billion in liquidity. That's a reduction of $31 billion in just three months' time, or less than one-tenth of its cash pile.

Missed Nvidia in 2009? This Rare Signal Is Flashing Again. In 2009, a "Double Down" signal flashed for a little-known chipmaker called Nvidia. For the first time in years, that same "Total Conviction" signal is flashing for a company 1/100th the size of Nvidia. Continue »

Still, it's a start.

So where did all that money go? It's not too tough to figure out.

An analyst seated in front of a laptop is using a calculator.

Image source: Getty Images.

Where the money went

The biggest chunk of that $31 billion went toward the purchase of more shares of technology giant Alphabet (NASDAQ: GOOG) (NASDAQ: GOOGL). Berkshire ended Q1 with 54.2 million "A" shares of the company (worth roughly $15.6 billion at the time), plus a handful of "C" shares. Now it owns a bunch more of both, with a collective stake worth nearly $36 billion. That makes Alphabet Berkshire Hathaway's third-biggest holding, right behind American Express.

That's certainly not the only addition Berkshire's current CEO Greg Abel -- with some guidance from Warren Buffett, of course -- made to the company's equity portfolio during the second quarter, though. Although it already owned stakes in both, the company scooped up another 17.5 million shares of Delta Air Lines (NYSE: DAL) to bring its count to 57.3 million, and more than doubled its position in department store chain Macy's (NYSE: M), adding another 4.3 million shares. Those trades would have cost on the order of $1.6 billion and $100 million, respectively.

Expanded positions in homebuilder Lennar (NYSE: LEN) (NYSE: LENB) and The New York Times Company (NYSE: NYT) would have also used up some of Berkshire's cash, although not nearly as much as the $17 billion it shelled out to expand its stake in Alphabet.

Perhaps Abel's most noteworthy use of Berkshire Hathaway's idle cash during Q2, however, wasn't a new pick or adding to an existing one. It's the $4.5 billion used to repurchase outstanding shares of Berkshire itself. That's a dramatic increase from the $235 million spent on the company's own stock in Q1, snapping a six-quarter hiatus in share buybacks.

It's also worth noting that Berkshire Hathaway sold on the order of $3.7 billion in equity holdings during the three months in question, bolstering the conglomerate's quarter-ending cash balance. The remainder of any difference between the sum total of these purchases minus the proceeds of these sales reflects capital spending or net costs incurred by Berkshire's privately owned businesses, such as GEICO Insurance, Clayton Homes, Pilot Travel Centers, and Dairy Queen, just to name a few.

Picky about picks, but also patient

The allocation of this cash deployment is interesting, to be sure. Perhaps more interesting, however, is the fact that Abel is finally doing something with all of that idle capital. Yet, Berkshire's CEO doesn't appear to be in a rush to put it all to work at once. This patience is just as impressive as the conglomerate's stock's long-term price performance.

Should you buy stock in Berkshire Hathaway right now?

Before you buy stock in Berkshire Hathaway, consider this:

The Motley Fool Stock Advisor analyst team just identified what they believe are the 10 best stocks for investors to buy now… and Berkshire Hathaway wasn’t one of them. The 10 stocks that made the cut could produce monster returns in the coming years.

Consider when Netflix made this list on December 17, 2004... if you invested $1,000 at the time of our recommendation, you’d have $421,997!* Or when Nvidia made this list on April 15, 2005... if you invested $1,000 at the time of our recommendation, you’d have $1,413,876!*

Now, it’s worth noting Stock Advisor’s total average return is 978% — a market-crushing outperformance compared to 213% for the S&P 500. Don't miss the latest top 10 list, available with Stock Advisor, and join an investing community built by individual investors for individual investors.

See the 10 stocks »

*Stock Advisor returns as of September 6, 2026.

American Express is an advertising partner of Motley Fool Money. James Brumley has positions in Alphabet. The Motley Fool has positions in and recommends Alphabet, American Express, Berkshire Hathaway, Lennar, and The New York Times Co. The Motley Fool recommends Delta Air Lines. The Motley Fool has a disclosure policy.

☐ ☆ ✇ The Motley Fool

Dick's Sporting Goods Director Colombo Acquires 913 Shares

By: newsfeedback@fool.com (Jack Delaney)

Key Points

  • The transaction was valued at approximately $122,000.

  • The transaction involved shares equal to 0.5% of the total equity held before the filing.

  • The acquisition was conducted indirectly through a trust, which now holds 181,000 shares.

William J. Colombo, a Director at Dick's Sporting Goods (NYSE:DKS), purchased 913 shares of common stock on Sept. 1, 2026, as disclosed in a recent SEC Form 4 filing.

Transaction summary

MetricValue
Transaction value$121,602
Shares purchased (indirectly held)913
Post-transaction shares181,838
Post-transaction shares (directly held)838
Post-transaction shares (indirectly held)181,000
Post-transaction value$24.2 million

Transaction value based on SEC Form 4 weighted average purchase price ($133.19); post-transaction value based on Sept. 1, 2026, market close ($132.95).

Key questions

  • How does this purchase alter the insider's total equity position?
    The acquisition of 913 shares increased total beneficial ownership to 181,838 shares, with the position primarily comprising 181,000 shares held indirectly through a trust and a minor direct holding of 838 shares.
  • What is the current market valuation of the total holdings?
    Based on the Sept. 1, 2026, market close of $132.95, the aggregate direct and indirect equity stake is valued at approximately $24.2 million.
  • What is the context of the transaction price relative to recent stock performance?
    The shares were acquired at a weighted-average price of $133.19 per share, following a period in which the company saw a 38% decrease in its one-year total return as of Sept. 1, 2026.

Company Overview

MetricValue
Share Price (as of market close 2026-09-01)$132.95
Market Capitalization$12.4 billion
Revenue (TTM)$21.1 billion
Net Income (TTM)$838.8 million

Company Snapshot

  • Dick's Sporting Goods operates as a comprehensive omni-channel sporting goods retailer, generating revenue through the sale of hardlines, including sporting equipment, fitness equipment, golf equipment, and fishing gear, as well as athletic apparel, footwear, and accessories across its retail network.
  • The company operates an integrated retail model combining physical store locations with digital commerce capabilities, enabling customers to shop across multiple channels while maintaining inventory efficiency and fulfillment flexibility.
  • Dick's Sporting Goods serves a broad consumer base of athletic enthusiasts, fitness-focused individuals, and sports participants across the United States, positioning itself as a destination retailer for both casual and serious athletes.

Dick's Sporting Goods is a leading omni-channel sporting goods retailer with a substantial market presence across the United States. The company generates approximately $21.1 billion in TTM revenue, demonstrating significant scale within the specialty retail sector. As a diversified sporting goods platform, Dick's maintains competitive advantages through its integrated retail network, comprehensive product assortment spanning equipment and apparel categories, and omni-channel capabilities that address evolving consumer shopping preferences.

What this transaction means for investors

Shareholders of Dick's Sportings Goods have had a rough go of it over thus far in 2026, with the stock price dropping nearly 30%. In comparison, the S&P 500 is up 12.7% over the same period. The struggles faced by the retailer were highlighted in its recent 2026 second-quarter earnings report. In that report, Dick's Sporting Goods reported that Foot Locker, which it acquired in September 2025, saw comparable sales decline by 3.6%. The Foot Locker business, which some were skeptical Dick's Sporting Goods could turn around, appears to be weighing on the overall business, as Dick's Sporting Goods lowered its overall net sales outlook for 2026.

Given the stock's negative price performance and the negative sentiment around the stock, Colombo's purchase is likely welcome news for shareholders. There are plenty of reasons to sell a stock, but typically, an insider buys shares only because they believe the stock price will eventually rise. Purchasing 913 shares indirectly is still a relatively small stake compared to Colombo's overall holdings, but it is at least a signal of confidence. And the bigger picture is that the insider's total holdings are valued at $24.2 million, indicating continued alignment with the company's future success.

Should you buy stock in Dick's Sporting Goods right now?

Before you buy stock in Dick's Sporting Goods, consider this:

The Motley Fool Stock Advisor analyst team just identified what they believe are the 10 best stocks for investors to buy now… and Dick's Sporting Goods wasn’t one of them. The 10 stocks that made the cut could produce monster returns in the coming years.

Consider when Netflix made this list on December 17, 2004... if you invested $1,000 at the time of our recommendation, you’d have $421,997!* Or when Nvidia made this list on April 15, 2005... if you invested $1,000 at the time of our recommendation, you’d have $1,413,876!*

Now, it’s worth noting Stock Advisor’s total average return is 978% — a market-crushing outperformance compared to 213% for the S&P 500. Don't miss the latest top 10 list, available with Stock Advisor, and join an investing community built by individual investors for individual investors.

See the 10 stocks »

*Stock Advisor returns as of September 6, 2026.

Jack Delaney has no position in any of the stocks mentioned. The Motley Fool has no position in any of the stocks mentioned. The Motley Fool has a disclosure policy.

☐ ☆ ✇ The Motley Fool

UiPath Just Sank 17%. Is the Stock a Buy on the Dip?

By: newsfeedback@fool.com (Geoffrey Seiler)

Key Points

  • UiPath turned in solid results and upped guidance, although it needs to show that growth will start to accelerate.

  • The stock is very cheap at the moment if it can stage a turnaround.

Shares of UiPath (NYSE: PATH) sank despite the company reporting solid fiscal second-quarter results and raising its full-year guidance. The stock is now down on the year, as of this writing.

UiPath began as a robotic process automation (RPA) company that lets customers use software bots to perform repetitive, rule-based tasks; however, it has been in the middle of transforming itself in the age of artificial intelligence (AI). Its goal now is to be an orchestration platform that can combine AI with deterministic automation.

Missed Nvidia in 2009? This Rare Signal Is Flashing Again. In 2009, a "Double Down" signal flashed for a little-known chipmaker called Nvidia. For the first time in years, that same "Total Conviction" signal is flashing for a company 1/100th the size of Nvidia. Continue »

Let's dig into the company's quarterly results and prospects to see if this dip is a buying opportunity.

Moving in the right direction

UiPath said its platform that can orchestrate both AI agents and bots was beginning to resonate with customers as it can give them better returns on their investments and that its strong roots in governance and reliability were a competitive advantage. It also believes that being AI model agnostic is an important differentiator. Its AI momentum could be seen in the quarter with 18 of its 20 largest deals including an AI component.

The company has been working to strengthen its go-to-market strategy and said increased deal sizes and expanded customer engagement were evidence this was starting to pay off. However, it noted that customer education was still important, as it looks to bestow the benefits of how combining AI with deterministic automation can help enterprises. The company is also considering offering outcome-based pricing models to increase customer value and adoption. Finally, it continues to add prebuilt vertical and outcome-oriented solutions to help drive growth and be a gateway for its entire solution.

For its fiscal Q2, revenue rose 13% year over year to $410 million, cruising past guidance for revenue of between $395 to $400 million. Its annualized recurring revenue (ARR) rose by 12% year over year to $1.94 billion. Meanwhile, it added $37 million in new ARR in the quarter, up 19% year over year. UiPath's ARR is made up of its annualized invoiced amounts from subscription licenses and maintenance and support obligations, while it excludes invoiced amounts related to perpetual licenses or professional services. The metric is similar to bookings.

Dollar-based net retention came in at 109%, showing that the company is seeing solid growth within its existing customer base. It also had 97% gross retention.

UIPath ended the quarter with 10,350 customers, which was down from 10,550 at the end of Q1 as it continues to see attrition among smaller customers. Customers with $30,000 or more in ARR increased by 6% year over year, and customers with $100,000 or more in ARR increased 10%. Meanwhile, customers with $1 million or more in ARR jumped 21% to 387.

Adjusted earnings per share (EPS) was steady at $0.15. The company generated $31 million in operating cash flow and free cash flow. It ended the quarter with $1.41 billion in cash and marketable securities and no debt.

Looking ahead, UIPath forecast Q3 revenue in the range of $440 million to $445 million, representing growth of 8% at the midpoint. It guided for ARR between $1.992 billion and $1.997 billion.

For the full year, it raised its revenue guidance to a range of $1.789 billion to $1.794 billion from an earlier outlook of $1.776 billion to $1.781 billion. It now expects ARR of $2.065 billion to $2.070 billion versus between $2.058 billion and $2.063 billion previously.

UiPath logo.

Image source: The Motley Fool

Can the stock rebound?

UiPath continues to have a nice opportunity in front of it, and it appears to be seeing some green shoots from its efforts. However, for the stock to work, it does really need to see growth start to accelerate.

The stock remains relatively cheap, trading at a forward price-to-sales ratio of 4.4 times for a high gross margin, recurring business model. Take out its $1.4 billion in cash and marketable securities, and the stock trades at an enterprise-value -to-forward-sales ratio of just around 3.5.

Given its valuation, I think UiPath remains an interesting, speculative AI stock to own.

Should you buy stock in UiPath right now?

Before you buy stock in UiPath, consider this:

The Motley Fool Stock Advisor analyst team just identified what they believe are the 10 best stocks for investors to buy now… and UiPath wasn’t one of them. The 10 stocks that made the cut could produce monster returns in the coming years.

Consider when Netflix made this list on December 17, 2004... if you invested $1,000 at the time of our recommendation, you’d have $421,997!* Or when Nvidia made this list on April 15, 2005... if you invested $1,000 at the time of our recommendation, you’d have $1,413,876!*

Now, it’s worth noting Stock Advisor’s total average return is 978% — a market-crushing outperformance compared to 213% for the S&P 500. Don't miss the latest top 10 list, available with Stock Advisor, and join an investing community built by individual investors for individual investors.

See the 10 stocks »

*Stock Advisor returns as of September 6, 2026.

Geoffrey Seiler has positions in UiPath. The Motley Fool has positions in and recommends UiPath. The Motley Fool has a disclosure policy.

☐ ☆ ✇ The Motley Fool

Where Will Berkshire Hathaway Stock Be in 5 Years?

By: newsfeedback@fool.com (Daniel Sparks)

Key Points

  • Operating earnings rose 16% year over year in Berkshire's most recent quarter, to about $13 billion.

  • Cash and Treasury bills totaled about $365 billion at the end of the second quarter, and CEO Greg Abel has started putting the money to work.

  • Reasonable assumptions put the shares anywhere from about $525 to just above $800 five years from now.

Berkshire Hathaway (NYSE:BRKA)(NYSE:BRKB) is off to a strong start in its first year under CEO Greg Abel. Second-quarter operating earnings rose 16% from a year earlier. The stock, near $505 as of this writing, puts the company's market value at about $1.1 trillion.

Whether the next five years look as good is a harder call. Over a stretch that long, the stock should mostly track two numbers -- how fast operating earnings grow, and what multiple of those earnings investors will pay.

Missed Nvidia in 2009? This Rare Signal Is Flashing Again. In 2009, a "Double Down" signal flashed for a little-known chipmaker called Nvidia. For the first time in years, that same "Total Conviction" signal is flashing for a company 1/100th the size of Nvidia. Continue »

And both numbers hinge, arguably more than anything else, on what Abel does with the company's $365 billion of cash and U.S. Treasury bills.

A smartphone showing a Berkshire Hathaway stock trading screen.

Image source: Getty Images.

Strong growth, and a price to match

Operating earnings are Berkshire's preferred yardstick. The measure leaves out the stock portfolio's gains and losses, which swing reported net income from quarter to quarter and which the company says are usually meaningless in any given period.

On that measure, the company earned about $13 billion during the second quarter. First-half operating earnings totaled $24.3 billion, 17% more than a year earlier.

The growth is a rebound, not a continuation. Operating earnings slipped 6% in 2025, to $44.5 billion, dragged down by weaker insurance results.

This year, growth is broad-based outside insurance. BNSF, the energy business, and the manufacturing, service and retailing group all grew first-half earnings between about 10% and 15% year over year.

Add up the past four reported quarters, and Berkshire has earned about $48 billion of operating earnings, or about $22 for every Class B share. Against a $505 share price, that comes to about 23 times operating earnings -- a premium price, in my view. Investors are paying today for growth that hasn't happened yet.

Greg Abel has started spending the cash

Berkshire's cash and U.S. Treasury bills stood at about $365 billion at midyear, a little less than at the start of the year.

In January, the company closed its $9.4 billion purchase of the chemicals maker OxyChem. In late July, it paid about $6.8 billion in cash for homebuilder Taylor Morrison. And it repurchased about $4.5 billion of its own stock in the second quarter, after buying back almost none in the first. The buyback decision is Abel's now, made in consultation with chairman Warren Buffett.

Berkshire was a net buyer of stocks, too. The cost basis of Berkshire's equity portfolio rose about $21 billion during the first half.

Those uses of cash do different jobs for the five-year math. An acquisition adds operating earnings directly. Stock purchases mostly add just dividend income, since portfolio gains sit outside the operating measure. And buybacks shrink the share count, down about 0.5% through June, so each share gets a bigger piece of the earnings.

Meanwhile, the case for leaving the cash parked may get weaker. After all, Berkshire's insurance investment income fell about 8% in the first half, a decline the company attributed to lower short-term interest rates. The less Treasury bills pay, the more the five-year outcome depends on Abel finding better places for the money.

Where could the stock land?

Assume growth settles at 5% a year, slower than 2026 but better than 2025, and that investors put a lower valuation multiple on a slower Berkshire -- say, 18 times operating earnings. Per-share operating earnings would reach about $29 by mid-2031, and the stock would sit near $525. Five years of almost nothing.

The upside case leans on the cash. If acquisitions and buybacks help operating earnings compound at 10% a year (a pace the company has beaten so far in 2026), and the stock keeps a valuation near 22 times operating earnings, per-share earnings reach about $37. The stock lands a little above $800, about a 10% annual return.

The stock portfolio adds noise to every path. Berkshire's five largest holdings made up 66% of its $324 billion equity portfolio at midyear: Alphabet, American Express, Apple, Bank of America, and Coca-Cola. Of course, a rough stretch for even one or two of those positions could move what investors pay for the whole company. But the portfolio is only about 30% of Berkshire's market value, and its swings don't touch operating earnings at all.

Ultimately, I'd split the difference. Growth near 8% and a valuation of 20 times operating earnings would put the shares around $650 in five years, a mid-single-digit annual return, plus whatever Abel's dealmaking adds on top.

But here's what's interesting about this investment. The downside risk seems low given Berkshire's cash, and there are scenarios that could be far more bullish than we've outlined here if the company deploys its cash into the right assets at the right time. For that reason, I believe Berkshire is a great core holding, even if expectations for the stock are modest. I believe the stock offers meaningful upside potential with low downside risk.

Should you buy stock in Berkshire Hathaway right now?

Before you buy stock in Berkshire Hathaway, consider this:

The Motley Fool Stock Advisor analyst team just identified what they believe are the 10 best stocks for investors to buy now… and Berkshire Hathaway wasn’t one of them. The 10 stocks that made the cut could produce monster returns in the coming years.

Consider when Netflix made this list on December 17, 2004... if you invested $1,000 at the time of our recommendation, you’d have $421,997!* Or when Nvidia made this list on April 15, 2005... if you invested $1,000 at the time of our recommendation, you’d have $1,413,876!*

Now, it’s worth noting Stock Advisor’s total average return is 978% — a market-crushing outperformance compared to 213% for the S&P 500. Don't miss the latest top 10 list, available with Stock Advisor, and join an investing community built by individual investors for individual investors.

See the 10 stocks »

*Stock Advisor returns as of September 6, 2026.

American Express is an advertising partner of Motley Fool Money. Bank of America is an advertising partner of Motley Fool Money. Daniel Sparks and his clients have positions in Apple and Berkshire Hathaway. The Motley Fool has positions in and recommends Alphabet, American Express, Apple, and Berkshire Hathaway. The Motley Fool has a disclosure policy.

❌