FreshRSS

πŸ”’
❌ About FreshRSS
There are new articles available, click to refresh the page.
☐ β˜† βœ‡ The Motley Fool

Prediction: Nvidia Will Join the Vanguard Russell 1000 Value ETF Before the End of the Year. Here's Why the ETF Is an Excellent Buy Now.

By: newsfeedback@fool.com (Daniel Foelber) β€”

Key Points

  • The Vanguard Russell 1000 Value ETF holds stocks traditionally labeled as growth names, including Amazon, Apple, and Microsoft.

  • The development of AI infrastructure that extends far beyond the hyperscalers diversifies Nvidia’s revenue stream.

  • Nvidia is committed to returning at least half of its free cash flow directly to shareholders through buybacks and dividends.

As of July 31, the Vanguard Russell 1000 Growth ETF (NASDAQ: VONG) has a whopping 14.6% weighting in Nvidia (NASDAQ: NVDA) -- far ahead of the 7.6% weighing in the Vanguard S&P 500 ETF (NYSEMKT: VOO). The Vanguard Russell 1000 Growth ETF is based on the Russell 1000 Growth Index, which uses unique methodologies that overweight stocks it deems pure-play growth names (like Nvidia). But that classification may not last.

Here's the surprising reason Nvidia is evolving into a dividend growth stock, which could land it a spot in the Vanguard Russell 1000 Value ETF (NASDAQ: VONV), and why the ETF is one of the best buys for value investors.

Missed Nvidia in 2009? This Rare Signal Is Flashing Again. In 2009, a "Double Down" signal flashed for a little-known chipmaker called Nvidia. For the first time in years, that same "Total Conviction" signal is flashing for a company 1/100th the size of Nvidia. Continue Β»

Nvidia’s logo on a sign in front of the company’s headquarters.

Image source: Nvidia.

Not your typical value index

The London Stock Exchange Group (LSEG) runs the Russell 1000 index, which is the 1,000 largest U.S.-listed stocks by market cap. Earlier this year, the firm shifted its reconstitution period from annual to semiannual. The next index shake-up will take effect in December. I expect Nvidia's weighting to be split between the Vanguard Russell 1000 Growth Index and the Vanguard Russell 1000 Value Index, rather than being solely in the Vanguard Russell 1000 Growth Index.

Like the S&P 500 (SNPINDEX: ^GSPC), the Russell 1000's market cap is heavily concentrated in growth stocks. But LSEG aims to split the Russell 1000 evenly between the Growth Index and Value Index. To compensate for growth stocks being collectively more valuable than value stocks, the index allocates the market cap of stocks like Apple and Microsoft between the two indexes rather than solely to the Growth Index.

For comparison, popular low-cost ETFs like the Vanguard Morningstar Growth ETF (NYSEMKT: VUG) and the Vanguard Morningstar Value ETF (NYSEMKT: VTV) use an all-or-nothing approach. The Vanguard Growth ETF holds Nvidia, Alphabet, Apple, Microsoft, Amazon, Broadcom, Tesla, Meta Platforms, and Micron Technology, while the Vanguard Value ETF doesn't hold any of those stocks. Whereas the Vanguard Russell 1000 Growth ETF and the Vanguard Russell 1000 Value ETF have more crossover.

This crossover can be seen by the number of components in both ETFs. Instead of the combined ETFs having 1,000 components as you may expect -- the Vanguard Russell 1000 Growth ETF has 370 companies compared to 872 in the Vanguard Russell 1000 Value ETF -- showcasing the significant overlap with a combined 1,242 components.

Nvidia has evolved into a cash cow

Apple and Microsoft are the top five components in both the Vanguard Russell 1000 Growth ETF and the Vanguard Russell 1000 Value ETF. I expect Nvidia to secure a similar allocation as the company transitions from a cyclical semiconductor company, highly reliant on one-off hardware sales, to the key provider of foundational artificial intelligence (AI) infrastructure.

Nvidia is broadening its customer base beyond hyperscalers to include AI labs, AI start-ups, AI clouds, and other enterprises that need computing power. Its recently announced $500 billion AI capital financing deal with six major institutions aims to make computing more affordable and to grow Nvidia's customer base. The more companies that depend on Nvidia's hardware and software for computing power, the more ingrained it will become in global infrastructure.

Widespread adoption of generative, agentic, and physical AI (such as robotics and self-driving cars) will gradually increase computing demand, allowing Nvidia to swap out racks in old data centers with its latest tech. On its Aug. 26 second-quarter fiscal 2027 earnings call, Nvidia forecasted 70% revenue growth in fiscal 2028 and noted that its latest Vera Rubin platform, which just began shipments in August, is already expected to account for 20% of data center revenue in its upcoming third quarter.

The pace of Vera Rubin adoption, paired with a growing customer base, sets the stage for sustained high-margin growth and gobs of free cash flow generation. In its latest quarter, Nvidia returned a record $26 billion to shareholders through buybacks and its dividend, which it increased by 2,400% earlier this year.

Over time, I expect Nvidia to diversify its customer base by partnering with financial institutions that are willing to help fund the AI infrastructure build-out. The more Nvidia broadens its customer base, the less it will depend on a boom in hyperscaler capital expenditures from a handful of key customers.

An AI stock for growth and value investors alike

Nvidia is no longer a company in hypergrowth mode with hopes of being highly profitable in the future. It is now an incredibly profitable company that is generating tons of FCF. Nvidia plans to return at least 50% of that FCF to shareholders through dividends and buybacks, and has exceeded that target so far this fiscal year with 60% of FCF returned to shareholders.

As Nvidia matures, I could see it being viewed essentially as a foundational AI value stock in the semiconductor industry, with more staying power than, say, a memory stock like Micron Technology, which isn't as vertically integrated in the AI value chain and is booming largely on a cyclical upswing. And at 23.4 times forward earnings, Nvidia is priced fairly reasonably compared to the S&P 500's forward price-to-earnings ratio of 20.

All told, the Vanguard Russell 1000 Value ETF is a great buy for investors seeking an ETF that offers a modern twist on traditional growth-versus-value paradigms, rather than classifying a stock as purely growth or value.

Should you buy stock in Nvidia right now?

Before you buy stock in Nvidia, consider this:

The Motley Fool Stock Advisor analyst team just identified what they believe are the 10 best stocks for investors to buy now… and Nvidia wasn’t one of them. The 10 stocks that made the cut could produce monster returns in the coming years.

Consider when Netflix made this list on December 17, 2004... if you invested $1,000 at the time of our recommendation, you’d have $421,997!* Or when Nvidia made this list on April 15, 2005... if you invested $1,000 at the time of our recommendation, you’d have $1,413,876!*

Now, it’s worth noting Stock Advisor’s total average return is 978% β€” a market-crushing outperformance compared to 213% for the S&P 500. Don't miss the latest top 10 list, available with Stock Advisor, and join an investing community built by individual investors for individual investors.

See the 10 stocks Β»

*Stock Advisor returns as of September 6, 2026.

Daniel Foelber has positions in Broadcom and Nvidia. The Motley Fool has positions in and recommends Alphabet, Amazon, Apple, Broadcom, Meta Platforms, Micron Technology, Microsoft, Nvidia, Tesla, Vanguard Morningstar Growth ETF, Vanguard Morningstar Value ETF, and Vanguard S&P 500 ETF. The Motley Fool recommends London Stock Exchange Group Plc. The Motley Fool has a disclosure policy.


☐ β˜† βœ‡ The Motley Fool

Meet the Low-Cost ETF That Solves the Vanguard Morningstar Value ETF's Biggest Flaw. Here's Why It's a Magnificent Buy in September.

By: newsfeedback@fool.com (Daniel Foelber) β€”

Key Points

  • There is no crossover between the Morningstar's U.S. Large Cap Value index and U.S. Large Cap Growth index.

  • However, a stock can be in both the Russell 1000 Value index and the Russell 1000 Growth index.

  • That gives the Vanguard Russell 1000 Value ETF exposure to stocks like Amazon, Apple, and Microsoft.

With $188 billion in net assets, the Vanguard Morningstar Value ETF (NYSEMKT: VTV) is by far the largest value-oriented exchange-traded fund (ETF) in the world. And for good reason, as the ETF charges the same 0.03% expense ratio as the world's largest ETF by net assets -- the Vanguard S&P 500 ETF (NYSEMKT: VOO). Low fees provide cost-effective exposure to leading value stocks

The ETF is a good fit for investors who want to target companies priced more for what they are earning today than for what they could earn in the future. This is why the ETF has significantly higher weights in sectors like financials, healthcare, industrials, and consumer staples than the Vanguard S&P 500 ETF.

Missed Nvidia in 2009? This Rare Signal Is Flashing Again. In 2009, a "Double Down" signal flashed for a little-known chipmaker called Nvidia. For the first time in years, that same "Total Conviction" signal is flashing for a company 1/100th the size of Nvidia. Continue Β»

The results have been solid too, as the Vanguard Value ETF has produced a total return (dividends plus capital gains) of 67.9% over the past three years -- and that's without key artificial intelligence (AI) stocks like Nvidia. The Vanguard Morningstar Value ETF is effective because of its simplicity.

But it has a glaring flaw. Here's a Vanguard ETF with a similar cost profile that solves this problem, and why it's a better buy in September than the Value ETF.

Wood blocks spell out β€œvalue” on an upward-sloping chart.

Image source: Getty Images.

The all-or-nothing approach

The Value ETF tracks the performance of the Morningstar U.S. Large Cap Value index, while the Vanguard Morningstar Growth ETF (NYSEMKT: VUG) tracks the Morningstar U.S. Large Cap Growth index. These indexes divide mega-cap and large-cap stocks into two baskets, with the Growth ETF holding 147 components and the Value ETF holding 308.

There's no crossover between the two ETFs. So there are plenty of stocks in the Growth ETF that used to grow much faster than they are today. And there are former value stocks in the Value ETF that many investors would now consider growth stocks, as AI has been a game-changer for business models. For example, Micron Technology is now the second-largest holding in the Vanguard Value ETF -- behind JPMorgan Chase.

Both indexes undergo quarterly rebalancing and reconstitution periods, during which stocks can be shuffled as their investment theses change. But that process still involves an all-or-nothing approach, in which a stock like Micron would be removed from the value index and included solely in the growth index.

A more flexible value stock ETF

FTSE Russell is a subsidiary of the London Stock Exchange Group, which manages the Russell 1000 index that tracks the 1,000 largest U.S.-listed companies. The index is very similar to the S&P 500, but broader, as it includes smaller large-cap and mid-cap stocks.

FTSE Russell has a semi-annual reconstitution in which it weights components by growth and value, with roughly half of the Russell 1000's market cap going into the growth index and the other half into the value index. Since growth stocks make up a far larger share of the Russell 1000 than value stocks, the index essentially pulls some of the market cap of mega cap growth stocks and adds them to the value index.

The Vanguard Russell 1000 Value ETF (NASDAQ: VONV) tracks the Russell 1000 Value index, while the Vanguard Russell 1000 Growth ETF (NASDAQ: VONG) tracks the Russell 1000 Growth index. Both ETFs charge mere 0.06% expense ratios, which is just $6 for every $10,000 invested.

The methodology of the Russell 1000 is notably different from the all-or-nothing approach of the Growth and Value ETFs. The Vanguard Russell 1000 Value ETF's largest positions are Amazon, Apple, and Microsoft because the Russell 1000 splits the market cap of these companies between the Russell 1000 Value index and the Russell 1000 Growth index.

A small portion of Meta Platforms' market capitalization is also in the Russell 1000 Value index, although most of it is still in the growth index. In other words, the Russell 1000 recognizes that these mega-cap companies make up such a large portion of the U.S. stock market and have so many moving parts that oversimplifying them as purely growth stocks is flawed.

The split weighting system makes the Vanguard Russell 1000 Value ETF a much better modern-day representation of value investing than the Vanguard Value ETF. The everyday use of Apple's products and services makes it arguably more of a consumer-staples company than a high-flying tech company. Similarly, Amazon Web Services could be considered an essential service for many enterprises -- especially as AI usage increases.

The Vanguard Russell 1000 Value ETF adjusts for how these businesses have matured into hybrids of growth and value, whereas the Vanguard Value ETF has zero exposure to these stocks.

A value ETF built for the modern stock market

The Vanguard Russell 1000 Value ETF is an excellent buy for value investors who agree with FTSE Russell's methodology that mature tech companies can be split between growth and value indexes rather than solely being included in growth indexes. The semi-annual reconstitution ensures that the ETF stays up to date with evolving investment theses.

For example, Alphabet's entire market cap is currently in the Russell 1000 Growth index, but I could see Alphabet becoming a split-market-cap candidate like Amazon, Apple, and Microsoft. Whereas even if Alphabet evolved into more of a value stock, the Vanguard Value ETF wouldn't be exposed unless it was completely removed from the Vanguard Growth ETF.

Should you buy stock in Vanguard Morningstar Value ETF right now?

Before you buy stock in Vanguard Morningstar Value ETF, consider this:

The Motley Fool Stock Advisor analyst team just identified what they believe are the 10 best stocks for investors to buy now… and Vanguard Morningstar Value ETF wasn’t one of them. The 10 stocks that made the cut could produce monster returns in the coming years.

Consider when Netflix made this list on December 17, 2004... if you invested $1,000 at the time of our recommendation, you’d have $445,833!* Or when Nvidia made this list on April 15, 2005... if you invested $1,000 at the time of our recommendation, you’d have $1,402,153!*

Now, it’s worth noting Stock Advisor’s total average return is 993% β€” a market-crushing outperformance compared to 214% for the S&P 500. Don't miss the latest top 10 list, available with Stock Advisor, and join an investing community built by individual investors for individual investors.

See the 10 stocks Β»

*Stock Advisor returns as of September 4, 2026.

JPMorgan Chase is an advertising partner of Motley Fool Money. Daniel Foelber has positions in Nvidia. The Motley Fool has positions in and recommends Alphabet, Amazon, Apple, JPMorgan Chase, Meta Platforms, Micron Technology, Nvidia, Vanguard Morningstar Growth ETF, Vanguard Morningstar Value ETF, and Vanguard S&P 500 ETF. The Motley Fool recommends London Stock Exchange Group Plc. The Motley Fool has a disclosure policy.

☐ β˜† βœ‡ The Motley Fool

Meet the Low-Cost Vanguard ETF With 26.2% Invested in Nvidia and Alphabet, While VOO Has Just 13.4%.

By: newsfeedback@fool.com (Daniel Foelber) β€”

Key Points

Nvidia (NASDAQ: NVDA), Apple (NASDAQ: AAPL), and Alphabet (NASDAQ: GOOGL) (NASDAQ: GOOG) are the three most valuable companies in the world and dominate the S&P 500 with a combined 20.4% weighting. So buying the Vanguard S&P 500 ETF (NYSEMKT: VOO), which tracks the index, is a straightforward, low-cost way to invest in such mega-cap tech stocks -- especially considering the ETF has a 0.03% expense ratio, or just three cents for every $100 invested.

However, investors looking for outsize exposure to Nvidia and Alphabet may want to consider the Vanguard Russell 1000 Growth ETF (NASDAQ: VONG) instead of the Vanguard S&P 500 ETF. The growth ETF is based on the Russell 1000 index -- which includes the 1,000 largest U.S companies by market capitalization.

Missed Nvidia in 2009? This Rare Signal Is Flashing Again. In 2009, a "Double Down" signal flashed for a little-known chipmaker called Nvidia. For the first time in years, that same "Total Conviction" signal is flashing for a company 1/100th the size of Nvidia. Continue Β»

Here's why Nvidia and Alphabet are great buys now, and why the Russell 1000 Growth ETF is so heavily invested in them.

An investor smiles while holding a mug and looking at a laptop computer.

Image source: Getty Images.

Earnings-driven growth stories

Despite being completely different businesses, Nvidia and Alphabet have similar investment theses. Nvidia is growing revenue rapidly and maintaining high margins as it returns boatloads of free cash flow (FCF) to shareholders through buybacks and a 2,400% increase in its dividend. It just reported second-quarter fiscal 2027 results, with revenue more than doubling year over year. And already, Nvidia is forecasting a 70% increase in fiscal 2028 revenue despite increasingly difficult comps from fiscal 2027.

Nvidia has transformed into a high-margin cash cow and is no longer a growth stock valued entirely on what it could do years from now. Rather, Nvidia has grown into its valuation because it has transformed into the second most profitable company in the world -- right behind Alphabet and ahead of Amazon, Microsoft, Apple, and Saudi Arabian Oil.

GOOGL Net Income (TTM) Chart

GOOGL Net Income (TTM) data by YCharts

Alphabet is also generating consistent growth even as it invests aggressively in artificial intelligence. Its FCF has declined due to higher spending, but Alphabet is unique in that it has exposure to multiple links along the artificial intelligence (AI) value chain. Alphabet has Google Search, the Gemini frontier models, Google Cloud, YouTube, Android, Google Pixel and other devices, Waymo, is a leader in quantum computing, and more. In this vein, it remains a balanced bet on AI, with exposure to AI infrastructure, generative AI, agentic AI, and edge AI through use cases like self-driving cars.

In addition to their profitability and high gross margins, Nvidia and Alphabet are similar in that they are compelling values, with Nvidia trading at a forward price-to-earnings ratio of 23.8 and Alphabet at just 16.5.

A growth ETF unlike any other

Nvidia and Alphabet check the boxes of excellent growth stocks to buy now because they have industry-leading, high-margin business models and aren't overpriced. They are also by far the largest holdings in the Vanguard Russell 1000 Growth ETF, with Nvidia at 14.5% and Alphabet at 11.7% -- significantly higher than Apple's 7.5% weighting, even though Apple has a higher market cap than Alphabet.

The reason Nvidia and Alphabet are so highly weighted is because of the unique way FTSE Russell classifies components of the Russell 1000 Growth index and the Russell 1000 Value index. Some stocks -- like Nvidia, Alphabet, Broadcom, Tesla, Micron Technology, and Advanced Micro Devices -- are pure-play growth stocks, whereas Berkshire Hathaway, JPMorgan Chase, ExxonMobil, and Johnson & Johnson are pure-play value stocks. However, some key components like Amazon, Apple, Microsoft, and Meta Platforms are holdings in both indexes.

This split causes the Vanguard Russell 1000 Growth ETF to have outsize positions in mega-cap companies classified solely as growth stocks -- such as Nvidia and Alphabet. As you can see in the following table, some noteworthy pure-play growth stocks have roughly double the weighing in the Vanguard Russell 1000 Growth ETF than the Vanguard S&P 500 ETF.

Company Weighting

Vanguard Russell 1000 Growth ETF

Vanguard S&P 500 ETF

Nvidia

14.5%

7.6%

Alphabet

11.7%

5.9%

Broadcom

5.6%

2.9%

Micron

2.9%

1.4%

Tesla

2.8%

1.4%

AMD

2.4%

1.2%

Data source: Vanguard.

A dynamic growth ETF with low fees

The Vanguard Russell 1000 Growth ETF is a good buy for investors looking for outsize exposure to Nvidia, Alphabet, and semiconductor stocks. The ETF charges a 0.06% expense ratio, which is still dirt cheap, since that's just 60 cents per $100 invested.

However, investors should be aware that the Russell 1000 Growth index's semi-annual reconstitution could dramatically shake up the ETF's composition if the index decides that Nvidia and Alphabet should have split weightings in both the growth and value indexes. If that were to happen, they would lose their dominant weightings in the Vanguard Russell 1000 Growth ETF.

Add it all up, and the Russell 1000 index's split methodology makes the Vanguard Russell 1000 Growth ETF a good buy for investors targeting today's leading growth stocks rather than companies whose rapid growth periods may be in the rearview.

Should you buy stock in Vanguard Scottsdale Funds - Vanguard Russell 1000 Growth ETF right now?

Before you buy stock in Vanguard Scottsdale Funds - Vanguard Russell 1000 Growth ETF, consider this:

The Motley Fool Stock Advisor analyst team just identified what they believe are the 10 best stocks for investors to buy now… and Vanguard Scottsdale Funds - Vanguard Russell 1000 Growth ETF wasn’t one of them. The 10 stocks that made the cut could produce monster returns in the coming years.

Consider when Netflix made this list on December 17, 2004... if you invested $1,000 at the time of our recommendation, you’d have $445,833!* Or when Nvidia made this list on April 15, 2005... if you invested $1,000 at the time of our recommendation, you’d have $1,402,153!*

Now, it’s worth noting Stock Advisor’s total average return is 993% β€” a market-crushing outperformance compared to 214% for the S&P 500. Don't miss the latest top 10 list, available with Stock Advisor, and join an investing community built by individual investors for individual investors.

See the 10 stocks Β»

*Stock Advisor returns as of September 4, 2026.

JPMorgan Chase is an advertising partner of Motley Fool Money. Daniel Foelber has positions in Broadcom and Nvidia. The Motley Fool has positions in and recommends Advanced Micro Devices, Alphabet, Amazon, Apple, Berkshire Hathaway, Broadcom, JPMorgan Chase, Meta Platforms, Micron Technology, Nvidia, Taiwan Semiconductor Manufacturing, Tesla, and Vanguard S&P 500 ETF. The Motley Fool recommends Johnson & Johnson. The Motley Fool has a disclosure policy.

☐ β˜† βœ‡ The Motley Fool

Nvidia Just Returned a Record $26 Billion to Shareholders After Increasing Its Dividend by 2,400%. I Predict Another Massive Dividend Increase.

By: newsfeedback@fool.com (Daniel Foelber) β€”

Key Points

  • Demand is outpacing supply for Nvidia's latest Vera Rubin computing platform.

  • Nvidia is sticking to its plan to return at least 50% of free cash flow to shareholders.

  • Quicker-than-expected cash-flow growth paves the way for accelerated buybacks and dividend raises.

Nvidia (NASDAQ: NVDA) recently delivered exceptional second-quarter fiscal 2027 results. It more than doubled revenue and operating income year over year while maintaining a sky-high 75% gross margin, despite a 55% increase in operating expenses.

This was also the first quarter since Nvidia raised its quarterly payout from $0.01 per share to $0.25 per share -- a 2,400% dividend raise. Nvidia paid $6.05 billion in dividends in its latest quarter -- up from just $244 million in the first quarter of fiscal 2027. And in total, it returned a record $25.78 billion to shareholders through stock buybacks and dividends.

Missed Nvidia in 2009? This Rare Signal Is Flashing Again. In 2009, a "Double Down" signal flashed for a little-known chipmaker called Nvidia. For the first time in years, that same "Total Conviction" signal is flashing for a company 1/100th the size of Nvidia. Continue Β»

For context, Apple (NASDAQ: AAPL), which is typically the most aggressive company at returning capital to shareholders -- bought back $25.95 billion in stock and paid $4 billion in dividends in its latest quarter.

After correctly predicting Nvidia would make a substantial dividend increase in 2026, I'm predicting Nvidia will implement yet another massive dividend raise within the next year. Here's why.

Nvidia’s logo on a sign in front of the company’s headquarters.

Image source: Nvidia.

Nvidia's growth shows no signs of slowing

Over the last couple of years, Nvidia has transformed from a high-octane growth stock that reinvested most of its excess capital back into the business to one that generates so much free cash flow (FCF) that it can afford to invest aggressively in research and development and return FCF to shareholders. This dynamic starkly contrasts with a company like Apple, which is no longer growing at a breakneck pace but is generating consistently high-margin cash flow that it uses to rapidly repurchase stock -- resulting in a 31.6% reduction in its share count over the last decade.

An expanding capital return program can sometimes signal that a business is maturing to the point where it doesn't have enough good ideas to put capital to work without taking on excess risk. But that isn't the case with Nvidia.

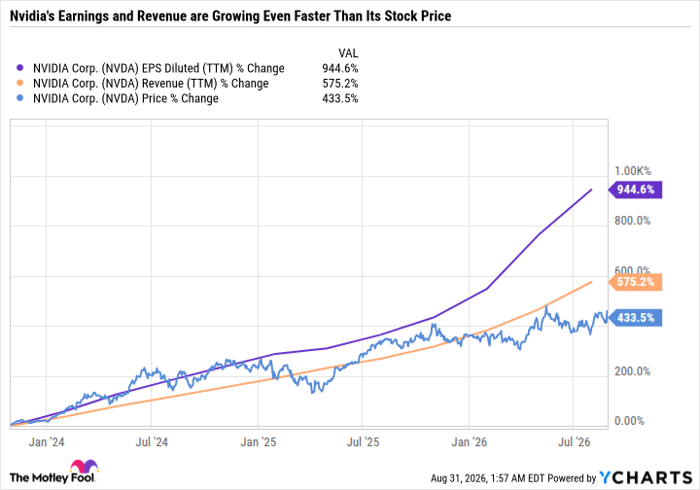
Nvidia gets a lot of attention as the world's most valuable company because its stock price has risen severalfold in recent years. But arguably the bigger story is that its earnings and revenue have grown even faster.

NVDA EPS Diluted (TTM) Chart

NVDA EPS Diluted (TTM) data by YCharts

It's virtually unheard of for a company this size to continue growing so quickly while maintaining high margins. And yet, Nvidia is growing quickly because it remains at the cutting edge of artificial intelligence (AI) innovation.

The next growth catalyst for Nvidia is its Vera Rubin platform, which began shipments in August. Nvidia expects Rubin to account for 20% of its data center revenue in the upcoming quarter -- marking the fastest ramp-up in company history. Rubin marks a monumental shift in AI computing and includes a rack-scale offering comprising multiple Nvidia chips and networking infrastructure. Nvidia expects the majority of AI infrastructure to be powered by this rack-scale solution due to its extreme co-design efficiency, which is the product of Nvidia controlling a larger share of the data center addressable market rather than just providing a few key components -- namely, graphics processing units.

Extra cash is funneling directly to shareholders

Rubin's impact is so significant that Nvidia has already released guidance for fiscal 2028 revenue, even though it is only halfway through fiscal 2027. Despite difficult comps, Nvidia is calling for fiscal 2028 revenue to increase by 70% year over year. And despite higher memory chip costs, Nvidia's margins remain sky-high, which is leading to surging FCF.

Nvidia CFO Colette Kress said the following on Nvidia's second-quarter fiscal 2027 earnings call:

In Q2, we returned a record $26 billion to shareholders, $20 billion through share repurchases, and $6 billion through our quarterly dividend of $0.25 per share. Relative to our plan to return 50% or more of free cash flow, we have returned 60% on a year-to-date basis. Going forward, we intend to increase and return excess free cash flow net of strategic uses.

That commentary suggests Nvidia is generating more cash than it knows what to do with, even after accounting for capital expenditures and operating expenses. So, going forward, it will simply pass more cash directly to shareholders. And given that buybacks are still more than 4 times larger than its dividends, I could see Nvidia continuing to increase its payout to shareholders.

Nvidia remains a compelling value

Nvidia is transitioning from a cyclical semiconductor stock to a steady cash cow with a broadening customer base that includes hyperscalers, AI labs, AI start-ups, and enterprises that need compute. Nvidia will reduce its sensitivity to cyclical downturns as more companies depend on its hardware and software ecosystem for AI compute, from generative AI use cases to inference-heavy agentic AI becoming mainstream in enterprise workflows.

I could see a large portion of Nvidia's business become more dependent on maintaining and upgrading AI infrastructure than on an influx of hyperscaler spending. And if that happens, Nvidia could gradually evolve into an even higher-margin, higher-quality version of what Apple is today. Only Nvidia trades at just 23.4 times forward earnings compared to 36.2 for Apple.

Add it all up, and Nvidia remains one of the best AI stocks to buy now, especially for investors looking for a proven company with growing earnings rather than one priced on sky-high expectations alone.

Should you buy stock in Nvidia right now?

Before you buy stock in Nvidia, consider this:

The Motley Fool Stock Advisor analyst team just identified what they believe are the 10 best stocks for investors to buy now… and Nvidia wasn’t one of them. The 10 stocks that made the cut could produce monster returns in the coming years.

Consider when Netflix made this list on December 17, 2004... if you invested $1,000 at the time of our recommendation, you’d have $437,097!* Or when Nvidia made this list on April 15, 2005... if you invested $1,000 at the time of our recommendation, you’d have $1,355,077!*

Now, it’s worth noting Stock Advisor’s total average return is 978% β€” a market-crushing outperformance compared to 213% for the S&P 500. Don't miss the latest top 10 list, available with Stock Advisor, and join an investing community built by individual investors for individual investors.

See the 10 stocks Β»

*Stock Advisor returns as of September 2, 2026.

Daniel Foelber has positions in Nvidia. The Motley Fool has positions in and recommends Apple and Nvidia. The Motley Fool has a disclosure policy.
☐ β˜† βœ‡ The Motley Fool

Nvidia Is 7.6% of the Vanguard S&P 500 ETF (VOO) but Over 12% of These 5 Magnificent Low-Cost Vanguard ETFs. Here's My Top Pick to Buy Now.

By: newsfeedback@fool.com (Daniel Foelber) β€”

Key Points

  • Growth ETFs offer even more exposure to Nvidia than the S&P 500.

  • The Vanguard Information Technology ETF has the highest Nvidia weighting among Vanguard’s low-cost equity ETFs.

  • The tech sector is one best ways to get exposure to leading AI stocks across the value chain.

Nvidia (NASDAQ: NVDA) soared 8.7% on Aug. 27, after the company delivered blowout second-quarter fiscal 2027 earnings. Nvidia's market cap closed on Aug. 27 at $5.52 trillion -- nearly a trillion more than the world's second most valuable company, Apple.

Nvidia is so massive that it makes up a significant portion of the S&P 500 (SNPINDEX: ^GSPC) and index funds and exchange-traded funds (ETFs) that track the index, like the Vanguard S&P 500 ETF (NYSEMKT: VOO). But investors looking to maximize their Nvidia exposure while keeping a lid on ETF fees may want to take a closer look at Vanguard ETFs that have higher Nvidia weightings than the S&P 500.

Missed Nvidia in 2009? This Rare Signal Is Flashing Again. In 2009, a "Double Down" signal flashed for a little-known chipmaker called Nvidia. For the first time in years, that same "Total Conviction" signal is flashing for a company 1/100th the size of Nvidia. Continue Β»

Here are five to watch, and one that stands out as the best buy now.

Abstract design showcasing data-driven demand for increasingly complex artificial intelligence (AI) compute architectures.

Image source: Getty Images.

Betting big on Nvidia through an ETF wrapper

As of July 31, Nvidia made up 7.6% of the Vanguard S&P 500 ETF. But six ETFs hold even larger Nvidia positions. And five have more than 12% weightings in Nvidia.

Vanguard ETF

Nvidia
% of Fund

No. of
Holdings

Expense
Ratio

Vanguard Information Technology ETF (NYSEMKT: VGT)

17.2%

319

0.09%

Vanguard Russell 1000 Growth ETF (NASDAQ: VONG)

14.6%

370

0.06%

Vanguard S&P 500 Growth ETF (NYSEMKT: VOOG)

13.9%

148

0.07%

Vanguard Morningstar Mega Cap Growth ETF (NYSEMKT: MGK)

13.5%

56

0.05%

Vanguard Morningstar Growth ETF (NYSEMKT: VUG)

12.8%

147

0.03%

Vanguard Morningstar Mega Cap ETF (NYSEMKT: MGC)

8.8%

172

0.05%

Vanguard S&P 500 ETF

7.6%

505

0.03%

Data source: Vanguard. Holdings as of July 31, 2026.

The Vanguard Morningstar Mega Cap ETF is essentially a more concentrated version of the S&P 500, tracking the largest S&P 500 components. But that includes value stocks and growth stocks, which is why the Nvidia weighting is only slightly more than the S&P 500.

The Vanguard Morningstar Mega Cap Growth ETF has the fewest components on this list because it screens strictly for mega cap growth stocks, which leaves out the mega cap value stocks and large cap growth stocks and value stocks that you'll find in an S&P 500 ETF.

The Vanguard S&P 500 Growth ETF filters the S&P 500 for growth stocks, while the Vanguard Russell 1000 Growth ETF screens the Russell 1000 index for growth stocks. The Vanguard Morningstar Growth ETF is very similar to the Vanguard S&P 500 Growth, but it isn't benchmarked to the S&P 500 index, so its components can vary slightly.

The Vanguard Information Technology ETF is a technology sector ETF. So it invests strictly in stocks that are in the tech sector, like Nvidia, Apple, Microsoft, Broadcom, Micron Technology, and Advanced Micro Devices -- leaving out the megacap growth stocks that are in other sectors -- such as Amazon and Tesla (consumer discretionary) and communication sector components Alphabet, Meta Platforms, and Space Exploration Technologies. At 0.09%, the Vanguard Tech ETF has the highest expense ratio of the ETFs discussed. But that's still just $9 per $10,000 invested, which is far lower than the fees many actively managed ETFs and mutual funds charge.

A top ETF for loading up on AI stocks

The best ETF to buy is the one that aligns with your investment objectives, risk tolerance, and complements your existing holdings. Investors looking for more exposure to growth stocks than the S&P 500 provides may want to consider the S&P 500 Growth ETF, Russell 1000 Growth ETF, or Mega Cap Growth ETF. The Mega Cap Growth ETF is a pretty good buy for investors looking to bet big on the largest growth stocks, as it has a whopping 69.7% invested in just 10 holdings -- Nvidia, Apple, Alphabet, Microsoft, Amazon, Broadcom, Meta Platforms, Eli Lilly, Tesla, and AMD.

However, investors seeking to maximize their exposure to artificial intelligence (AI) stocks may want to consider buying the Vanguard Information Technology ETF rather than growth ETFs that include stocks from other sectors. A jaw-dropping 47.9% of the fund is invested in semiconductor stocks led by Nvidia, Broadcom, Micron, and AMD. However, the ETF is also a great way to get exposure to the entire AI value chain.

It has 27.2% in Apple and Microsoft. Microsoft is a leading hyperscaler that is investing heavily in AI data centers, but it's also a massive software and consumer electronics company -- making it closer to the end user of AI upgrades and tools than semiconductor companies. Similarly, Apple is taking a capital-light approach to AI by providing the hardware upon which AI developers and tools can run. In this vein, Apple is essentially a bet that AI will be used more regularly on phones, computers, and tablets -- regardless of which models or applications capture market share.

The Vanguard Information Technology ETF also holds software stocks like Salesforce, which just popped 22.6% after reporting earnings due to a partnership with Anthropic, strong demand for its AI products, and higher guidance. So while the Vanguard Information Technology ETF is a bold bet on the build-out of AI infrastructure, it also has exposure to application software companies that will increasingly layer generative and agentic AI into their offerings and, in turn, will drive demand for compute.

In sum, buying a low-cost tech sector ETF like the Vanguard Information Technology ETF is a great way to bet on the future of AI rather than just what is working today.

Should you buy stock in Nvidia right now?

Before you buy stock in Nvidia, consider this:

The Motley Fool Stock Advisor analyst team just identified what they believe are the 10 best stocks for investors to buy now… and Nvidia wasn’t one of them. The 10 stocks that made the cut could produce monster returns in the coming years.

Consider when Netflix made this list on December 17, 2004... if you invested $1,000 at the time of our recommendation, you’d have $440,710!* Or when Nvidia made this list on April 15, 2005... if you invested $1,000 at the time of our recommendation, you’d have $1,335,252!*

Now, it’s worth noting Stock Advisor’s total average return is 978% β€” a market-crushing outperformance compared to 213% for the S&P 500. Don't miss the latest top 10 list, available with Stock Advisor, and join an investing community built by individual investors for individual investors.

See the 10 stocks Β»

*Stock Advisor returns as of September 1, 2026.

Daniel Foelber has positions in Broadcom and Nvidia. The Motley Fool has positions in and recommends Advanced Micro Devices, Alphabet, Amazon, Apple, Broadcom, Eli Lilly, Meta Platforms, Micron Technology, Microsoft, Nvidia, Salesforce, Tesla, Vanguard Morningstar Growth ETF, and Vanguard S&P 500 ETF. The Motley Fool has a disclosure policy.

☐ β˜† βœ‡ The Motley Fool

You Could Buy Nvidia for Its 106% Revenue Growth and 75% Gross Margin. But There's an Even Better Reason the AI Stock Has Room to Run.

By: newsfeedback@fool.com (Daniel Foelber) β€”

Key Points

  • Nvidia delivered excellent revenue growth, margins, and guidance.

  • Customers are lining up to buy its next-generation Vera Rubin supercomputer.

  • Nvidia has a long runway for future growth, making the stock a great buy even around an all-time high.

Despite sky-high expectations, Nvidia (NASDAQ: NVDA) delivered yet another blowout quarter that featured $96.2 billion in revenue -- up 106% year over year and 18% quarter over quarter, along with a 75% gross margin. The gross margin was especially impressive, considering surging prices for memory chips -- which Nvidia buys and integrates into its rack-scale Vera Rubin platform. However, Nvidia does expect gross margin to tick down to 74% in the upcoming third quarter of fiscal 2027, with revenue at $108 billion, up 12.3% quarter over quarter.

Still, the results were impeccable, and so was Nvidia's guidance for a 70% increase in fiscal 2028 revenue compared with fiscal 2027, driven by surging demand from hyperscalers, artificial intelligence (AI) labs, AI natives, enterprises, and sovereign customers. The guidance reinforces the need for rapidly expanding AI infrastructure and follows up on Nvidia's recently announced partnerships with financial institutions for $500 billion in AI capital investment to build Nvidia's computing and full-stack AI infrastructure. The computing will be sold to AI labs, AI start-ups, AI clouds, and other enterprises that need computing power.

Missed Nvidia in 2009? This Rare Signal Is Flashing Again. In 2009, a "Double Down" signal flashed for a little-known chipmaker called Nvidia. For the first time in years, that same "Total Conviction" signal is flashing for a company 1/100th the size of Nvidia. Continue Β»

There was a lot to like about Nvidia's report and earnings call. But there's one metric that stood out above the rest. Here's my biggest takeaway from Nvidia's Q2 earnings, and why it cements Nvidia as one of the best growth stocks to buy now.

An Nvidia sign with the company’s logo in front of Nvidia’s headquarters.

Image source: Getty Images.

Vera Rubin extends far beyond GPUs

In May, Nvidia announced that its Vera Rubin platform had ramped up into full production, with shipments beginning this fall, aligning with Nvidia's upcoming Q3 fiscal 2027. On the Aug. 26 Q2 fiscal 2027 earnings call, Nvidia confirmed that shipments began in August and expects Vera Rubin to account for 20% of its data center revenue in Q3. For context, data center revenue was 92.5% of Nvidia's total Q2 revenue.

The speed at which Vera Rubin will affect Nvidia's top line was the best part of Nvidia's latest print -- more important than its quarterly results or next quarter's guidance. Rubin represents the fastest product ramp-up in Nvidia's history. And the fact that it's already contributing so much to Nvidia's results shows that demand continues to far outpace Nvidia's supply. So with Rubin sales pouring in for the back half of fiscal 2027 and fiscal 2028, it's unsurprising that Nvidia's guidance came in well ahead of expectations.

While Rubin will undoubtedly have a major impact on Nvidia's near-term results, there's an even bigger takeaway for long-term investors: Nvidia's customers are willing to pay a premium for Rubin, meaning its benefits clearly outweigh the high price tag.

Unlike earlier architectures, Rubin comprises more than just graphics processing units (GPUs). It includes a rack-scale offering for data centers that includes six Nvidia chips -- GPUs, central processing units (CPUs), and interconnects. Rubin is tailor-made for large-scale, cost-effective AI training and inference needed from AI factories. And because Rubin is essentially bundled as a rack-scale plug-and-play offering for AI data centers, Nvidia is capturing a larger share of data center revenue than in the past.

On the Q2 fiscal 2027 earnings call, Nvidia's CFO Colette Kress went into detail about why Rubin is more profitable than its previous platforms:

Our second unique capability is our full-stack AI factory platform that is expanding our share of the data center TAM [total addressable market]. Since Hopper, our revenue opportunity has grown from roughly $18 billion per gigawatt to $25 billion with Blackwell, to $40 billion with Vera Rubin, which now spans Vera CPU, Rubin GPU, NVLink, InfiniBand or Ethernet, and Groq LPU, announced earlier this week. Our ability to extreme co-design across GPU, CPU, NVLink scale-up networking, scale-out networking, systems, algorithms, and software enables us to deliver X factor performance gain every generation. Vera Rubin exemplifies this, delivering 30x higher throughput per megawatt and 35x lower token cost relative to Grace Blackwell Ultra. We commenced production shipments of Vera Rubin earlier this month. Having already received purchase orders from every major hyperscaler, AI cloud, and system OEM [original equipment manufacturer], we expect Vera Rubin to mark the fastest product ramp in Nvidia's history.

Despite ongoing fears that Nvidia's growth would eventually slow, the company continues to prove that its large size is not yet a limiting factor, as its business is evolving from cyclical hardware sales to being the primary provider of AI computing infrastructure.

On the earnings call, Nvidia CEO Jensen Huang said he expects the vast majority of the world's data centers to be Vera Rubin NVL72 -- the official name of the rack-scale supercomputer that consists of 72 Rubin GPUs, 36 Vera CPUs, memory chips, and networking.

Nvidia is well-positioned to capture sales from new AI factories, as well as swap out racks of older Nvidia tech with this latest platform -- once again proving that Vera Rubin really is a monumental breakthrough in AI training and inference rather than a marginal upgrade over Grace Blackwell Ultra.

Nvidia remains a high-conviction buy

While it's easy to get enamored with Nvidia's quarterly results, long-term investors should focus on Nvidia's development pipeline. Nvidia used to rely mainly on one-off GPU hardware sales. Now, Nvidia is expanding into a product and service ecosystem that includes software, AI networking, and other hardware to support AI infrastructure at scale.

Nvidia's innovation shows no signs of slowing, and its business model is now far less cyclical than in the past, supporting high margins and ample free cash flow.

Add it all up, and Nvidia continues to stand out as the foundational AI stock for long-term investors to buy and hold for years, if not decades to come.

Should you buy stock in Nvidia right now?

Before you buy stock in Nvidia, consider this:

The Motley Fool Stock Advisor analyst team just identified what they believe are the 10 best stocks for investors to buy now… and Nvidia wasn’t one of them. The 10 stocks that made the cut could produce monster returns in the coming years.

Consider when Netflix made this list on December 17, 2004... if you invested $1,000 at the time of our recommendation, you’d have $440,710!* Or when Nvidia made this list on April 15, 2005... if you invested $1,000 at the time of our recommendation, you’d have $1,335,252!*

Now, it’s worth noting Stock Advisor’s total average return is 978% β€” a market-crushing outperformance compared to 213% for the S&P 500. Don't miss the latest top 10 list, available with Stock Advisor, and join an investing community built by individual investors for individual investors.

See the 10 stocks Β»

*Stock Advisor returns as of August 31, 2026.

Daniel Foelber has positions in Nvidia. The Motley Fool has positions in and recommends Nvidia. The Motley Fool has a disclosure policy.

☐ β˜† βœ‡ The Motley Fool

Alphabet and Nvidia Own More SpaceX Than BlackRock and Vanguard Combined. Here's Why That's About to Change.

By: newsfeedback@fool.com (Daniel Foelber) β€”

Key Points

  • For now, institutional ownership of SpaceX is concentrated in early investors rather than ETF operators.

  • SpaceX will eventually become a key holding across the world’s largest ETFs.

  • Don’t be surprised if some key early SpaceX investors decide to hold their shares even after they are unlocked.

You can buy Space Exploration Technologies (NASDAQ: SPCX) on the Nasdaq, but the vast majority of shares are still locked up. On June 12, the company sold 639 million shares at its initial public offering (IPO) -- making roughly 5% of the share count available for sale, with another massive wave of 911.5 million shares becoming eligible for sale on Aug. 6. More shares will be unlocked in the coming months, but that doesn't mean that early investors have to sell, it just means they can if they want to.

So naturally, SpaceX investors may be curious to know who is holding shares. Second-quarter 2026 Form 13F filings submitted to the Securities and Exchange Commission just revealed major SpaceX shareholders, including high-profile corporations, hedge funds, asset managers, venture capital firms, and even endowments, such as Harvard and the University of California.

Missed Nvidia in 2009? This Rare Signal Is Flashing Again. In 2009, a "Double Down" signal flashed for a little-known chipmaker called Nvidia. For the first time in years, that same "Total Conviction" signal is flashing for a company 1/100th the size of Nvidia. Continue Β»

With 551,189,500 shares, Alphabet (NASDAQ: GOOG) (NASDAQ: GOOGL) is the second-largest SpaceX holder behind founder and CEO Elon Musk. Nvidia (NASDAQ: NVDA) is also a top holder with 122,764,805 shares.

As of July 28, SpaceX had 7,696,293,669 Class A shares and 5,485,486,276 Class B shares for 13,181,779,945 total shares -- giving Alphabet a 4.2% stake and Nvidia a 0.9% stake. That's significantly more than BlackRock's (NYSE: BLK) 51,037,137 SpaceX shares, Vanguard Capital Management's 26,556,713 shares, and Vanguard Portfolio Management's 10,225,389 shares.

Here's why Alphabet and Nvidia own large stakes in SpaceX, why investors can expect major investment management companies to own significantly more SpaceX in the coming months, and why the highly anticipated unlocking of SpaceX shares may not be as big an event as some investors think.

A satellite orbiting Earth with a hurricane visible below.

Image source: Getty Images.

High-profile SpaceX investors

The latest 13F filings don't necessarily reflect recent purchases, but rather, an up-to-date tally of SpaceX ownership by major holders.

Alphabet invested $900 million in SpaceX back in 2015 -- a brilliant move in hindsight. Nvidia invested $10 billion in xAI in January before SpaceX bought xAI in February -- converting Nvidia's xAI shares into SpaceX shares. So, in both cases, Alphabet and Nvidia owned SpaceX stock before the IPO. BlackRock and Vanguard are buying SpaceX on behalf of their clients, many of whom are households loading up on post-IPO shares.

SpaceX's ownership will soon shift from early investors who backed it years ago (and some decades ago) to new investors buying it on the Nasdaq.

BlackRock and Vanguard are the two largest institutional holders of most stocks because they are the largest issuers of index funds and exchange-traded funds (ETFs). For context, BlackRock, Vanguard Capital Management, and Vanguard Portfolio Management hold a combined 17% of Microsoft (NASDAQ: MSFT) and 16.8% of Apple (NASDAQ: AAPL).

A gradual rather than rapid ownership shift

SpaceX's float will increase as more SpaceX shares are unlocked and begin trading on the Nasdaq. The float is simply the number of shares available for public trading. As the float grows, investment management firms like BlackRock and Vanguard will increase their stakes in SpaceX. Nine Vanguard ETFs opened positions in SpaceX in June, and those positions will likely increase if insiders sell shares and if SpaceX's market cap increases.

The snowball will really start to grow once SpaceX is added to the S&P 500 (SNPINDEX: ^GSPC), which could occur as early as June 2027. When that happens, the S&P 500 index funds and ETFs will begin gobbling up SpaceX shares.

However, investors shouldn't expect SpaceX's float to magically balloon overnight. There are plenty of companies where insiders hold considerable positions even though the company has been public for decades, such as Oracle (NYSE: ORCL), where Larry Elisosn still owns roughly 40%.

All SpaceX shares will be unlocked in December, except for insiders like Elon Musk, whose shares will be unlocked in June 2027. Eventually, BlackRock and Vanguard will probably overtake Alphabet and Nvidia's stakes. But even if the shares were magically unlocked today, I wouldn't expect Alphabet, Nvidia, or early and local investors like Ron Baron to offload big positions. I'd also expect Musk to keep a sizable stake, and big Tesla investors like Cathie Wood to continue building positions. Rather, I'd expect most of the shares sold on the Nasdaq to come from hedge funds and venture capitalists who bought SpaceX over its multiple funding rounds since its incorporation in 2002 and from employees who received restricted stock units.

All told, unlocking SpaceX shares is a big deal, but it could take a long time for the float to meaningfully increase and for major investment management firms like Vanguard and BlackRock to hold positions on behalf of their clients that rival those held by early investors.

Should you buy stock in Space Exploration Technologies right now?

Before you buy stock in Space Exploration Technologies, consider this:

The Motley Fool Stock Advisor analyst team just identified what they believe are the 10 best stocks for investors to buy now… and Space Exploration Technologies wasn’t one of them. The 10 stocks that made the cut could produce monster returns in the coming years.

Consider when Netflix made this list on December 17, 2004... if you invested $1,000 at the time of our recommendation, you’d have $432,621!* Or when Nvidia made this list on April 15, 2005... if you invested $1,000 at the time of our recommendation, you’d have $1,335,314!*

Now, it’s worth noting Stock Advisor’s total average return is 973% β€” a market-crushing outperformance compared to 213% for the S&P 500. Don't miss the latest top 10 list, available with Stock Advisor, and join an investing community built by individual investors for individual investors.

See the 10 stocks Β»

*Stock Advisor returns as of August 20, 2026.

Daniel Foelber has positions in Nvidia and Oracle and has the following options: long September 2028 $100 calls on Oracle and short August 2026 $240 calls on Nvidia. The Motley Fool has positions in and recommends Alphabet, Apple, BlackRock, Microsoft, Nvidia, Oracle, and Tesla. The Motley Fool has a disclosure policy.

☐ β˜† βœ‡ The Motley Fool

SpaceX Is Up 25% in August. Meet the 7 Vanguard ETFs That Just Bought More Shares.

By: newsfeedback@fool.com (Daniel Foelber) β€”

Key Points

  • Most Vanguard ETF holdings in SpaceX were little changed month over month.

  • The timing of SpaceX’s lockup schedule and a brutal sell-off in July slowed the buying.

  • SpaceX should become a top holding in the Vanguard Communication Services ETF before the end of the year.

Space Exploration Technologies (NASDAQ: SPCX) held its initial public offering (IPO) on June 12. And by June 30, nine exchange-traded funds (ETFs) managed by Vanguard had already loaded up on shares.

Missed Nvidia in 2009? This Rare Signal Is Flashing Again. In 2009, a "Double Down" signal flashed for a little-known chipmaker called Nvidia. For the first time in years, that same "Total Conviction" signal is flashing for a company 1/100th the size of Nvidia. Continue Β»

Vanguard just updated its holdings. And as of July 31, seven of those nine ETFs bought more SpaceX, as the company is also known.

Here's why major ETFs will continue buying SpaceX, why their pace of buying could surge in August, and the Vanguard ETF to buy for investors looking to maximize their exposure to the company.

Abstract design featuring a computer graphic of satellites orbiting Earth.

Image source: Getty Images.

The SpaceX buying spree cooled down

The Vanguard Morningstar Total Stock Market ETF (NYSEMKT: VTI), which is the second-largest ETF in the world by net assets, holds by far the largest position in SpaceX among Vanguard's ETFs. But as you can see in the table below, it added only 53,439 shares in July -- a mere 0.3% increase over its June holdings.

Vanguard ETF

Shares, as of June 30, 2026

Market Value, as of June 30

Shares, as of July 31, 2026

Market Value, as of July 31

Vanguard Morningstar Total Stock Market ETF

18,738,438

$3.202 billion

18,791,877

$2.036 billion

Vanguard Extended Market ETF (NYSEMKT: VXF)

6,775,494

$1.158 billion

6,800,441

$737 million

Vanguard Morningstar Growth ETF (NYSEMKT: VUG)

6,480,297

$1.107 billion

6,441,799

$698 million

Vanguard Morningstar Mega Cap Growth ETF (NYSEMKT: MGK)

942,362

$161 million

934,175

$101 million

Vanguard Communication Services ETF (NYSEMKT: VOX)

632,077

$142 million

842,835

$91 million

Vanguard Russell 1000 Growth ETF (NASDAQ: VONG)

757,638

$129 million

768,123

$83 million

Vanguard Morningstar Large-Cap ETF (NYSEMKT: VV)

689,533

$118 million

692,706

$75 million

Vanguard World Stock ETF (NYSEMKT: VT)

441,613

$75 million

447,193

$48 million

Vanguard Russell 1000 ETF (NASDAQ: VONE)

87,520

$15 million

88,261

$10 million

Data source: Vanguard.

Two of the nine Vanguard ETFs that bought SpaceX in June slightly reduced their share counts in July -- the Vanguard Morningstar Growth ETF and the Vanguard Morningstar Mega Cap Growth ETF.

The biggest increase came from the Vanguard Communication Services ETF, which boosted its share count by 33%. This is also the ETF with the highest percentage weighting in SpaceX, at 1.5%. Whereas the Total Stock Market ETF is so huge that its SpaceX position is just 0.09% of the fund.

SpaceX buying could jump in August

Given that SpaceX is one of the 10 most valuable companies in the world, investors may have expected it to account for a larger share in major ETFs. But there are two key reasons that didn't happen.

The first is that SpaceX didn't begin unlocking shares until two days after it reported second-quarter 2026 earnings on Aug. 4. So, although July represents the first full month SpaceX was public, the supply of shares was virtually unchanged since its IPO. The fact that many Vanguard ETF holdings barely budged shows they entered large positions within weeks of SpaceX going public, then hit the pause button.

So right off the bat, a key takeaway for investors is to expect the same kind of lightning-fast accumulation of shares in planned blockbuster IPOs, such as Anthropic and OpenAI -- followed by a lull until more shares are unlocked.

Second, SpaceX's falling stock price could have also been a contributing factor to the slowdown. The shares fell 37% in July as investors braced for the first wave of share unlocks that lets insiders and early investor sell shares and the company's first earnings call since going public. This is why the market value of the company across all nine Vanguard ETFs declined month over month, even in the funds that increased their share counts. However, the stock has completely turned the corner and is up about 25% in August as of Aug. 19.

SpaceX is weighted in ETFs at a multiple of its float -- which are the shares available for trading on the Nasdaq. The float will increase as more shares hit the Nasdaq, and if the stock price rises. So far in August, the stock has staged a rapid recovery, even after 20% of Early Release Eligible Shares were unlocked. Another 7% of Early Release Eligible Shares will be unlocked on Aug. 21.

SpaceX will become a top holding in this ETF

At this rate, I would expect passively managed funds, like the nine Vanguard ETFs discussed, to gobble up SpaceX in August. But the fund with the largest percentage weighting in the company will likely remain the Vanguard Communication Services ETF.

I correctly predicted that Vanguard would classify SpaceX in the communications sector, given that the majority of its revenue comes from its Starlink network of low-Earth-orbit satellites and its ownership of the social media platform X (formerly Twitter) and xAI. The communications sector is unique because it includes legacy media companies, stodgy telecommunications giants, and entertainment companies. But it also holds some major growth stocks, including Alphabet, Meta Platforms, and Netflix.

As of Aug. 19, SpaceX has a market cap of $1.8 trillion, which puts it in second place in the fund behind Alphabet's $4.2 trillion market cap but ahead of Meta Platforms, which has a $1.4 trillion market cap.

Investors looking for an ETF in which SpaceX is likely to pole-vault into a top holding in the coming months may want to take a closer look at the Vanguard Communication Services ETF.

Should you buy stock in Space Exploration Technologies right now?

Before you buy stock in Space Exploration Technologies, consider this:

The Motley Fool Stock Advisor analyst team just identified what they believe are the 10 best stocks for investors to buy now… and Space Exploration Technologies wasn’t one of them. The 10 stocks that made the cut could produce monster returns in the coming years.

Consider when Netflix made this list on December 17, 2004... if you invested $1,000 at the time of our recommendation, you’d have $419,408!* Or when Nvidia made this list on April 15, 2005... if you invested $1,000 at the time of our recommendation, you’d have $1,348,694!*

Now, it’s worth noting Stock Advisor’s total average return is 966% β€” a market-crushing outperformance compared to 213% for the S&P 500. Don't miss the latest top 10 list, available with Stock Advisor, and join an investing community built by individual investors for individual investors.

See the 10 stocks Β»

*Stock Advisor returns as of August 20, 2026.

Daniel Foelber has positions in Netflix. The Motley Fool has positions in and recommends Alphabet, Meta Platforms, Netflix, and Vanguard Morningstar Growth ETF. The Motley Fool has a disclosure policy.

☐ β˜† βœ‡ The Motley Fool

Nvidia Is on Track to Beat the S&P 500 for the 4th Straight Year. Should Its $500 Billion AI Infrastructure Financing Plan Give Investors Pause?

By: newsfeedback@fool.com (Daniel Foelber) β€”

Key Points

  • Nvidia is using third-party capital to fund an AI infrastructure investable asset class.

  • The more customers that join Nvidia’s ecosystem, the greater the demand for its hardware and software.

  • Nvidia’s compute is transferable across customers, providing flexibility as clients' needs shift.

Since the start of 2023, Nvidia (NASDAQ: NVDA) has given its shareholders a staggering 1,440% total return compared to a 113.2% total return for the S&P 500 (SNPINDEX: ^GSPC). As of market close on Aug. 14, Nvidia was the best-performing "Magnificent Seven" stock year to date and the only one outperforming the Nasdaq-100 -- putting the chipmaker on track to beat the S&P 500 for the fourth straight year.

Here's what investors need to know about Nvidia's latest collaboration with major financial institutions, the risks involved, and why the deals could help Nvidia remain a long-term compounder for years to come.

Missed Nvidia in 2009? This Rare Signal Is Flashing Again. In 2009, a "Double Down" signal flashed for a little-known chipmaker called Nvidia. For the first time in years, that same "Total Conviction" signal is flashing for a company 1/100th the size of Nvidia. Continue Β»

Nvidia sign in front of the company's headquarters.

Image source: Nvidia.

Underwriting AI infrastructure

Nvidia is now so massive that it takes considerable earnings growth to move the needle -- specifically from its data center segment, which made up 92% of revenue in the first quarter of its fiscal 2027. It is heavily reliant on a handful of customers -- such as hyperscalers and the leading developers of artificial intelligence (AI) models -- to drive its earnings growth. That concentration is a double-edged sword. It is benefiting Nvidia right now because its key customers' AI capital expenditures continue to climb. But its results could take a significant hit even if one or two of those customers pull back on spending.

To broaden its customer base, Nvidia signed memorandums of understanding with BlackRock, Blackstone, KKR, Apollo Global Management, Brookfield, and Goldman Sachs to pull together $500 billion in long-term capital to fund the build-out of AI infrastructure. In an Aug. 10 interview on CNBC, Nvidia founder and CEO Jensen Huang estimated that each gigawatt (GW) of AI compute will cost between $50 billion and $60 billion, meaning the consortium is supporting the build-out of 10 GW of AI compute on the high end.

It remains to be seen whether the memorandums of understanding will translate into real deals and how the money will be raised. But in the CNBC interview, the group of financial partners signaled ample demand in both public and private markets.

The securitization of AI computing

At first glance, $500 billion in AI capital investment appears to be a massive win for Nvidia. The GPU leader won't bear the credit risk of the investment; the financial institutions will. The plan is to securitize AI infrastructure assets, much like how pools of mortgage loans are securitized into mortgage-backed securities. Since the assets all fall under Nvidia's ecosystem, the company's track record and brand power reinforce the credibility of the loans.

The deal essentially places AI infrastructure in the same category as other critical assets, such as electrical transmission lines, bridges, and roads. Financial institutions will raise the capital to turn Nvidia's compute and full-stack AI infrastructure into an investable asset class, owned by public and private investors. Then, that compute can be sold to AI labs, AI start-ups, AI clouds, and other enterprises that need compute.

Of course, selling that compute means little if the customers' cash flows dry up. But Nvidia is confident in the profitability pathway for its existing and potential customers. Jensen Huang said the following in the Aug. 10 interview with CNBC:

I believe within months you're going to realize that these companies are extremely profitable. These are the fastest-growing technology companies in history, and the tokens they're generating are incredibly profitable.

Tokens are basic units of text and data that AI models process. Nvidia prides itself on producing hardware that processes tokens as quickly and cost-effectively as possible. Huang stressed that every company and industry will be impacted by the digitalization of intelligence through AI and that the system architecture of the AI compute deal is flexible. Meaning that if one customer needed to scale back their commitments, it would be easy for a new customer to step in -- regardless of the model -- and use that compute in a similar vein as electricity on the grid that can be used interchangeably.

The fungibility of Nvidia's AI compute is arguably the strongest competitive advantage of the deal.

"There will always be a customer for that computing platform," said Huang during the Aug. 10 CNBC interview. "And the reason for that is because, as you know, Nvidia's architecture is fairly universally adopted. It runs every AI model."

Nvidia has plenty of room to run

Some investors may view the $500 billion AI financing news as a red flag because it resembles the kind of financial engineering that transformed a housing slowdown into a nationwide financial crisis in 2008. If public and private investors own securities tied to Nvidia AI infrastructure and demand for that infrastructure craters, those securities would lose value -- amplifying the impact of an AI slowdown.

There are plenty of unanswered questions around the structure of the financing deal. But I think the idea is absolutely brilliant for Nvidia.

If you've tuned in to Nvidia's major conferences (like GTC) or its recent earnings calls, you may have noticed an ongoing theme: Nvidia wants to expand beyond one-time hardware sales.

Nvidia is evolving into a product and service ecosystem rather than just a chip business. Its latest Vera Rubin rack-scale high-performance computing platform features GPUs, central processing units, and associated networking and interconnects. Its CUDA software stack is co-designed to work with Vera Rubin. The $500 billion deal helps solidify Nvidia as the most commonly used ecosystem for AI compute customers, which will depend on it to process tokens in the age of AI infrastructure. Token demand will increase in lockstep with the use of generative AI, AI agents, and physical AI (like self-driving cars and robotics) -- in turn benefiting Nvidia through an inferencing-as-a-service revenue stream.

The biggest risk to Nvidia's investment case is how it would endure a slowdown in spending on data center computing. And the best way to address that risk is for Nvidia to get more and more customers involved in its ecosystem, so they depend on its services and upgrade to its latest hardware when the cycle calls for it. It's basically the enterprise-scale version of what Apple does with its consumer electronics products and associated services -- like iCloud, Apple TV, and Apple Music.

Trading now at just 34.5 times earnings and 25.1 times forward earnings, Nvidia remains one of the best AI stocks for long-term investors to buy as the company continues to diversify its revenue streams beyond hyperscale hardware spending.

Should you buy stock in Nvidia right now?

Before you buy stock in Nvidia, consider this:

The Motley Fool Stock Advisor analyst team just identified what they believe are the 10 best stocks for investors to buy now… and Nvidia wasn’t one of them. The 10 stocks that made the cut could produce monster returns in the coming years.

Consider when Netflix made this list on December 17, 2004... if you invested $1,000 at the time of our recommendation, you’d have $409,970!* Or when Nvidia made this list on April 15, 2005... if you invested $1,000 at the time of our recommendation, you’d have $1,381,040!*

Now, it’s worth noting Stock Advisor’s total average return is 969% β€” a market-crushing outperformance compared to 215% for the S&P 500. Don't miss the latest top 10 list, available with Stock Advisor, and join an investing community built by individual investors for individual investors.

See the 10 stocks Β»

*Stock Advisor returns as of August 18, 2026.

Daniel Foelber has positions in Apollo Global Management, Blackstone, and Nvidia and has the following options: short August 2026 $240 calls on Nvidia. The Motley Fool has positions in and recommends Apple, BlackRock, Blackstone, Brookfield Corporation, Goldman Sachs Group, KKR, and Nvidia. The Motley Fool has a disclosure policy.
☐ β˜† βœ‡ The Motley Fool

Meet the Vanguard ETF That's Crushing the S&P 500 and Nasdaq-100 Despite Not Owning Micron, Sandisk, or Any of the "Magnificent Seven" Stocks

By: newsfeedback@fool.com (Daniel Foelber) β€”

Key Points

Sandisk (NASDAQ: SNDK) has been by far the best-performing S&P 500 (SNPINDEX: ^GSPC) stock in 2026 with a 544% year to date gain as of the market close on Aug. 13. Sandisk is followed by Dell Technologies, Seagate Technology, Micron Technology (NASDAQ: MU) -- which now has a market cap of more than $1 trillion -- Intel, Western Digital, Marvell Technology, Hewlett Packard Enterprise, Lumentum, and Advanced Micro Devices. So the 10 best-performing S&P 500 stocks are all tech stocks with significant exposure to the boom in artificial intelligence (AI) spending.

Given that concentration, you may think that large-cap tech stocks are driving the market to new heights. But surprisingly, small-cap stocks are outperforming mid-, large-, and mega-cap stocks in 2026 -- as well as the S&P 500 and Nasdaq-100 -- which is the largest non-financial companies by market cap in the Nasdaq Composite (NASDAQINDEX: ^IXIC)

Missed Nvidia in 2009? This Rare Signal Is Flashing Again. In 2009, a "Double Down" signal flashed for a little-known chipmaker called Nvidia. For the first time in years, that same "Total Conviction" signal is flashing for a company 1/100th the size of Nvidia. Continue Β»

Here's why the Vanguard Morningstar Small-Cap ETF (NYSEMKT: VB) presents one of the best ways to invest in small-cap stocks, and why the exchange-traded fund could be a buy now.

A person in a coffee shop looking at a computer.

Image source: Getty Images.

An AI-driven rally

In 2022, the S&P 500 fell 19%, and the Nasdaq-100 fell 33%, as investors questioned valuations and digested inflationary pressures. But on Nov. 30, 2022, OpenAI released ChatGPT for free. What has followed has been nothing short of paradigm-shifting momentum in the U.S. stock market -- driven largely by artificial intelligence (AI), the technology sector, and mega-cap growth stocks.

The gains were so large that Bank of America analyst Michael Hartnett popularized the term "Magnificent Seven" in 2023 to describe seven tech-fueled mega-cap growth stocks -- Nvidia (NASDAQ: NVDA), Apple, Alphabet, Microsoft, Amazon, Meta Platforms, and Tesla. The AI-driven rally has expanded significantly beyond the Magnificent Seven, with the biggest winners in 2026 largely companies benefiting from record AI capital spending -- from memory chip stocks to networking companies to semiconductor equipment makers.

Changing of the guard

Despite the rallies in tech stocks like Sandisk and Micron, there has been a slowdown in the mega-cap dominance. In fact, Nvidia and Amazon are the only Magnificent Seven stocks that are outperforming the S&P 500 year to date -- and Meta Platforms and Tesla have declined.

NVDA Chart

NVDA data by YCharts

Big gains in semiconductor stocks have certainly contributed to strong 2026 performances in the S&P 500 and Nasdaq-100. But dig deeper, and there's an equally interesting force at play -- which is the rebound in mid- and small-cap stocks.

^NDX Chart

^NDX data by YCharts

The boom in AI growth stocks coincided with the Nasdaq-100 more than doubling during the past five years, which is particularly impressive considering that period includes the 2022 sell-off. At the same time, small-cap stocks were drastically underperforming their large-cap peers. But in 2026, small caps are doing better than other large and mega-caps, as well as the major indexes.

VB Total Return Level Chart

VB Total Return Level data by YCharts

Small-cap stocks remain a good value

Funds like the Vanguard Morningstar Small-Cap ETF tend to perform well when investors question mega-cap growth stock valuations and shift toward value stocks. Even after its strong performance in 2026, the Small-Cap ETF features a mere 22.3 price-to-earnings (P/E) ratio, which is noticeably lower than the Vanguard S&P 500 ETF's (NYSEMKT: VOO) 27.5 P/E ratio.

Unlike the S&P 500, which has more than half of its weighting in just 5% of its holdings, the Vanguard Small-Call ETF has 1,311 holdings, and the largest holding makes up just 0.54% of the fund. Top holdings in the Vanguard S&P 500 ETF include well-known companies like Nvidia, Alphabet, and Apple -- which make up a combined 20.5% of the ETF. The top holdings in the Vanguard Morningstar Small-Cap ETF are companies you may have never heard of, like Credo Technology, Jabil, Revolution Medicines, and Astera Labs.

The easiest way to visualize the difference between the Small-Cap ETF and the S&P 500 ETF is to look at their sector components.

Sector

Vanguard Morningstar Small-Cap ETF

Vanguard S&P 500 ETF

Industrials

22.4%

8.8%

Technology and Communications

16.8%

47.7%

Consumer Discretionary

12.8%

9.3%

Financials

12.3%

11.8%

Healthcare

12.3%

8.9%

Real Estate

7.4%

1.8%

Basic Materials

4.7%

1.8%

Energy

4.4%

3%

Utilities

3.6%

2.2%

Consumer Staples

3.3%

4.6%

Other

0%

0.1%

Data source: Vanguard.

As you can see in the table, the Vanguard S&P 500 ETF has a far higher weighting in technology and communications than the Small-Cap ETF, which is highly concentrated in value and cyclically focused sectors. In addition to having a lower valuation, the Small-Cap ETF also has a higher dividend yield of 1.3%, compared to just 1% for the Vanguard S&P 500 ETF. And both ETFs have identical 0.03% expense ratios -- which is just $0.30 for every $1,000 invested.

A good ETF for value investors

The best reason to invest in an ETF is if it fills a particular need in your portfolio -- especially one that is hard to replicate through buying individual stocks. If your portfolio is already built around mega- and large-cap S&P 500 stocks, then buying the Vanguard S&P 500 ETF can be redundant and duplicate existing holdings. Whereas the Vanguard Small-Cap ETF would provide significant diversification, as many of its holdings are stocks you may be less familiar with.

In sum, the Vanguard Small-Cap ETF is a good buy for investors looking for an ultra-low-cost way to get exposure to a basket of more than 1,000 stocks -- most of which they probably don't already own.

Should you buy stock in Vanguard Morningstar Small-Cap ETF right now?

Before you buy stock in Vanguard Morningstar Small-Cap ETF, consider this:

The Motley Fool Stock Advisor analyst team just identified what they believe are the 10 best stocks for investors to buy now… and Vanguard Morningstar Small-Cap ETF wasn’t one of them. The 10 stocks that made the cut could produce monster returns in the coming years.

Consider when Netflix made this list on December 17, 2004... if you invested $1,000 at the time of our recommendation, you’d have $421,511!* Or when Nvidia made this list on April 15, 2005... if you invested $1,000 at the time of our recommendation, you’d have $1,381,960!*

Now, it’s worth noting Stock Advisor’s total average return is 981% β€” a market-crushing outperformance compared to 216% for the S&P 500. Don't miss the latest top 10 list, available with Stock Advisor, and join an investing community built by individual investors for individual investors.

See the 10 stocks Β»

*Stock Advisor returns as of August 18, 2026.

Bank of America is an advertising partner of Motley Fool Money. Daniel Foelber has positions in Nvidia and has the following options: short August 2026 $240 calls on Nvidia. The Motley Fool has positions in and recommends Advanced Micro Devices, Alphabet, Amazon, Apple, Hewlett Packard Enterprise, Intel, Lumentum, Marvell Technology, Meta Platforms, Micron Technology, Microsoft, Nvidia, Tesla, Vanguard S&P 500 ETF, and Western Digital. The Motley Fool recommends Astera Labs. The Motley Fool has a disclosure policy.

☐ β˜† βœ‡ The Motley Fool

The Vanguard S&P 500 ETF (VOO) Beat the Vanguard Morningstar Total Stock Market ETF (VTI) for 4 Straight Years. Here's Why That's About to Change.

By: newsfeedback@fool.com (Daniel Foelber) β€”

Key Points

  • Mega-cap growth stocks have been driving the U.S. stock market and market-cap weighted indexes like the S&P 500 to new heights.

  • The Total Stock Market ETF’s exposure to small and mid-cap stocks is making a difference in 2026.

  • The Total Stock Market ETF will buy IPO stocks much more quickly than the Vanguard S&P 500 ETF.

The Vanguard S&P 500 ETF (NYSEMKT: VOO) and Vanguard Morningstar Total Stock Market ETF (NYSEMKT: VTI) are two of the simplest and most cost-effective ways to get exposure to the broader U.S. stock market.

The Vanguard S&P 500 ETF mirrors the performance of the S&P 500 (SNPINDEX: ^GSPC), while the Vanguard Total Stock Market ETF reflects the entire U.S. stock market with 3,531 holdings. Given that the S&P 500 makes up roughly 80% of the total U.S. stock market, investors may view the two ETFs as virtually interchangeable. But it's impossible to ignore that the Vanguard S&P 500 ETF outperformed the Total Stock Market ETF from 2022 through 2025, and why that pattern is breaking.

Missed Nvidia in 2009? This Rare Signal Is Flashing Again. In 2009, a "Double Down" signal flashed for a little-known chipmaker called Nvidia. For the first time in years, that same "Total Conviction" signal is flashing for a company 1/100th the size of Nvidia. Continue Β»

Abstract image featuring multi-colored financial stock market bar charts.

Image source: Getty Images.

When it comes to ETFs, cost is king

The Vanguard S&P 500 ETF became the first ETF to surpass $1 trillion in net assets earlier this year. The Vanguard Total Stock Market ETF is massive too, with $666.9 billion in net assets as of July 31.

Both ETFs have reduced their annual fees as they have grown in size. They now charge mere 0.03% expense ratios -- or just $3 for every $10,000 invested. For context, other popular ETFs like the SPDR S&P 500 ETF Trust (NYSEMKT: SPY) have a 0.0945% expense ratio, the Invesco QQQ ETF (NASDAQ: QQQ) charges 0.18%, and active ETFs managed by Cathie Wood, such as the ARK Innovation ETF, feature 0.75% expense ratios.

The slight differences may not seem like much, but they can compound over time. Especially for folks who are looking for a broad-market ETF to contribute to and hold over a multi-decade period. This is why understanding the differences between investing in a passive S&P 500 fund and a total U.S. stock market fund is paramount.

Mega cap dominance

The Vanguard S&P 500 ETF is essentially a slightly more concerted version of the Total Stock Market ETF. With fewer holdings, it assigns a higher weight to the S&P 500 components than the Total Stock Market ETF does. The difference is tiny for most holdings. But in mega-cap territory, the concentration is more notable.

For example, the S&P 500 ETF has a 7.5% weighting in Nvidia compared to 6.3% for the Total Stock Market ETF. Nvidia, Apple, Alphabet, Microsoft, Amazon, Broadcom, Meta Platforms, Tesla, Micron Technology, and Eli Lilly account for 37.9% of the S&P 500 ETF, compared with 33.3% for the Total Stock Market ETF.

Mega-cap and large-cap stocks drive the performance of both ETFs. But the Vanguard S&P 500 ETF's extra weightings in high-octane growth stocks like Nvidia have paid off in recent years because those stocks have outperformed the mid-cap and small-cap stocks that make up roughly 20% of the Total Stock Market ETF.

A rebound in small- and mid-cap stocks

This year is different.

Total Return

2021

2022

2023

2024

2025

2026 YTD

Vanguard S&P 500 ETF

25.7%

(18.2%)

26.3%

25%

17.8%

13.9%

Vanguard Morningstar Total Stock Market ETF

28.8%

(19.5%)

26.1%

23.8%

17.1%

14.6%

Data source: Vanguard. Note: The 2026 figure is as of the Aug. 13 market close.

The Total Stock Market ETF is outperforming the S&P 500 ETF because it has exposure to small- and mid-cap stocks.

VB Total Return Level Chart

Data by YCharts.

Even after their recent run-up, mid and small caps are still generally cheaper than large caps -- as the Vanguard Morningstar Small-Cap ETF (NYSEMKT: VB) features a 22.3 price-to-earnings (P/E) ratio compared to 24.1 for the Vanguard Morningstar Mid-Cap ETF (NYSEMKT: VO) and 27.5 for the Vanguard S&P 500 ETF.

Some investors may be willing to pay a premium for large-cap companies if they believe they offer higher-quality growth prospects than smaller companies. Although the S&P 500's valuation is elevated compared to historical levels, many of today's market leaders have high profit margins, excellent balance sheets, and impeccable pricing power. So investors who believe these companies can continue to drive broader market gains may still prefer the S&P 500 ETF over the Total Stock Market ETF. Whereas folks looking for a bit more of a value tilt may lean toward the Total Stock Market ETF.

Another distinction worth noting is that the Total Stock Market ETF is far more flexible than the S&P 500 ETF. The Vanguard S&P 500 ETF is benchmarked to the S&P 500 index, so its components will change only when the index's composition shifts. For example, Space Exploration Technologies held its initial public offering (IPO) on June 12 and won't be added to the S&P 500 until June 2027 at the earliest. But as of June 30, the Total Stock Market ETF already bought 18.74 million shares of SpaceX stock, and likely added significantly to that position in July.

By mid-December, all of SpaceX's shares will be unlocked, and it could become a top 10 holding in the Total Stock Market ETF once it is weighted by market cap. Whereas the Vanguard S&P 500 will have no exposure. A similar pattern is likely to follow for other blockbuster mega-cap IPOs, such as Anthropic and OpenAI.

The better low-cost ETF to buy now

The Vanguard S&P 500 ETF and Total Stock Market ETF both have what it takes to be the primary investment vehicles for getting low-cost, broad-based market exposure. However, I think the Total Stock Market ETF is the better buy because it better captures the entire market as it is more flexible than the Vanguard S&P 500 ETF.

The Total Stock Market ETF could also be a better buy if you already own some top S&P 500 stocks and want to limit the duplication of your existing holdings.

Should you buy stock in Vanguard S&P 500 ETF right now?

Before you buy stock in Vanguard S&P 500 ETF, consider this:

The Motley Fool Stock Advisor analyst team just identified what they believe are the 10 best stocks for investors to buy now… and Vanguard S&P 500 ETF wasn’t one of them. The 10 stocks that made the cut could produce monster returns in the coming years.

Consider when Netflix made this list on December 17, 2004... if you invested $1,000 at the time of our recommendation, you’d have $421,511!* Or when Nvidia made this list on April 15, 2005... if you invested $1,000 at the time of our recommendation, you’d have $1,381,960!*

Now, it’s worth noting Stock Advisor’s total average return is 981% β€” a market-crushing outperformance compared to 216% for the S&P 500. Don't miss the latest top 10 list, available with Stock Advisor, and join an investing community built by individual investors for individual investors.

See the 10 stocks Β»

*Stock Advisor returns as of August 16, 2026.

Daniel Foelber has positions in Broadcom and Nvidia and has the following options: short August 2026 $240 calls on Nvidia. The Motley Fool has positions in and recommends Alphabet, Amazon, Apple, Broadcom, Eli Lilly, Meta Platforms, Micron Technology, Microsoft, Nvidia, Tesla, Vanguard Morningstar Mid-Cap ETF, and Vanguard S&P 500 ETF. The Motley Fool has a disclosure policy.
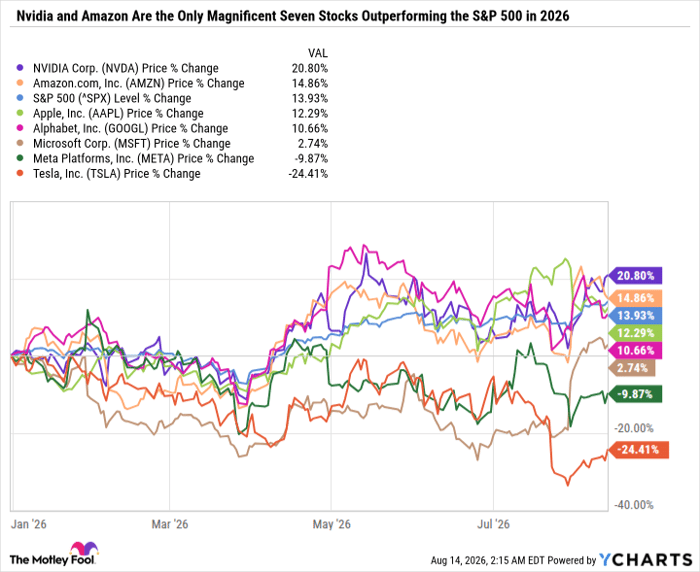
☐ β˜† βœ‡ The Motley Fool

All It Takes Is $17,000 Invested in This High-Yield Dividend King Stock to Generate Over $500 in Yearly Dividends

By: newsfeedback@fool.com (Daniel Foelber) β€”

Key Points

  • Procter & Gamble’s stock is under pressure as management guides for yet another year of low-single-digit growth.

  • The company has a diverse lineup of category-leading, everyday-use brands.

  • The valuation is attractive, and the dividend is supported by free cash flow.

With major indexes like the S&P 500 (SNPINDEX: ^GSPC) and Nasdaq Composite (NASDAQINDEX: ^IXIC) hovering around all-time highs, collecting a 3% dividend yield may not seem like much. But generating passive income from reliable dividend-paying stocks provides an excellent way to participate in the market and book a return without needing to sell stock.

A red-hot stock market can overshadow the value of dividends. But when stock prices are falling, or the market enters a multiyear slowdown, dividends can provide crucial dry powder that can be reinvested or used to supplement income.

Missed Nvidia in 2009? This Rare Signal Is Flashing Again. In 2009, a "Double Down" signal flashed for a little-known chipmaker called Nvidia. For the first time in years, that same "Total Conviction" signal is flashing for a company 1/100th the size of Nvidia. Continue Β»

In April, Procter & Gamble (NYSE: PG) raised its quarterly dividend to $1.0885 or $4.354 per year, marking the company's 70th consecutive annual increase. That makes P&G one of the longest-tenured Dividend Kings -- which are companies with at least 50 consecutive years of boosting their payouts.

With a 3% yield, you can expect a $17,000 investment in P&G to produce about $510 in annual dividend income. Here's why P&G stands out as one of the best blue chip dividend stocks to buy now.

Procter & Gamble products in a circle around the P&G logo.

Image source: Getty Images.

A consumer products powerhouse

P&G is the largest consumer packaged-goods company in the world -- with a portfolio of category-leading brands across beauty, grooming, healthcare, fabric and home care, and baby, feminine, and family care.

P&G's size gives it pricing power with consumers and crucial retail partners, which have incentive to carry its products on their shelves or online to attract customers. P&G products such as Pampers diapers, Charmin toilet paper, Bounty paper towels, Dawn dish soap, Tide detergent, Crest toothpaste, Gillette razor blades, and Olay skin care are known as destination products. These are the kinds of everyday-use products that can instigate a trip to a store like Walmart, Costco Wholesale, or Target. So these retailers want to carry P&G's products and, ideally, offer specialized versions through exclusive stock-keeping units (SKUs) to influence buyer behavior.

But goods manufacturers like P&G are also competing amid a surge in value-focused buying behavior toward private-label brands such as Walmart's Great Value, Sam's Club's Member's Mark, and Costco's Kirkland. P&G's size has allowed it to be fairly resilient even in the face of inflationary and consumer spending pressures. But there's no denying P&G is in a multiyear slowdown.

P&G's results and guidance have been disappointing

On July 29, P&G reported full-year fiscal 2026 year-over-year net sales growth of just 3%, organic sales growth of 1%, diluted earnings per share (EPS) growth of 2%, and core EPS growth of 1%.

For fiscal 2027, P&G is guiding for just 1% to 3% organic sales growth, a 1% to 5% increase in diluted net EPS, and flat to 3% growth in core EPS, with a midpoint of $7 per share.

PG Revenue (TTM) Chart

PG Revenue (TTM) data by YCharts

P&G's margins have held up well, but its revenue growth has slowed dramatically. However, P&G continues to generate ample earnings and free cash flow to cover its dividend, although its dividend increases have been fairly small in recent years.

Despite the industrywide challenges, P&G continues to focus on what it can control. It is generating $2.8 billion in before-tax savings in fiscal 2026 across cost of goods, sales, general, and administrative expenses. On Aug. 4, P&G announced the $3.8 billion acquisition of personalized health and supplements solutions company Thorne, which will be added to its healthcare segment. The acquisition shows that P&G can continue to take market share and grow its brand portfolio even during a slowdown, which is more challenging for smaller, less diversified companies.

A high-quality stock at a discounted valuation

P&G's stock price has gone practically nowhere for five years, which has compressed its valuation to multiyear lows and pole-vaulted its dividend yield to multiyear highs.

P&G now trades at just 22.2 times earnings and a 20.9 forward price-to-earnings (P/E) ratio, compared with a 10-year median P/E of 25.3. And because P&G has already guided for weak results in fiscal 2027, even mediocre results will look relatively good given the context of the current operating environment.

Add it all up, and P&G stands out as an excellent high-yield value stock for income investors to scoop up now.

Should you buy stock in Procter & Gamble right now?

Before you buy stock in Procter & Gamble, consider this:

The Motley Fool Stock Advisor analyst team just identified what they believe are the 10 best stocks for investors to buy now… and Procter & Gamble wasn’t one of them. The 10 stocks that made the cut could produce monster returns in the coming years.

Consider when Netflix made this list on December 17, 2004... if you invested $1,000 at the time of our recommendation, you’d have $403,337!* Or when Nvidia made this list on April 15, 2005... if you invested $1,000 at the time of our recommendation, you’d have $1,334,946!*

Now, it’s worth noting Stock Advisor’s total average return is 958% β€” a market-crushing outperformance compared to 214% for the S&P 500. Don't miss the latest top 10 list, available with Stock Advisor, and join an investing community built by individual investors for individual investors.

See the 10 stocks Β»

*Stock Advisor returns as of August 13, 2026.

Daniel Foelber has positions in Procter & Gamble and has the following options: short November 2026 $150 calls on Procter & Gamble. The Motley Fool has positions in and recommends Costco Wholesale, Target, and Walmart. The Motley Fool has a disclosure policy.
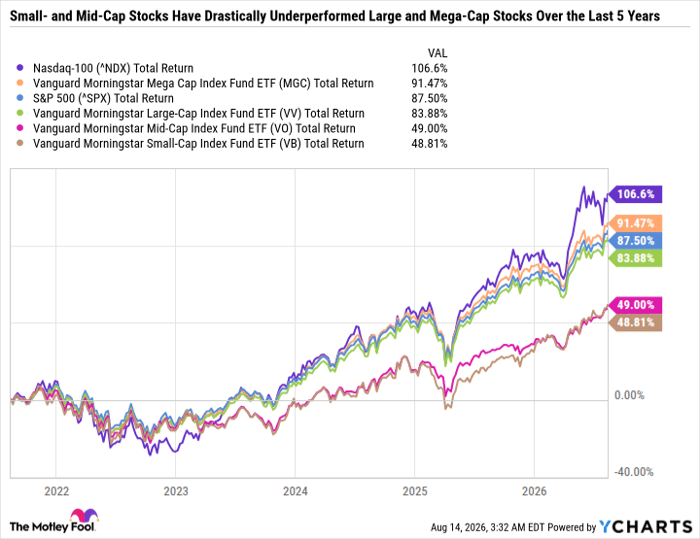
☐ β˜† βœ‡ The Motley Fool

Is Investing in Coca-Cola Stock Near an All-Time High a Better Buy Than PepsiCo Under $140 Per Share?

By: newsfeedback@fool.com (Daniel Foelber) β€”

Key Points

  • Coca-Cola stock is trading near an all-time high for all the right reasons.

  • PepsiCo’s yield is elevated because of its falling stock price, while Coca-Cola’s yield has compressed.

  • Wall Street is overlooking the strength of PepsiCo’s international segment.

Coca-Cola (NYSE: KO) stock is up nearly 24% year to date, hovering around an all-time high, and handily outperforming the Nasdaq Composite (up 13.7%) and S&P 500 (up 12.9%). By comparison, PepsiCo (NASDAQ: PEP) is $138 per share at the time of this writing -- down 3.8% year-to-date and about 8% away from a five-year low.

Investing in Coca-Cola has paid off far better than buying PepsiCo in recent years. But investors looking to put $1,000 into either dividend stock right now likely care more about where the company could be headed than where it has been.

Missed Nvidia in 2009? This Rare Signal Is Flashing Again. In 2009, a "Double Down" signal flashed for a little-known chipmaker called Nvidia. For the first time in years, that same "Total Conviction" signal is flashing for a company 1/100th the size of Nvidia. Continue Β»

Here's why Coke has been in favor, and why the Pepsi sell-off has gone too far.

A stack of blue poker chips next to a bar chart, illustrating the power of generating passive income from blue chip dividend stocks.

Image source: Getty Images.

Coke keeps delivering despite a challenging operating environment

Coca-Cola stock trades at its steepest premium to PepsiCo in years -- sporting a 26.3 forward price-to-earnings (P/E) ratio compared with just 16.1 for Pepsi. And Pepsi's dividend yield has ballooned to 4.3% compared with just 2.4% for Coke.

Investors are willing to pay a premium price for Coke because it has done a masterful job of navigating inflationary pressures and consumer spending challenges and has shown remarkable resilience despite a widespread consumer shift away from sugary beverages and artificial flavors and colors toward healthier options and natural ingredients, whereas Pepsi's results, especially in North America, have shown far less resilience.

Coke is delivering far better organic revenue growth than Pepsi -- a testament to its strong brand portfolio. And Coke's trailing-12-month (TTM) operating margins of 31.9% are far higher than Pepsi's 15.6% TTM operating margins thanks to its international network of bottling partners, which mix, bottle, package, and distribute Coca-Cola products. The bottling network gives Coca-Cola superior operating leverage, especially because Coke's focus is on non-alcoholic beverages, whereas Pepsi has more moving parts, with a massive snack business anchored by Frito-Lay and Quaker Oats.

PepsiCo's ace in the hole

Since PepsiCo has such a large snack business, it has been caught up in negative investor sentiment toward packaged food companies. By way of comparison, the stocks of Kraft Heinz, Hormel Foods, Campbell's, Conagra Brands, and even McCormick are all trading near 10-year lows.

MKC Chart

Data by YCharts.

But PepsiCo is a far larger company with several category-leading brands it can lean on during a slowdown. What's more, Pepsi has been diversifying into mini-meals and health-conscious options to cater to wellness trends. Management has been adamant about offering alternatives for consumers. And many of Pepsi's recent acquisitions support this strategic shift, including its 2025 acquisitions of Siete Foods (grain-free, simple ingredient-focused items) and the prebiotic soda brand Poppi.

Starting in fiscal 2025, Pepsi began reporting Quaker Foods North America and Frito-Lay North America under one PepsiCo Foods North America (PFNA) umbrella. It also used to report Europe separately from the Middle East and Africa. Pepsi now separately reports its international beverage franchise results, which include its international franchise and SodaStream businesses. For the sake of comparing results across different corporate structures, here are Pepsi's results separated into North American foods, North American beverages, and international (including food, beverage, and franchise beverage businesses).

Segment Revenue for the 24 Weeks Ended ...

June 12, 2021

June 11, 2022

June 17, 2023

June 15, 2024

June 14, 2025

June 13, 2026

5-Year Change

PepsiCo Foods North America (PFNA)

$10 billion

$11.4 billion

$12.9 billion

$12.7 billion

$12.7 billion

$12.7 billion

26.9%

PepsiCo Beverages North America (PBNA)

$11.2 billion

$11.5 billion

$12.6 billion

$12.7 billion

$12.7 billion

$13.6 billion

21.4%

International (Food and Beverage)

$12.8 billion

$13.5 billion

$14.7 billion

$15.4 billion

$15.3 billion

$17.3 billion

35.1%

Total

$34 billion

$36.4 billion

$40.2 billion

$40.8 billion

$40.6 billion

$43.6 billion

28.2%

Data source: PepsiCo.

Pepsi's North American food and beverage business has been in a significant slowdown over the past three years, whereas international operations continue to drive the company's overall results. International now makes up 40% of Pepsi's total sales. Comparing the 24 weeks ended June 13, 2026, to the 24 weeks ended June 14, 2025, Pepsi's Europe, Middle East, and Africa convenient foods and beverage businesses, as well as Latin America Foods and Asia Pacific Foods, are experiencing double-digit revenue growth.

Pepsi is a top buy for income investors

Coca-Cola has outperformed PepsiCo in recent years, but Pepsi is the superior buy now. Pepsi has a much lower P/E ratio and a higher dividend yield. And it continues to generate strong free cash flow to support its growing payout -- which it has increased for 54 consecutive years, compared with 64 consecutive years for Coca-Cola. Both Coke and Pepsi are Dividend Kings -- increasing their dividends annually for at least 50 consecutive years -- and their dividend streaks show no signs of ending anytime soon.

Perhaps most importantly, investors may be overlooking just how solid Pepsi's international food and beverage business has been performing -- a testament to the strength of its international brand portfolio and distribution network. It's also worth noting that, unlike other packaged food companies, which are seeing meaningful declines in sales and earnings, PFNA is still near a record high in revenue, and PBNA is at a record high. Or, put another way, the pace of Pepsi's North America food and beverage business is slowing, but it isn't even close to the declining sales some of its packaged food peers are seeing.

Investors who believe Pepsi can adjust to shifting consumer preferences by offering healthier options within its existing brands and continue making savvy acquisitions are getting the chance to buy the stock at a dirt-cheap price. Coke is still a good blue chip dividend stock to hold; it's just not as screaming of a buy given it is already priced as the category leader -- meaning it must continue doing a lot right just to back up its existing valuation.

Should you buy stock in PepsiCo right now?

Before you buy stock in PepsiCo, consider this:

The Motley Fool Stock Advisor analyst team just identified what they believe are the 10 best stocks for investors to buy now… and PepsiCo wasn’t one of them. The 10 stocks that made the cut could produce monster returns in the coming years.

Consider when Netflix made this list on December 17, 2004... if you invested $1,000 at the time of our recommendation, you’d have $403,337!* Or when Nvidia made this list on April 15, 2005... if you invested $1,000 at the time of our recommendation, you’d have $1,334,946!*

Now, it’s worth noting Stock Advisor’s total average return is 958% β€” a market-crushing outperformance compared to 214% for the S&P 500. Don't miss the latest top 10 list, available with Stock Advisor, and join an investing community built by individual investors for individual investors.

See the 10 stocks Β»

*Stock Advisor returns as of August 12, 2026.

Daniel Foelber has no position in any of the stocks mentioned. The Motley Fool recommends Campbell's, Kraft Heinz, and McCormick. The Motley Fool has a disclosure policy.
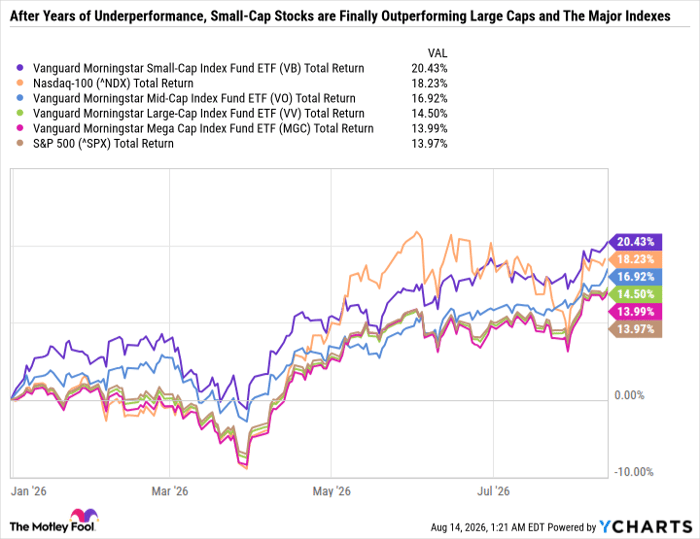
☐ β˜† βœ‡ The Motley Fool

If I Could Invest $1,000 in Just 1 ETF in August, I'd Pick This Clear Standout Over the Vanguard S&P 500 ETF (VOO)

By: newsfeedback@fool.com (Daniel Foelber) β€”

Key Points

Earlier this year, the Vanguard S&P 500 ETF became the first exchange-traded fund (ETF) to surpass $1 trillion in assets. The ETF has grown in size thanks to its simplicity. It tracks the S&P 500 index and charges a mere 0.03% expense ratio, or $0.30 per $1,000 invested. Many brokerages allow users to invest in fractional shares of the ETF.

With low fees and the ability to invest a customized dollar amount in the ETF rather than full-share increments, the Vanguard S&P 500 ETF has become a popular choice for getting diversified exposure to the U.S. stock market.

Missed Nvidia in 2009? This Rare Signal Is Flashing Again. In 2009, a "Double Down" signal flashed for a little-known chipmaker called Nvidia. For the first time in years, that same "Total Conviction" signal is flashing for a company 1/100th the size of Nvidia. Continue Β»

However, if given $1,000 to invest in any ETF in August, I'd choose the Vanguard Communication Services ETF (NYSEMKT: VOX) with its slightly higher 0.09% expense ratio, instead of the Vanguard S&P 500 ETF. Here's why.

Interconnected beams and dots of red light cover a view of North America from space.

Image source: Getty Images.

Customizing ETF holdings with investment objectives

The Vanguard S&P 500 ETF hit a new all-time closing high on Aug. 7, finishing the session at $710.71 per share. A staggering 38% of the ETF is invested in tech stocks. And despite owning over 500 components, just 25 of them account for over half of the ETF.

The S&P 500 is now a growth-stock-focused index, and it's not as well diversified in dividend and value stocks as it used to be. So some investors may prefer to simply buy their favorite growth stocks and support those holdings with value- and income-focused ETFs. Or conversely, buy the Vanguard Morningstar Growth ETF or Vanguard Morningstar Mega Cap Growth ETF and support those holdings with individual, dividend-paying value stocks.

A sector with high growth potential at an inexpensive valuation

What makes the Vanguard Communication Services ETF unique is its heavy concentration in a handful of growth stocks. Alphabet and Meta Platforms make up 42.5% of the ETF. Throw in Walt Disney and Netflix, and that's over half the ETF in just four stocks.

Even with high-profile growth stocks like Alphabet and Meta Platforms, the ETF is chock-full of dividend-paying value stocks. Legacy media companies, such as Comcast, and telecommunications companies like Verizon Communications and AT&T tend to sport inexpensive valuations and high yields.

The Vanguard Communication Services ETF bets big on a few key growth stocks, but its supporting cast is mostly stodgy value stocks, whereas the Vanguard S&P 500 ETF is heavily concentrated in many megacap and large-cap growth stocks. That's why the Vanguard Communication Services ETF has a dirt cheap 17.1 price-to-earnings (P/E) ratio as of June 30 compared to a 27.5 P/E for the Vanguard S&P 500 ETF. Communications is the second-cheapest sector by P/E ratio, just ahead of financials, which may come as a surprise, given that so much of the sector's weighing is in hyperscalers Alphabet and Meta Platforms.

Vanguard Sector ETF

P/E Ratio (as of 6/30/26)

Vanguard Information Technology ETF

36.2

Vanguard Industrials ETF

31.6

Vanguard Real Estate ETF

31

Vanguard Health Care ETF

29.1

Vanguard Consumer Discretionary ETF

28.3

Vanguard Consumer Staples ETF

25.4

Vanguard Materials ETF

23.8

Vanguard Utilities ETF

20.9

Vanguard Energy ETF

19.8

Vanguard Communication Services ETF

17.1

Vanguard Financials ETF

16.3

Data source: Vanguard.

The top growth stocks in the Vanguard Communication Services ETF are surprisingly cheap. Alphabet is up 75.9% in the last year, but the rally in its stock price has been driven by earnings growth. So even after its recent run-up, it still fetches a 17.2 forward P/E.

WBD PE Ratio (Forward) Chart

WBD PE Ratio (Forward) data by YCharts

Meta Platforms, Netflix, and Disney are all down big from their all-time highs, even though their earnings are strong. Eight of the 10 largest holdings in the Vanguard Communication Services ETF have forward P/E ratios under 21. For context, the forward P/E ratio of the S&P 500 is 20.6.

A balanced ETF to buy in August

The Vanguard Communication Services ETF is a great buy for investors seeking quality growth stocks at attractive valuations, supported by value and high-dividend-yield stocks. The Vanguard S&P 500 ETF, on the other hand, is far more sensitive to continued investor excitement for artificial intelligence (AI) stocks, especially red-hot semiconductor companies. AI spending could pay off big-time in the long run, but the more the S&P 500's valuation expands, the more pressure falls on companies to deliver on loftier expectations.

Despite its value tilt, it's worth noting that the Vanguard Communication Services ETF isn't devoid of high-flying growth stocks. Video game companies like Take Two Interactive and Roblox tend to sport premium valuations. And Space Exploration Technologies (NASDAQ: SPCX) is already the 12th-largest holding in the ETF as of June 30 -- making it the highest percentage weighting among the nine Vanguard ETFs that bought SpaceX in June. The ETF's weighting in SpaceX will increase as more SpaceX shares are unlocked. And since Vanguard classifies SpaceX as a communications stock, the Vanguard Communications Services ETF is the only Vanguard sector ETF that is buying it.

Before the end of the year, SpaceX could become a top-five holding in the Vanguard Communication Services ETF, which would make the ETF's valuation more expensive, but it would still likely trade at a steep discount to most other sector ETFs.

Investors who don't mind complementing the earnings-driven growth narrative of the ETF's top holdings with a high-flying, volatile stock like SpaceX may still find the Vanguard Communications Services ETF an appealing buy in August.

Should you buy stock in Vanguard World Fund - Vanguard Communication Services ETF right now?

Before you buy stock in Vanguard World Fund - Vanguard Communication Services ETF, consider this:

The Motley Fool Stock Advisor analyst team just identified what they believe are the 10 best stocks for investors to buy now… and Vanguard World Fund - Vanguard Communication Services ETF wasn’t one of them. The 10 stocks that made the cut could produce monster returns in the coming years.

Consider when Netflix made this list on December 17, 2004... if you invested $1,000 at the time of our recommendation, you’d have $403,337!* Or when Nvidia made this list on April 15, 2005... if you invested $1,000 at the time of our recommendation, you’d have $1,334,946!*

Now, it’s worth noting Stock Advisor’s total average return is 958% β€” a market-crushing outperformance compared to 214% for the S&P 500. Don't miss the latest top 10 list, available with Stock Advisor, and join an investing community built by individual investors for individual investors.

See the 10 stocks Β»

*Stock Advisor returns as of August 12, 2026.

Daniel Foelber has positions in Netflix and Walt Disney and has the following options: short August 2026 $100 calls on Walt Disney and short August 2026 $110 calls on Walt Disney. The Motley Fool has positions in and recommends Alphabet, Meta Platforms, Netflix, Roblox, Take-Two Interactive Software, Vanguard Morningstar Growth ETF, Vanguard Real Estate ETF, Vanguard S&P 500 ETF, Walt Disney, and Warner Bros. Discovery. The Motley Fool recommends Comcast, T-Mobile US, and Verizon Communications. The Motley Fool has a disclosure policy.

☐ β˜† βœ‡ The Motley Fool

Meet the Low-Cost Vanguard ETF That Just Gained 11% Over 4 Days, Thanks to a Combined 33% Weighting in Nvidia, Microsoft, Micron, and Broadcom. Here's Why It's Still a Top Buy Now.

By: newsfeedback@fool.com (Daniel Foelber) β€”

Key Points

Investors just experienced one of the most volatile weeks in the stock market this year.

On July 29, the Nasdaq Composite closed in a correction -- down 10.1% from its all-time high as investors digested Alphabet's increased capital expenditure (capex) spending on artificial intelligence (AI) and braced for upcoming earnings reports from Microsoft, Meta Platforms, Amazon, and Apple.

Missed Nvidia in 2009? This Rare Signal Is Flashing Again. In 2009, a "Double Down" signal flashed for a little-known chipmaker called Nvidia. For the first time in years, that same "Total Conviction" signal is flashing for a company 1/100th the size of Nvidia. Continue Β»

Just four trading sessions later, as of the market close on Aug. 4, the Nasdaq Composite recovered a staggering 8.8%, and the S&P 500 closed at an all-time high -- fueled by encouraging earnings reports from Amazon and Microsoft.

Over that period, the Vanguard Information Technology ETF (NYSEMKT: VGT), which mirrors the tech sector, gained 11%. Here's why tech stocks are surging, and why the Vanguard Tech ETF remains an excellent buy for growth investors.

An abstract stock market bull climbing a candlestick chart.

Image source: Getty Images.

Dynamic dominance

If you had invested in the technology sector 10 years ago, you would have quintupled your money. In fact, the gains in the tech sector have impacted the S&P 500 to such a wide margin that tech is the only sector to have outperformed the index over the past decade.

^IXT Chart

^IXT data by YCharts

But those gains are in the past. Folks looking for opportunities to invest their hard-earned savings care more about future potential. And what makes the tech sector unique is that it doesn't depend on a single catalyst.

In just the past decade, several themes have driven the sector to new heights. Notable paradigm shifts include the push toward e-commerce, with transactions, communications, and work increasingly done online and on mobile devices. The tech sector has been front and center in the software-as-a-service, cloud computing, and artificial intelligence (AI) boom.

Those themes have benefited different industries within the tech sector at different times. There have been multi-year periods when semiconductor stocks were in a cyclical downturn, and periods when semiconductors have contributed the vast majority of sectorwide gains -- which is the period we're in now. Similarly, software was the hottest industry for years, and lately, it has been dragging down the sector.

Among the most valuable tech stocks by market value, Apple was crushing Nvidia and Microsoft year to date but is down since reporting earnings, while Microsoft and Nvidia are up big in just four sessions.

MSFT Chart

MSFT data by YCharts

Investing in a tech-sector ETF provides exposure to companies driving sectorwide gains, which have historically far outpaced the declines of laggards. While not a perfect solution, it does ensure that investors don't become overly concentrated in just one or two themes within the tech sector and leaves room for breakout potential from hidden-gem stocks.

Microsoft is back in favor

Microsoft is perhaps the best example of how sentiment can turn on a dime and why investors are better off building their portfolios around quality companies than getting caught up in whatever companies are in or out of favor.

Leading up to its July 29 earnings report, Microsoft was under pressure amid a broader sell-off in software stocks, driven by AI disruption fears and rising cloud infrastructure capex. But Microsoft proved the doubters wrong with impressive growth and upbeat fiscal 2027 guidance, including positive free cash flow in the upcoming fiscal year despite rising spending.

Microsoft gained 26.1% in just four sessions -- or a mind-numbing $757 billion in market value. That's like creating a company with a value equivalent to Advanced Micro Devices in less than a week, and AMD is one of the 20 most valuable S&P 500 companies.

Some stocks are worth premium valuations

One-third of the Vanguard Tech ETF is invested in just four stocks -- Nvidia, Microsoft, Micron, and Broadcom. Big gains in those megacap names have helped drive the ETF higher in recent sessions,even after accounting for a significant decline in Apple.

Some investors may be concerned that the tech sector is overbought and ripe for a pullback. Or that growth potential is already priced in, given investor enthusiasm. Those concerns are certainty warranted, given the Vanguard Tech ETF's 36.2 price-to-earnings (P/E) ratio as of June 30. But looking at a single valuation metric such as P/E ratios or simply the price action on a chart misses the most important reason the Vanguard Tech ETF remains an excellent buy now -- which is earnings growth.

Earnings growth is the most powerful force in investing. It can make even the most expensive stocks look cheap in the long run. A company with a 40 P/E that can grow earnings by 20% to 30% per year over the long term is a better value than a company with a 20 P/E with a single-digit earnings growth rate.

Microsoft and Apple are growing earnings at their fastest rates in years. Despite difficult comps, Nvidia and Broadcom continue to grow at impressive rates, justifying their valuations. Supply constraints on memory chips have contributed to massive earnings growth in Micron Technology (NASDAQ: MU) and other memory stocks.

These are just some of the many examples of tech stocks that have rewarded patient investors with big gains but could still be good buys now.

A sector built around quality companies

With a reasonable 0.09% expense ratio, or $0.90 for every $1,000 invested, the Vanguard Information Technology ETF offers investors a low-cost way to get exposure to a basket of hundreds of tech stocks. However, it's worth noting that the sector's performance is heavily dependent on a handful of names, as Nvidia, Apple, Microsoft, Micron, Broadcom, and AMD account for over half of the ETF.

Concentration is a double-edged sword, as it can amplify gains when a big-name component such as Microsoft stages a rapid rebound, but it can also lead to rapid downturns if a key industry such as semiconductors sells off. Therefore, investors should consider the Vanguard Tech ETF only if they have a high risk tolerance and a long-term investment horizon to withstand prolonged volatility.

Should you buy stock in Vanguard Information Technology ETF right now?

Before you buy stock in Vanguard Information Technology ETF, consider this:

The Motley Fool Stock Advisor analyst team just identified what they believe are the 10 best stocks for investors to buy now… and Vanguard Information Technology ETF wasn’t one of them. The 10 stocks that made the cut could produce monster returns in the coming years.

Consider when Netflix made this list on December 17, 2004... if you invested $1,000 at the time of our recommendation, you’d have $397,405!* Or when Nvidia made this list on April 15, 2005... if you invested $1,000 at the time of our recommendation, you’d have $1,344,091!*

Now, it’s worth noting Stock Advisor’s total average return is 953% β€” a market-crushing outperformance compared to 214% for the S&P 500. Don't miss the latest top 10 list, available with Stock Advisor, and join an investing community built by individual investors for individual investors.

See the 10 stocks Β»

*Stock Advisor returns as of August 7, 2026.

Daniel Foelber has positions in Broadcom and Nvidia and has the following options: short August 2026 $240 calls on Nvidia. The Motley Fool has positions in and recommends Advanced Micro Devices, Alphabet, Amazon, Apple, Broadcom, Meta Platforms, Micron Technology, Microsoft, and Nvidia. The Motley Fool has a disclosure policy.

☐ β˜† βœ‡ The Motley Fool

Meet the 5.1%-Yielding Stock That Just Increased Its Dividend for the 49th Consecutive Year. Here's Why It's a Buy in August.

By: newsfeedback@fool.com (Daniel Foelber) β€”

Key Points

  • Clorox’s turnaround efforts are finally showing tangible progress.

  • The Purell acquisition contributes to Clorox’s most important segment.

  • The company is generating plenty of free cash flow to cover its dividend.

Clorox (NYSE: CLX) investors have had little to smile about lately. If you'd invested $1,000 in Clorox five years ago, you'd have just $621 today. And that's even when factoring in dividends.

But long-term investors care more about where a stock is going than where it has been. Here's why the worst of Clorox's struggles could be in the rearview mirror and why it stands out as a top high-yield dividend stock to buy in August.

Where to invest $1,000 right now? Our analyst team just revealed what they believe are the 10 best stocks to buy right now, when you join Stock Advisor. See the stocks Β»

A person touching a sapling that sprouts from a jar of coins, illustrating the power of compounding passive income from dividend stocks.

Image source: Getty Images.

Clorox adds a powerhouse brand

On April 1, Clorox completed its acquisition of Gojo Industries, adding the Purell brand to its health and hygiene portfolio. The segment now accounts for more than half of Clorox's total net sales and remains the key driver of its overall sales growth.

Clorox expects the Purell acquisition to make a big impact on its fiscal 2027 results. Clorox is guiding for a 13% to 14% increase in net sales for the upcoming fiscal year. But only 3.5% to 4.5% of that increase is expected to come from organic sales growth (the GOJO acquisition accounts for 9.5% of the forecast).

All told, adjusted earnings per share are expected to be $5.70 to $6.00 -- a 3% to 8% increase from fiscal 2026.

Challenges remain for Clorox

Fiscal 2027 will mark the first full year in which Clorox will report after its enterprise resource planning (ERP) overhaul (completed in February). The $580 million ERP implementation took longer than expected and cost more than anticipated. But it should make the overall business more efficient as Clorox integrated its financial, supply chain, and sales functions under a new cloud-based system.

For years, Clorox has been struggling to gain its footing as it has implemented its ERP transition amid post-pandemic supply chain issues, inflationary pressures, and a costly cyberattack in August 2023. In its fiscal 2026 fourth-quarter prepared remarks, Clorox said it is now shifting from stabilization to optimization to realize the full benefits of its ERP implementation. However, management commentary included a bleak outlook on the state of consumer spending:

We expect our overall operating environment to remain challenging and uncertain, reducing planning visibility and widening the range of potential outcomes. We expect consumers to remain highly value-conscious in their purchasing decisions, putting pressure on overall category growth. We expect our category growth in fiscal year 2027 to remain below historical levels from a combination of subdued volume growth, negative mix from consumers choosing value offerings, and elevated competitive activity.

Clorox has done what it can to improve its margins and efficiency, but it remains in a highly challenging operating environment.

Clorox can afford its attractive dividend

On July 31, Clorox increased its quarterly dividend by a modest one cent per share from $1.24 to $1.25. However, given Clorox's challenges, it's prudent that Clorox keep the payout affordable while extending its consecutive dividend increase streak to 49 years.

In its Aug. 3 prepared remarks, Clorox said it expects strong cash flow generation in fiscal 2027, guiding to 11%-13% FCF as a percentage of net sales. Based on Clorox's net sales growth of 13% to 14% from $6.72 billion in fiscal 2026, the midpoint of Clorox's guidance suggests $7.63 billion in fiscal 2027 net sales and $915 million in FCF.

In fiscal 2025, Clorox paid $600 million in dividends on $4.80 per share, so a rough estimate for fiscal 2027 dividends of around $5 per share would be $625 million in dividend payments. Even with a high 5.1% yield Clorox should be able to generate ample cash to cover its dividend expense.

A top high-yield value stock for long-term investors

Clorox is an excellent value stock for investors to buy in August, especially those looking to supplement income in retirement. Clorox offers an incredibly attractive dividend and is on its way to becoming a Dividend King in 2027. As of July 2, 57 stocks qualified as Dividend Kings, putting Clorox in the running to join an elite group of companies that have paid and raised their dividends for at least 50 consecutive years.

Based on its Aug. 3 closing price of $98.26 per share, Clorox is trading at just 16.8 times the midpoint of its fiscal 2027 earnings per share guidance of $5.85. That's a dirt cheap valuation for a company with industry-leading brands across multiple product categories.

Clorox may lack the glitz and glam of a high-octane growth stock. But it's precisely the kind of deep value stock that long-term income investors look for.

Should you buy stock in Clorox right now?

Before you buy stock in Clorox, consider this:

The Motley Fool Stock Advisor analyst team just identified what they believe are the 10 best stocks for investors to buy now… and Clorox wasn’t one of them. The 10 stocks that made the cut could produce monster returns in the coming years.

Consider when Netflix made this list on December 17, 2004... if you invested $1,000 at the time of our recommendation, you’d have $396,758!* Or when Nvidia made this list on April 15, 2005... if you invested $1,000 at the time of our recommendation, you’d have $1,300,820!*

Now, it’s worth noting Stock Advisor’s total average return is 939% β€” a market-crushing outperformance compared to 211% for the S&P 500. Don't miss the latest top 10 list, available with Stock Advisor, and join an investing community built by individual investors for individual investors.

See the 10 stocks Β»

*Stock Advisor returns as of August 5, 2026.

Daniel Foelber has no position in any of the stocks mentioned. The Motley Fool has no position in any of the stocks mentioned. The Motley Fool has a disclosure policy.

☐ β˜† βœ‡ The Motley Fool

Alphabet, Microsoft, Amazon, and Oracle Just Gained $1.9 Trillion in 3 Days. Here's Why Microsoft's Run Isn't Over.

By: newsfeedback@fool.com (Daniel Foelber) β€”

Key Points

  • Recent earnings reports alleviated investors’ concerns about cloud demand and AI spending.

  • Microsoft has the best free cash flow and operating margins of the cloud majors.

  • Even after its latest run-up, Microsoft is still an impeccable value.

Alphabet (NASDAQ: GOOG) (NASDAQ: GOOGL) reported earnings on July 22. The next day, the stock closed down 7.1% in response to higher capital expenditure (capex) guidance and fears of margin compression and lower free cash flow (FCF). As of the July 23 market close, cloud computing giants Alphabet, Microsoft (NASDAQ: MSFT), Amazon (NASDAQ: AMZN), and Oracle (NYSE: ORCL) were all badly underperforming the major indexes year to date, with Alphabet and Amazon up a little over 1%, Microsoft down 21.1%, and Oracle down 38.4%.

A lot has changed since. As of market close on Aug. 3, Amazon is now up 23% year to date, Alphabet is up 19.3%, Microsoft has recovered all of its losses and is up 0.8%, and Oracle is clawing back with a 27.2% year-to-date decline.

Missed Nvidia in 2009? This Rare Signal Is Flashing Again. In 2009, a "Double Down" signal flashed for a little-known chipmaker called Nvidia. For the first time in years, that same "Total Conviction" signal is flashing for a company 1/100th the size of Nvidia. Continue Β»

Here's why investor sentiment has shifted, and why Microsoft is the best cloud stock to buy in August.

Clouds raining down binary 0s and 1s.

Image source: Getty Images.

Justifying record capex

In just three market sessions, from July 29 close to Aug. 3 close, these four cloud computing giants gained a combined mind-numbing $1.857 trillion in market cap -- which is like creating a company as valuable as Broadcom out of thin air.

Microsoft added a staggering $720 billion -- even more than Amazon.

Company

July 29 Market Cap

Aug. 3 Market Cap

Gain Over 3 Sessions

Alphabet

$4.118 trillion

$4.568 trillion

10.9%

Microsoft

$2.901 trillion

$3.621 trillion

24.8%

Amazon

$2.444 trillion

$3.062 trillion

25.3%

Oracle

$339.1 billion

$408.41 billion

20.4%

Data source: YCharts.

The glass-half-empty outlook on Microsoft, and to a similar extent Oracle, is that artificial intelligence (AI) is disrupting legacy software tools and that their cloud computing spending will take a while to pay off, thereby taking a sledgehammer to FCF in the near term. Oracle is an extreme example of betting big on cloud. Spending on its database build-out far exceeds cash flows from the database and data management software segments. So, in addition to being FCF negative, Oracle has taken on considerable debt.

In comparison, Alphabet, Microsoft, and Amazon were initially able to absorb higher spending in the earlier stages of the AI data center build-out. But they have continued to increase their capex spending and guidance quarter after quarter. So investors got spooked when Alphabet raised its full-year capex guidance to a new range of $195 billion to $205 billion, rivaling Amazon's. This is especially unusual considering that Alphabet's quarterly FCF turned negative for the first time in over a decade.

Amazon and Microsoft's earnings reports the following week eased investor concerns and sparked a broader rally across the cloud computing titans. Amazon reported $8.82 billion in negative quarterly FCF -- even more cash burn than Alphabet. It also provided details on the sheer profitability of the cloud business model and how initial upfront costs are well worth it, given the long useful life of data centers and the cost savings from Amazon's custom AI chips and networking. Amazon Web Services (AWS) achieved its fastest growth in 18 quarters, proving that demand isn't slowing down. Long-term contracts provide a clear roadmap for generating a return on AI infrastructure spending.

Amazon's results and management commentary on the earnings call helped restore investor confidence in AI-driven cloud demand, and sent a clear message that temporary negative FCF is simply the price of unlocking long-term gains from this paradigm-shifting opportunity in cloud computing.

Microsoft is a well-rounded cash cow

Even after its massive gain, Microsoft remains the best buy of the four cloud computing giants. Like Amazon, Microsoft reported excellent growth, including an 18% year-over-year increase in overall revenue and 27% increase in Microsoft Cloud revenue. Despite rising expenses, Microsoft still achieved ultra-high gross margins of 67% and a 45% operating margin. It also generated $19.6 billion in FCF, which was down 23% year over year due to higher capex. That was still plenty to cover $6.8 billion in dividends and $3.4 billion in stock buybacks.

As it did last quarter, Microsoft also noted that roughly two-thirds of capex is going to short-lived assets -- primarily central processing units and graphics processing units -- to support Azure demand and replace outdated equipment.

Microsoft isn't burning through cash as quickly as its cloud computing peers, and its margins are higher thanks to strong cloud growth and consistent results from its productivity and business processes segment.

MSFT Free Cash Flow (Quarterly) Chart

Data by YCharts.

Microsoft also provided upbeat guidance for fiscal year 2027, which began July 1, 2026. It expects double-digit revenue and operating income growth that will outpace mid- to high-single-digit growth in operating expenses. It also expects to remain FCF-positive despite higher capex and to see operating margins fall by less than one percentage point.

Microsoft has plenty of room to run

Microsoft is growing at a breakneck rate. That growth is sustainable because it has protected its margins and FCF, and the stock isn't overpriced. Microsoft trades at 24.9 times forward earnings estimates, compared to 21.2 for the S&P 500 (SNPINDEX: ^GSPC). That's a reasonable premium, considering the quality of Microsoft's business and that the stock just gained 24.8% in three trading sessions.

There are good arguments for why Alphabet, Amazon, Microsoft, and Oracle are strong buys now. However, Microsoft is uniquely positioned to invest aggressively in AI without derailing its balance sheet or fundamentals -- making it arguably the most balanced buy for investors looking to load up on a top tech stock in August.

Should you buy stock in Microsoft right now?

Before you buy stock in Microsoft, consider this:

The Motley Fool Stock Advisor analyst team just identified what they believe are the 10 best stocks for investors to buy now… and Microsoft wasn’t one of them. The 10 stocks that made the cut could produce monster returns in the coming years.

Consider when Netflix made this list on December 17, 2004... if you invested $1,000 at the time of our recommendation, you’d have $396,758!* Or when Nvidia made this list on April 15, 2005... if you invested $1,000 at the time of our recommendation, you’d have $1,300,820!*

Now, it’s worth noting Stock Advisor’s total average return is 939% β€” a market-crushing outperformance compared to 211% for the S&P 500. Don't miss the latest top 10 list, available with Stock Advisor, and join an investing community built by individual investors for individual investors.

See the 10 stocks Β»

*Stock Advisor returns as of August 5, 2026.

Daniel Foelber has positions in Broadcom and Oracle and has the following options: long September 2028 $100 calls on Oracle. The Motley Fool has positions in and recommends Alphabet, Amazon, Broadcom, Microsoft, and Oracle. The Motley Fool has a disclosure policy.

☐ β˜† βœ‡ The Motley Fool

Amazon and Microsoft Gained a Combined $1.04 Trillion in Market Cap in 2 Days, While Apple and Meta Platforms Lost $510 Billion. Meet the Vanguard ETF That's Built for This Exact Market.

By: newsfeedback@fool.com (Daniel Foelber) β€”

Key Points

  • Today's most valuable companies are moving markets this earnings season.

  • Amazon and Microsoft are generating renewed excitement, while Apple and Meta Platforms suffered sizeable post-earnings sell-offs.

  • The Vanguard Mega Cap Growth ETF smooths out volatility by providing cross-sector exposure to leading growth stocks.

This earnings season has been chock-full of volatility. Amazon (NASDAQ: AMZN) and Microsoft (NASDAQ: MSFT) added a combined $1.04 trillion in market cap between July 29 and July 31, while Apple (NASDAQ: AAPL) and Meta Platforms (NASDAQ: META) shed a combined $510 billion.

Here's why megacap stock prices are all over the place, as well as a straightforward way for investors to filter through the noise with a low-cost exchange-traded fund (ETF).

Missed Nvidia in 2009? This Rare Signal Is Flashing Again. In 2009, a "Double Down" signal flashed for a little-known chipmaker called Nvidia. For the first time in years, that same "Total Conviction" signal is flashing for a company 1/100th the size of Nvidia. Continue Β»

A silicon chip featuring β€œETF” surrounded by circuits, showcasing the benefits of getting exposure to artificial intelligence (AI) chip stocks through an ETF wrapper.

Image source: Getty Images.

Wall Street turns from sour to sweet on Microsoft and Amazon

Going into earnings, Microsoft and Amazon were badly underperforming the S&P 500 (SNPINDEX: ^GSPC) and Nasdaq Composite (NASDAQINDEX: ^IXIC) this year as investors questioned the payoff from capital expenditure (capex) on artificial intelligence (AI). Investors were gravitating toward Apple because of its high free cash flow (FCF) and limited capex spending. AI tools, from enterprise software to chatbots, ultimately operate on consumer electronics, and Apple has an unmatched integrated ecosystem of devices.

But Apple fell after reporting earnings because memory chip costs could continue eating into its profit margins. And Meta Platforms' FCF is evaporating due to surging AI capex and operating expenses.

Meanwhile, Amazon stock popped because Amazon Web Services (AWS) achieved its fastest growth in 18 quarters, and its retail business is booming. Similarly, Microsoft, which is the No. 2 player in cloud infrastructure behind AWS, saw Azure revenue top $100 billion for the first time in a full fiscal year.

Cut through market noise with a low-cost ETF

Earnings drive stock prices over the long term. But in the near term, narratives and investor sentiment have significant influence. So, if you're left scratching your head as to why Amazon and Microsoft were so badly undervalued that they could gain more than $1 trillion combined in just two days or why Apple and Meta underwent steep sell-offs -- then you're not alone.

The Vanguard Mega Cap Growth ETF (NYSEMKT: MGK) offers the simplest way to bet on sustained AI innovation from today's market leaders without having to fixate on why some stocks are in or out of favor.

The fund is essentially an even more concentrated version of the popular Vanguard Growth ETF. And unlike index-specific ETFs, such as the Invesco QQQ Trust, which tracks the Nasdaq-100, the Vanguard Mega Cap Growth ETF holds stocks like Eli Lilly and Oracle that are on the New York Stock Exchange rather than the Nasdaq.

With a staggering 67% weighting in just 10 holdings -- Nvidia, Apple, Alphabet, Microsoft, Amazon, Broadcom, Meta Platforms, Tesla, Eli Lilly, and Advanced Micro Devices -- the fund is essentially a concentrated bet that today's market leaders will continue driving outsize gains for years to come. That bet has paid off, as the Vanguard Mega Cap Growth ETF has outperformed the S&P 500 during the past decade.

MGK Total Return Level Chart

MGK Total Return Level data by YCharts.

A catch-all bet on today's market-leading growth stocks

The Vanguard Mega Cap Growth ETF is a good buy for investors seeking significant exposure to chip leaders, cloud computing giants such as Amazon, Microsoft, and Alphabet, and more. The ETF could be a particularly appealing buy for investors looking for exposure to top growth stocks rather than just one sector.

For example, Nvidia, Apple, Microsoft, and Broadcom lead the tech sector; Amazon and Tesla are in the consumer discretionary sector; Alphabet and Meta dominate the communications sector; and Eli Lilly is a powerhouse growth stock that leads the healthcare sector. And with a mere 0.05% expense ratio, the ETF has just $5 in annual fees for every $10,000 invested. By comparison, the Vanguard Growth ETF and Vanguard S&P 500 ETF have 0.03% expense ratios, which means $3 in annual fees for every $10,000 invested.

The Vanguard Mega Cap Growth ETF is a good buy for investors who want exposure to the top growth stocks across all sectors, with an emphasis on today's industry leaders rather than spreading their allocation among lower-weighted components. Put another way, the Vanguard Mega Cap Growth ETF is a better buy than the Vanguard Growth ETF, a Nasdaq-100-based ETF, or an S&P 500 index fund if you believe that AI capex spending will pay off for hyperscalers like Amazon and Microsoft.

The market sent a clear stamp of approval for Amazon and Microsoft last week, casting out Apple and Meta Platforms. But just a week ago, Apple was significantly outperforming its megacap peers. The Vanguard Mega Cap Growth ETF offers a simple way for long-term investors to bet big on multiple themes rather than getting overly caught up in knee-jerk reactions to earnings reports.

Should you buy stock in Vanguard Morningstar Mega Cap Growth ETF right now?

Before you buy stock in Vanguard Morningstar Mega Cap Growth ETF, consider this:

The Motley Fool Stock Advisor analyst team just identified what they believe are the 10 best stocks for investors to buy now… and Vanguard Morningstar Mega Cap Growth ETF wasn’t one of them. The 10 stocks that made the cut could produce monster returns in the coming years.

Consider when Netflix made this list on December 17, 2004... if you invested $1,000 at the time of our recommendation, you’d have $386,727!* Or when Nvidia made this list on April 15, 2005... if you invested $1,000 at the time of our recommendation, you’d have $1,232,139!*

Now, it’s worth noting Stock Advisor’s total average return is 906% β€” a market-crushing outperformance compared to 208% for the S&P 500. Don't miss the latest top 10 list, available with Stock Advisor, and join an investing community built by individual investors for individual investors.

See the 10 stocks Β»

*Stock Advisor returns as of August 4, 2026.

Daniel Foelber has positions in Broadcom, Nvidia, and Oracle and has the following options: long September 2028 $100 calls on Oracle and short August 2026 $240 calls on Nvidia. The Motley Fool has positions in and recommends Advanced Micro Devices, Alphabet, Amazon, Apple, Broadcom, Eli Lilly, Meta Platforms, Microsoft, Nvidia, Oracle, Tesla, Vanguard Growth ETF, and Vanguard S&P 500 ETF. The Motley Fool has a disclosure policy.

☐ β˜† βœ‡ The Motley Fool

Meet 2 Vanguard ETFs That Just Hit All-Time Highs. Here's What They Have in Common (Hint: It Has to Do With SpaceX).

By: newsfeedback@fool.com (Daniel Foelber) β€”

Key Points

  • Micron, Broadcom, and Caterpillar are examples of value stocks that are capitalizing on AI-driven growth.

  • Value- and income-focused ETFs won't buy SpaceX because it isn’t consistently profitable.

  • Low-cost value and income ETFs are ideally suited for investors looking for a higher yield than S&P 500 and growth stock funds.

Last week's rip-roaring rally in Amazon and Microsoft marked a notable rebound in the Nasdaq Composite (NASDAQINDEX: ^IXIC) and pushed the S&P 500 (SNPINDEX: ^GSPC) within less than 3% of its all-time high. But even with that recovery, value stocks and many high-dividend-yield exchange-traded funds (ETFs) have been crushing the major indexes this year.

The Vanguard Value ETF (NYSEMKT: VTV) and Vanguard High Dividend Yield ETF (NYSEMKT: VYM) are both hovering around all-time highs and outperforming the S&P 500 and Nasdaq in 2026 -- whereas the Vanguard Growth ETF (NYSEMKT: VUG) is up just 5% year to date.

Where to invest $1,000 right now? Our analyst team just revealed what they believe are the 10 best stocks to buy right now, when you join Stock Advisor. See the stocks Β»

Meanwhile, Space Exploration Technologies (NASDAQ: SPCX) closed at just $108.37 on July 31, its lowest closing price since going public on June 12. SpaceX is now down 52% from its all-time high. And despite the sell-off, nine Vanguard ETFs already own SpaceX, and they will keep buying SpaceX even if it continues to fall.

Here's why investing in SpaceX is fundamentally different from the companies in the Vanguard Value ETF and Vanguard High Dividend Yield ETF, and why both ETFs are great buys now.

A person smiles while sitting in an office setting in front of a laptop computer.

Image source: Getty Images.

Earnings-driven growth

A misconception about value stocks is that they're all boring, slow-growing companies that generate high cash flows, often pay dividends, and feature inexpensive valuations. But a better way of thinking about value stocks is that they're priced for the mature businesses they are today, rather than purely on their growth potential. Earnings tend to drive price appreciation in value stocks, whereas growth stocks can sometimes rise and fall based on investor perceptions of how likely big bets will pay off.

VTV Total Return Level Chart

VTV Total Return Level data by YCharts

Although many top value stocks are safe, stodgy companies, there are plenty of examples of value stocks that have outperformed the major indexes over the long term or entered periods of accelerated earnings growth.

Look no further than the top holding of the Vanguard Value ETF, which is Micron Technology (NASDAQ: MU), with a 4.9% weighting in the fund. And Broadcom (NASDAQ: AVGO) is the largest holding in the High Dividend Yield ETF, with a 7.3% weighting. These are two established semiconductor stocks that were once viewed as value plays in the industry, but the boom in memory chips accelerated Micron's earnings growth and, in turn, its stock price. Similarly, Broadcom has been rapidly growing its custom AI chip and AI networking businesses, collaborating with hyperscalers such as Alphabet on Tensor Processing Units that enable cost savings and efficiency improvements at scale.

While you could argue that Micron and Broadcom are growth stocks after their run-ups in recent years, they are still distinctly different from stocks such as SpaceX, as earnings growth is the core driver of stock price appreciation. Whereas SpaceX reported a net loss of $4.94 billion in 2025 and will probably be free cash flow negative in the coming years as it pursues its big and costly bet on orbital AI data centers.

Similarly, Caterpillar (NYSE: CAT) is a top 10 holding in both the Value ETF and the High Dividend Yield ETF. Caterpillar has traditionally been viewed as an industry-leading cyclical value stock with an extensive track record of dividend growth. In June, Caterpillar raised its dividend for the 32nd consecutive year. But Caterpillar has benefited from the boom in AI data center construction and energy demand.

JPMorgan Chase (NYSE: JPM) is the No. 2 holding in both ETFs. Its stock price has soared a staggering 126% in just three years because of -- you guessed it -- earnings-driving growth.

Balancing value, income, and growth

The Vanguard Value ETF and Vanguard High Dividend Yield ETF are excellent buys for investors looking for quality companies with clear paths to future growth, rather than companies that need a lot to go right to reward patient investors.

SpaceX is chock-full of unbelievable potential, with a virtually unlimited total addressable market and unmatched technology. But even after its sell-off, SpaceX's roadmap for long-term growth is based entirely on abstract models of what the future could bring, whereas Micron, Broadcom, Caterpillar, and JPMorgan Chase are booking real profits and rewarding investors with dividends.

As of June 30, the Value ETF sports a 21.4 price-to-earnings (P/E) ratio and a 1.9% 30-day SEC dividend yield -- similar to the 21.6 P/E ratio and 2.3% dividend yield of the High-Dividend Yield ETF.

By comparison, the Vanguard S&P 500 ETF (NYSEMKT: VOO) has a 27.5 P/E ratio and 1% 30-day SEC dividend yield as of June 30, and the Vanguard Growth ETF has a 35.6 P/E and 0.4% dividend yield.

All four ETFs have low fees, with the Value ETF, Growth ETF, and S&P 500 ETF all featuring 0.03% expense ratios, and the High Dividend Yield ETF just slightly ahead at 0.04% -- or just $0.40 for every $1,000 invested.

Add it all up, and the Vanguard Value ETF and Vanguard High Dividend Yield ETF will appeal to investors looking for steady passive income from highly profitable, industry-leading companies.

Should you buy stock in Vanguard Morningstar Value ETF right now?

Before you buy stock in Vanguard Morningstar Value ETF, consider this:

The Motley Fool Stock Advisor analyst team just identified what they believe are the 10 best stocks for investors to buy now… and Vanguard Morningstar Value ETF wasn’t one of them. The 10 stocks that made the cut could produce monster returns in the coming years.

Consider when Netflix made this list on December 17, 2004... if you invested $1,000 at the time of our recommendation, you’d have $386,727!* Or when Nvidia made this list on April 15, 2005... if you invested $1,000 at the time of our recommendation, you’d have $1,232,139!*

Now, it’s worth noting Stock Advisor’s total average return is 906% β€” a market-crushing outperformance compared to 208% for the S&P 500. Don't miss the latest top 10 list, available with Stock Advisor, and join an investing community built by individual investors for individual investors.

See the 10 stocks Β»

*Stock Advisor returns as of August 4, 2026.

JPMorgan Chase is an advertising partner of Motley Fool Money. Daniel Foelber has positions in Broadcom. The Motley Fool has positions in and recommends Alphabet, Amazon, Broadcom, Caterpillar, JPMorgan Chase, Micron Technology, Microsoft, Vanguard Growth ETF, Vanguard High Dividend Yield ETF, Vanguard S&P 500 ETF, and Vanguard Value ETF. The Motley Fool has a disclosure policy.
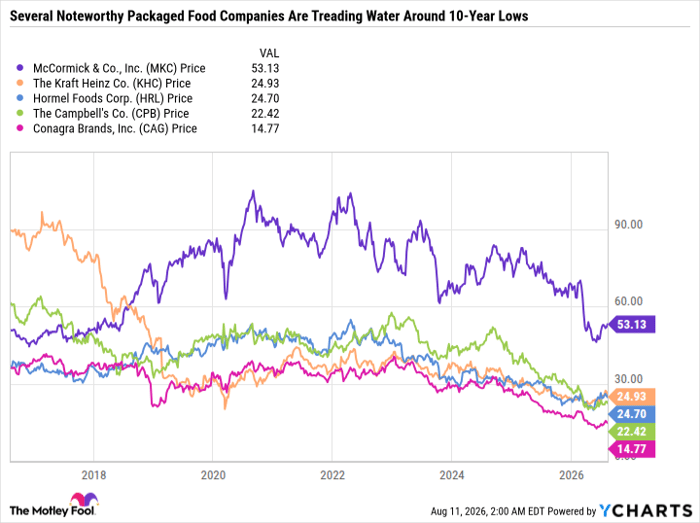
☐ β˜† βœ‡ The Motley Fool

Apple Shed $426 Billion in Market Cap in 2 Days. Here's What Wall Street Is Getting Wrong.

By: newsfeedback@fool.com (Daniel Foelber) β€”

Key Points

  • Apple’s product sales growth is outpacing its services growth.

  • Consumer demand may be pulled forward due to price increases.

  • Apple will be a long-term winner from artificial intelligence due to its integrated product ecosystem and consistently high cash flow.

Missed Nvidia in 2009? This Rare Signal Is Flashing Again. In 2009, a "Double Down" signal flashed for a little-known chipmaker called Nvidia. For the first time in years, that same "Total Conviction" signal is flashing for a company 1/100th the size of Nvidia. Continue Β»

Apple (NASDAQ: AAPL) just reported its best third quarter in five years.

Net sales grew 16.4% year over year, largely thanks to a 21.7% increase in iPhone sales and an 18.1% overall increase in product sales. It marked the first Q3 since fiscal 2021 when products outpaced services growth.

But despite the strong results, Apple fell 7.4% on July 31 -- losing $426 billion in market cap in just two days. Here's what Wall Street didn't like about Apple's results, and if the tech stock is a good buy now.

Apple logo on top of an Apple iPhone.

Image source: The Motley Fool.

Products take the spotlight

Demand for Apple's products surged during the pandemic as consumers shifted spending toward discretionary goods rather than services or experiences. But as you can see in the table, Apple's Q3 product sales went practically nowhere for years -- that is, until the jump we just saw in Q3 fiscal 2026.

Net Sales ($Billions)

Q3 Fiscal 2019

Q3 Fiscal 2020

Q3 Fiscal 2021

Q3 Fiscal 2022

Q3 Fiscal 2023

Q3 Fiscal 2024

Q3 Fiscal 2025

Q3 Fiscal 2026

Products

$42.35

$46.53

$63.95

$63.36

$60.58

$61.56

$66.61

$78.68

Services

$11.46

$13.16

$17.49

$19.6

$21.21

$24.21

$27.42

$30.74

Data source: Apple.

By comparison, services have been consistently growing in the double digits. Services include cloud storage via iCloud, Apple Card, Apple Pay, and digital subscriptions such as Apple Music, Apple TV, Apple One, and more.

Services have been an excellent, high-margin category for Apple and a way to increase the stickiness of its integrated ecosystem. But at the end of the day, Apple still relies on product sales. And seeing product sales jump is a clear signal that Apple is entering a new upgrade cycle.

Apple's "100-year flood"

In June, Apple raised prices on Mac, iPad, Apple TV, HomePod, and Vision Pro due to surging memory chip costs. Tim Cook addressed the reason for these price increases on the July 30 earnings call:

On the pricing front, we reluctantly raised prices, I would say. We did it because we're in what I would characterize as a 100-year flood on the memory pricing, with exponential increases in memory prices.

Some investors may be fearing that price increases are pulling forward demand for existing Apple product inventory ahead of the annual September new iPhone 18 Pro release. And the other risk is that consumers, who are already dealing with inflationary pressures from higher living costs -- such as food, gas, and shelter -- may resist higher product prices.

Wells Fargo analyst Aaron Rakers asked Apple management on the July 30 earnings call whether it was seeing a pull-forward in demand from the consumer, enterprise, or education markets, and if that's factoring into Apple's outlook. To which Tim Cook responded:

You're talking about on iPhone, I assume, in general. We've been running at this 22% growth rate for the last while. For this cycle has been a 22% increase year to date. It's not obvious, I would say. It's not obvious in the data that what you're asking is true. Obviously, we've now had to increase prices on iPad and Mac, the price elasticity there, it's just too early to come to a definitive conclusion of what happens there.

The 22% Cook is referring to is Apple's iPhone revenue for the nine months ended June 27, 2026 -- which is up 22.4% -- roughly matching the three months ended June 27, 2026 year-over-year growth rate of 21.7%. So while Cook isn't dismissing the notion that demand is being pulled forward, it's also clear that the latest quarter more so matches trends Apple was already seeing this fiscal year in the quarters before it announced price increases in June.

That being said, Apple's weak guidance of just 9% to 11% year-over-year net sales growth for fourth quarter fiscal 2026 seems to indicate that some demand could have been pulled forward. Or, at the very least, Apple is cautious about consumer demand heading into the iPhone 18 Pro launch in September, followed by its hottest quarter of the year, which tends to be the first quarter of Apple's fiscal year (the quarter ending in late December).

Alleviating cost pressures

Apple's rising costs is argubaly an even bigger concern than its weak revenue guidance. On the July 30 earnings call, Apple noted that the primary bottleneck is getting the microchips needed to handle the processing, graphics, and artificial intelligence (AI) functions on its devices. But because demand was better than expected, Apple's supply chain is arguably even more constrained now than it was before, which could lead to margin pressure.

Cook said the following on the July 30 earnings call:

The supply chain just has less flexibility in it than normal. We've been pulling supply ahead. At some point, there's a limit to that.

Arguably, the biggest near-term risk for Apple is that it would have to absorb much of these higher costs because it has already raised prices and consumers are spread thin. But one way to counteract some of that pressure is to make new product purchases more affordable.

Apple's new leasing program, facilitated by Klarna, will cost as little as $17.99 per month. Buy now, pay later options, paired with multi-year service contracts that carriers already offer, can help reduce price increases and drum up demand for upcoming products, such as a foldable iPhone, smart glasses, and an AI-powered pendant.

Granted, these programs are a form of leverage on consumer balance sheets. And too much reliance on buy now, pay later is a red flag for the broader economy. But it's a smart move by Apple to navigate a difficult period in its supply chain while protecting its margins.

Apple's investment thesis remains intact

Even after its sell-off, Apple is far from a cheap stock at 35.3 times earnings. However, the growth stock remains a good buy for investors who believe Apple can overcome its supply chain challenges and capitalize on AI without drastically increasing capital expenditures (capex).

AI tools will operate on Apple's devices. So Apple doesn't need to spend boatloads of capex developing its own AI models. Rather, it can cater to user preferences by offering a suite of options and collecting fees in the process. So AI will fuel a product upgrade cycle and new product development. And when paired with double-digit services growth and stock buybacks, Apple's earnings will accelerate, justifying its premium valuation.

There are plenty of other AI stocks with greater growth potential than Apple. But Apple benefits from AI while still generating gobs of free cash flow, making it arguably one of the most well-rounded AI stocks to buy now.

Should you buy stock in Apple right now?

Before you buy stock in Apple, consider this:

The Motley Fool Stock Advisor analyst team just identified what they believe are the 10 best stocks for investors to buy now… and Apple wasn’t one of them. The 10 stocks that made the cut could produce monster returns in the coming years.

Consider when Netflix made this list on December 17, 2004... if you invested $1,000 at the time of our recommendation, you’d have $386,727!* Or when Nvidia made this list on April 15, 2005... if you invested $1,000 at the time of our recommendation, you’d have $1,232,139!*

Now, it’s worth noting Stock Advisor’s total average return is 906% β€” a market-crushing outperformance compared to 208% for the S&P 500. Don't miss the latest top 10 list, available with Stock Advisor, and join an investing community built by individual investors for individual investors.

See the 10 stocks Β»

*Stock Advisor returns as of August 3, 2026.

Wells Fargo is an advertising partner of Motley Fool Money. Daniel Foelber has no position in any of the stocks mentioned. The Motley Fool has positions in and recommends Apple and Klarna Group. The Motley Fool has a disclosure policy.

☐ β˜† βœ‡ The Motley Fool

The Nasdaq Just Entered Its Second Correction of 2026. Here's What Investors Need to Know.

By: newsfeedback@fool.com (Daniel Foelber) β€”

Key Points

  • A flurry of corrections is adding to market volatility.

  • The corrections have been mere bumps along the way of a scorching-hot multiyear run in the Nasdaq Composite.

  • Expect more corrections so long as the Nasdaq is being driven by investor enthusiasm and stocks that are valued based on their future growth potential.

Wednesday's selloff sent the Nasdaq Composite (NASDAQINDEX: ^IXIC) down to its second correction of the year before it recovered Thursday. A correction is defined as a drop of 10% to 20% from recent highs in a major market index.

Here's what investors need to know about the Nasdaq sell-off, how it compares to other major indexes, and how the index's broader moves could be affecting their investment portfolios.

Where to invest $1,000 right now? Our analyst team just revealed what they believe are the 10 best stocks to buy right now, when you join Stock Advisor. See the stocks Β»

An abstract bull and bear on a stock market price graphic.

Image source: Getty Images.

An uptick in stock market corrections

Historically, stock market corrections in the S&P 500 (SNPINDEX: ^GSPC) occur about every one to two years. But there have been three corrections in the Nasdaq in the last 16 months.

In the Nasdaq's latest correction, the index closed at 24,442.94 on July 29, down 10.1% from its June 1 high of 27,190.21. Previously, on March 30, the Nasdaq closed at 20,794.64, down 13.4% from its Oct. 29, 2025, high of 24,019.99. And the first in this series briefly entered crash territory -- a rapid drop of more than 20% -- as the market reacted to President Donald Trump's initial round of tariffs. During the worst of it, the Nasdaq fell to an intraday low of 14,784.03 on April 7, which was down 26.5% from the Jan. 24, 2025, high of 20,118.61 -- although the lowest the Nasdaq closed during that period was 15,267.91 (or a decline of 24.1%) on April 8.

Corrections are happening faster and more frequently. But the Nasdaq has also been roaring higher -- outperforming the S&P 500 and Dow Jones Industrial Average (DJINDICES: ^DJI) in 2023, 2024, and 2025. In fact, each correction's low has been higher than the high that preceded the prior correction. This pattern of higher highs and higher lows is typical of a bull market, where stock prices rise over the long term.

The S&P 500 and Dow haven't been nearly as volatile as the Nasdaq. On July 29, the S&P 500 closed just 4% off its high. Despite falling 2.2% on July 29, the Dow closed down just 3.2% from its all-time high. However, the S&P 500 was hovering right around correction territory in March 2026, and all three indexes entered a correction in April 2025.

A semiconductor-led sell-off

Volatility is simply the price of admission for participating in a market driven by growth stocks. Many tech-focused companies that have contributed the bulk of index gains in recent years are also valued for what they will do in the future rather than where they are today. So if growth cools, sentiment changes, or investors just aren't as confident in a thesis playing out -- like artificial intelligence (AI) capital expenditures paying off -- then growth stocks can fall just as quickly as they rose.

As an example, the semiconductor industry has been scorching hot in recent years. As of June 30, semiconductor, semiconductor materials, and semiconductor equipment companies made up 46.4% of the Vanguard Information Technology ETF -- which tracks the tech sector. But concentration is a double-edged sword, as semiconductors are now leading the tech sector sell-off. In just two months, the tech sector, semiconductor industry, and many prominent chip stocks have gone from record highs to extreme sell-offs.

^IXT Chart

^IXT data by YCharts

A similar dynamic is occurring at the index level. The Nasdaq has become increasingly concentrated on a few key themes and megacap companies, many of which depend on AI-driven growth. So if that narrative flips, the Nasdaq can sell off quickly even as most other sectors hold up well.

The S&P 500 and Dow Jones Industrial Average aren't nearly as dependent on tech and tech-focused stocks as the Nasdaq. So resilience from other sectors of the stock market has helped limit index-wide drawdowns. However, tech still plays a significant role, and the Dow has added more tech-focused companies -- most recently dropping Verizon Communications and adding Alphabet in June.

Expect more volatility

Even before the AI boom, companies listed on the Nasdaq and the New York Stock Exchange were already leading in global tech. AI-driven growth has made U.S. indexes even more exposed to tech, from semiconductor giants to companies like Apple that make the devices that AI tools run on, to software, hardware, cloud computing, and data center infrastructure -- from server racks to energy giants to industrial picks and shovels players like Caterpillar and GE Vernova.

In sum, the Nasdaq embodies the risks and potential rewards of a tech-centered index. Whereas most other stock markets around the world aren't nearly as tech-dominant. The S&P Europe 350 consists of 350 blue chip companies from 16 developed European markets. Financials make up 25.1% of that index, followed by industrials at 18.5%. Even healthcare, at 13.1%, has a larger weighting than tech, at 9.8%.

The advantage of being an individual investor is that your financial goals matter more than your performance relative to an index. So you don't need to take on more risk than you're comfortable with or feel like you need to conform to whatever the indexes are doing. Rather, a better solution is to understand what indexes are composed of and what will drive their performance, and then position your portfolio accordingly.

For some risk-tolerant investors who believe we are still in the early innings of AI innovation and adoption, that may mean building a portfolio around tech stocks and growth-focused exchange-traded funds. Whereas others may want to be less weighted in tech than the major indexes, which could lead to portfolio underperformance if AI continues pole-vaulting the major indexes to new heights, but it can also help limit drawdowns during tech-driven sell-offs like we are in now.

Should you buy stock in NASDAQ Composite Index right now?

Before you buy stock in NASDAQ Composite Index, consider this:

The Motley Fool Stock Advisor analyst team just identified what they believe are the 10 best stocks for investors to buy now… and NASDAQ Composite Index wasn’t one of them. The 10 stocks that made the cut could produce monster returns in the coming years.

Consider when Netflix made this list on December 17, 2004... if you invested $1,000 at the time of our recommendation, you’d have $397,081!* Or when Nvidia made this list on April 15, 2005... if you invested $1,000 at the time of our recommendation, you’d have $1,166,221!*

Now, it’s worth noting Stock Advisor’s total average return is 889% β€” a market-crushing outperformance compared to 203% for the S&P 500. Don't miss the latest top 10 list, available with Stock Advisor, and join an investing community built by individual investors for individual investors.

See the 10 stocks Β»

*Stock Advisor returns as of July 31, 2026.

Daniel Foelber has no position in any of the stocks mentioned. The Motley Fool has positions in and recommends Advanced Micro Devices, Alphabet, Apple, Caterpillar, GE Vernova, Intel, Micron Technology, Western Digital, and iShares Trust-iShares Semiconductor ETF. The Motley Fool recommends Verizon Communications. The Motley Fool has a disclosure policy.

☐ β˜† βœ‡ The Motley Fool

SCHD and VYM Are Crushing the S&P 500 and Nasdaq-100. Here's the Better ETF of the 2 to Buy for Passive Income in August.

By: newsfeedback@fool.com (Daniel Foelber) β€”

Key Points

  • The Schwab U.S. Dividend Equity ETF has a higher yield than the Vanguard High Dividend Yield ETF.

  • The Vanguard High Dividend Yield ETF has greater exposure to growth and cyclical stocks.

  • Both ETFs offer compelling ways to participate in the stock market while generating passive income.

The Schwab U.S. Dividend Equity ETF (NYSEMKT: SCHD) and Vanguard High Dividend Yield ETF (NYSEMKT: VYM) have no shortage of similarities. They have almost identical net assets around $96 billion, dirt cheap expense ratios of 0.06% and 0.04%, respectively, and dividend yields of 3.3% and 2.3%, respectively.

They are also crushing the S&P 500 (SNPINDEX: ^GSPC) and Nasdaq-100 this year. The Nasdaq-100 is the 100 largest non-financial companies by market cap listed on the Nasdaq stock exchange.

Where to invest $1,000 right now? Our analyst team just revealed what they believe are the 10 best stocks to buy right now, when you join Stock Advisor. See the stocks Β»

Here's the better choice between these two ETFs for income investors to buy in August.

A person deposits coins into glass jars that sprout increasingly taller plants based on the number of coins per jar.

Image source: Getty Images.

Key differences between SCHD and VYM

Unlike covered call ETFs, the Schwab U.S. Dividend Equity ETF and Vanguard High Dividend Yield ETF do not cap their upside. Rather, they invest in a basket of dividend-paying stocks. But there are some distinct differences between the ETFs that investors should pay attention to.

The biggest difference is that the Schwab U.S. Dividend Equity ETF focuses more on current dividend yield, whereas the Vanguard High Dividend Yield ETF emphasizes both dividend growth and yield.

This distinction is apparent in the sector weights of both ETFs.

Sector

Schwab U.S. Dividend Equity ETF

Vanguard High Dividend Yield ETF

Healthcare

20.7%

12.4%

Consumer staples

20.4%

8.5%

Technology and communication services

15.4%

18.6%

Energy

14.1%

8.5%

Industrials and materials

11.6%

17.4%

Financials

10.1%

20.7%

Consumer discretionary

7.7%

7.9%

Utilities

0.1%

6%

Data sources: Charles Schwab, Vanguard.

A staggering 41.1% of the Schwab U.S. Dividend Equity ETF is in healthcare and consumer staples stocks, whereas industrials, materials, and financials dominate the Vanguard High Dividend Yield ETF. Both ETFs have significant exposure to tech and communication stocks, but the way they approach that exposure differs.

The Schwab U.S. Dividend Equity ETF has significant holdings in Verizon Communications, Comcast, Texas Instruments, and Qualcomm. In contrast, the Vanguard High Dividend Yield ETF's largest holding is Broadcom at 7.3%. Cisco Systems is also a top 10 holding in the fund.

The Schwab U.S. Dividend Equity ETF is outperforming the Vanguard High Dividend Yield ETF in 2026, largely thanks to its outsize exposure to energy stocks.

SCHD Total Return Level Chart

SCHD Total Return Level data by YCharts

Despite the Schwab U.S. Dividend Equity ETF's emphasis on value-focused sectors, capital gains rather than dividends have still been the key driver of its long-term performance -- just like the Vanguard High Dividend Yield ETF. The Schwab U.S. Dividend Equity ETF has produced a 225.7% total return over the past decade compared to 199.2% for the Vanguard High Dividend Yield ETF.

The better buy for income investors

The Schwab U.S. Dividend Equity ETF is a better overall ETF for generating dividend income from stocks than the Vanguard High Dividend Yield ETF. Its superior 3.3% dividend yield and balanced exposure to value-focused sectors make it a far more appealing option for risk-averse investors. And although it does have a high weighting to the energy sector -- which can be volatile -- that weighting is anchored in Chevron and ConocoPhillips, which both have excellent assets that can generate high free cash flow even at lower oil and gas prices.

By comparison, the Vanguard High Dividend Yield ETF focuses more on quality dividend-growth companies, which can be a better fit for investors who don't mind the lower 2.3% yield and want diversified exposure to sectors like financials and artificial intelligence leaders such as Broadcom.

Should you buy stock in Schwab U.S. Dividend Equity ETF right now?

Before you buy stock in Schwab U.S. Dividend Equity ETF, consider this:

The Motley Fool Stock Advisor analyst team just identified what they believe are the 10 best stocks for investors to buy now… and Schwab U.S. Dividend Equity ETF wasn’t one of them. The 10 stocks that made the cut could produce monster returns in the coming years.

Consider when Netflix made this list on December 17, 2004... if you invested $1,000 at the time of our recommendation, you’d have $390,394!* Or when Nvidia made this list on April 15, 2005... if you invested $1,000 at the time of our recommendation, you’d have $1,209,184!*

Now, it’s worth noting Stock Advisor’s total average return is 899% β€” a market-crushing outperformance compared to 206% for the S&P 500. Don't miss the latest top 10 list, available with Stock Advisor, and join an investing community built by individual investors for individual investors.

See the 10 stocks Β»

*Stock Advisor returns as of July 30, 2026.

Charles Schwab is an advertising partner of Motley Fool Money. Daniel Foelber has positions in Broadcom and Schwab U.S. Dividend Equity ETF. The Motley Fool has positions in and recommends Broadcom, Chevron, Cisco Systems, Qualcomm, Texas Instruments, and Vanguard High Dividend Yield ETF. The Motley Fool recommends Charles Schwab, Comcast, ConocoPhillips, and Verizon Communications and recommends the following options: short September 2026 $95 calls on Charles Schwab. The Motley Fool has a disclosure policy.

☐ β˜† βœ‡ The Motley Fool

Prediction: Under Greg Abel, Berkshire Hathaway Will Hold This Warren Buffett Stock for Decades for This Remarkably Simple Reason

By: newsfeedback@fool.com (Daniel Foelber) β€”

Key Points

Berkshire Hathaway (NYSE: BRKA) (NYSE: BRKB) has held American Express (NYSE: AXP) for nearly 40 years, making it a staple holding under former CEO Warren Buffett. I predict Berkshire will continue to hold American Express under Warren Buffett's hand-picked successor, Greg Abel, because the company is attracting new cardholders from younger generations through its highly appealing rewards program.

Here's why the value stock is a great buy now.

Missed Nvidia in 2009? This Rare Signal Is Flashing Again. In 2009, a "Double Down" signal flashed for a little-known chipmaker called Nvidia. For the first time in years, that same "Total Conviction" signal is flashing for a company 1/100th the size of Nvidia. Continue Β»

Berkshire Hathaway's former CEO, Warren Buffett.

Former Berkshire Hathaway CEO Warren Buffett. Image source: The Motley Fool.

American Express is winning with millennials and Gen Zers

In the second quarter of 2026, as American Express reported on July 24, Gen Xers accounted for 36% of spending volumes among individual consumers, followed by 31% from millennials, 27% from baby boomers and older, and 7% from Gen Zers.

However, Gen Zers showed 40% year-over-year spending growth, followed by 14% from millennials, 10% from Gen Xers, and 5% from baby boomers. Although Gen Xers and baby boomers account for the majority of consumer spending, the fastest-growing cohorts are younger generations.

American Express's secret sauce

Cross-generational engagement is the holy grail of consumer brands. It's how fellow Berkshire core holding Coca-Cola became a beverage enjoyed across age groups and geographies, and how Apple built an ecosystem that incentivizes families to adopt the next generation of Apple products.

To achieve cross-generational adoption, a brand has to offer something above and beyond the competition. And for American Express, that's a rewards program unlike any other. For the six months ended June 30, American Express raked in $5.61 billion in net card fees but spent a staggering $9.94 billion on card member rewards.

So even though its annual Gold Card membership now costs $325 and the Platinum Card costs $895, members are still getting a good deal based on the value of their rewards.

The beauty of American Express's business is that it can afford these ultra-generous card member perks because its main revenue stream is what's known as discount revenue, which is the fees it collects from merchants each time an American Express card is swiped, inserted, tapped, or entered digitally. For the six months ended June 30, American Express generated $19.68 billion in discount revenue.

Anchor your portfolio with a high-quality stock

American Express has built an ecosystem that can endure for generations to come. It starts with a network of 155.1 million cards in force, which creates network effects that incentivize merchants to accept American Express even though the cards tend to have higher fees than Visa and Mastercard.

In turn, American Express generates substantial discount revenue, which it can use to offer generous perks to card members that cost nearly twice what members pay in annual fees. Because members are getting such a good deal, they are incentivized to rack up as many reward points as possible, which boosts discount revenue from merchant fees -- and the cycle repeats.

American Express is attracting new card members and guiding for double-digit revenue growth and record earnings in 2026, even though consumer spending has been under pressure. The results and forecast show that the business can thrive regardless of the economic cycle.

Add it all up, and American Express stands out as arguably the single best Berkshire Hathaway stock to buy now.

Should you buy stock in American Express right now?

Before you buy stock in American Express, consider this:

The Motley Fool Stock Advisor analyst team just identified what they believe are the 10 best stocks for investors to buy now… and American Express wasn’t one of them. The 10 stocks that made the cut could produce monster returns in the coming years.

Consider when Netflix made this list on December 17, 2004... if you invested $1,000 at the time of our recommendation, you’d have $379,662!* Or when Nvidia made this list on April 15, 2005... if you invested $1,000 at the time of our recommendation, you’d have $1,206,116!*

Now, it’s worth noting Stock Advisor’s total average return is 886% β€” a market-crushing outperformance compared to 206% for the S&P 500. Don't miss the latest top 10 list, available with Stock Advisor, and join an investing community built by individual investors for individual investors.

See the 10 stocks Β»

*Stock Advisor returns as of July 29, 2026.

American Express is an advertising partner of Motley Fool Money. Daniel Foelber has positions in American Express. The Motley Fool has positions in and recommends American Express, Apple, Berkshire Hathaway, Mastercard, and Visa. The Motley Fool has a disclosure policy.
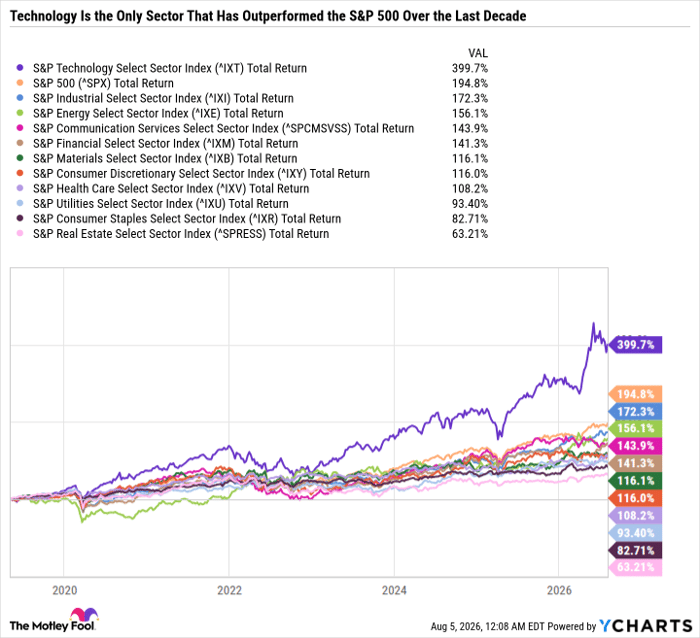
☐ β˜† βœ‡ The Motley Fool

The S&P 500 and Dow Are on Track to Beat the Nasdaq for the First Time Since 2022. Here's What That Means for Investors.

By: newsfeedback@fool.com (Daniel Foelber) β€”

Key Points

  • The S&P 500 and Dow aren’t as tech-centeric as the Nasdaq Composite.

  • Alphabet has been punished for its AI spending.

  • Apple is soaring because its growth doesn’t depend on AI capital expenditures.

In 2023, 2024, and 2025, the Nasdaq Composite (NASDAQINDEX: ^IXIC) outperformed the S&P 500 (SNPINDEX: ^GSPC), and both indexes outperformed the Dow Jones Industrial Average (DJINDICES: ^DJI). And until recently, the Nasdaq was outpacing the S&P 500 and Dow yet again in 2026.

But a sell-off in tech stocks has pushed the Nasdaq's year-to-date total return (capital gains plus dividends) to 7.8%, underperforming the S&P 500's 9% total return and the Dow's 9.1%.

Where to invest $1,000 right now? Our analyst team just revealed what they believe are the 10 best stocks to buy right now, when you join Stock Advisor. See the stocks Β»

Here's what you need to know about what's driving the Nasdaq's underperformance, and how it could be affecting your investment portfolio.

An abstract image featuring bar charts overlapping financial and stock market data.

Image source: Getty Images.

Growth stock dominance is being tested

The Nasdaq lost around a third of its value in 2022 because of inflationary pressures and valuation concerns amid a post-pandemic recovery. But on Nov. 30, 2022, OpenAI introduced ChatGPT. And what followed was a largely artificial intelligence (AI)-driven rally in tech stocks, especially semiconductor companies.

Index

2022

2023

2024

2025

2026 (as of Market Close July 27)

Nasdaq Composite

(32.5%)

44.6%

29.6%

21.1%

7.8%

S&P 500

(18.1%)

26.3%

25%

17.9%

9%

Dow Jones Industrial Average

(6.9%)

16.2%

15%

14.9%

9.1%

Data source: YCharts.

The Nasdaq is far more heavily weighted in tech stocks and tech-focused companies than the S&P 500 and the Dow, so it benefited more from AI-driven stock gains. Tech and tech-focused companies also have a heavier weighting in the S&P 500 than the Dow, although the Dow has become more representative of the modern market with the addition of several tech-focused companies -- most recently Alphabet (NASDAQ: GOOG) (NASDAQ: GOOGL) in June.

Still, financials are by far the heaviest-weighted Dow sector. And the Dow has higher weightings in value-focused and cyclical sectors like industrials, healthcare, and consumer staples than the S&P 500. So when market leadership shifts from growth stocks to value stocks, like in 2022, the Dow tends to outperform the S&P 500 and Nasdaq.

Alphabet and Apple reflect current market sentiment

The Dow and S&P 500 overtaking the Nasdaq's year-to-date return shows a shift in market leadership toward value-focused sectors. Earnings drive stock prices in the long term. But in the short term, narratives, emotion, and sentiment can play an even bigger role. Investors who maintain a long-term mindset by filtering out market noise and focusing on fundamentals are best positioned to build wealth.

Alphabet's earnings report from last week encapsulated current market sentiment. The results were nothing short of spectacular -- record revenue, a big jump in earnings, and 34% operating margins. Despite all the positives, Alphabet sold off because of spending concerns.

GOOGL Revenue (Quarterly) Chart

GOOGL Revenue (Quarterly) data by YCharts

As you can see in the chart, Alphabet's capital expenditures (capex) surged to $45.9 billion -- driven by AI. And that increased capex caused Alphabet to report its first negative free cash flow (FCF) quarter in over a decade.

So, in just a few years, Alphabet transformed from a high-margin money-printing machine to a company that is now seeing more cash leave the business than enter it. And Alphabet shows no signs of slowing its spending, raising its full-year capex guidance in line with Amazon's and calling for even higher spending in 2027.

The sell-off in hyperscalers like Alphabet, Amazon, and Microsoft -- and the broader pullback in semiconductor stocks -- shows that some investors are growing skeptical of the return on investment of AI spending. Whereas just a couple of years ago, ramp-ups in AI spending were celebrated by Wall Street -- demonstrating two contrasting reactions to the same news. Apple (NASDAQ: AAPL) shows the other side of the coin.

The narrative has totally flipped on Apple. Just last summer, Apple was in a steep sell-off as investors questioned its slowing growth and lack of AI investments. Now, investors are cheering Apple's regimented approach to AI spending. Apple is in cat bird's seat because it owns the devices that AI tools run on. It can simply partner with the best AI models rather than building its own. Apple is hovering around an all-time high because it is generating consistently decent growth that doesn't depend on AI spending and still stands to benefit from AI long-term.

Buying quality companies on sale

Making informed investment decisions is easier when you know what's driving the major indexes. But the indexes only tell part of the story. After all, Apple's gains have benefited the Nasdaq more than the S&P 500 or the Dow, and yet the Nasdaq is still underperforming. So it's important to look beyond the indexes for the complete picture.

Right now, the market is skeptical that AI spending will pay off -- which is why Apple is trading at 38.5 times forward earnings, compared to just 16.5 for Alphabet. And to be fair, at least some of that skepticism is understandable considering it's pretty shocking to see Alphabet's FCF turn negative.

Investors who believe the spending will ultimately pay off are getting an excellent opportunity to scoop up shares of quality companies like Alphabet at a discount. However, it's a mistake to assume that just because an AI stock has sold off, it's a bargain, as many red-hot AI stocks are still priced for perfection.

Should you buy stock in Alphabet right now?

Before you buy stock in Alphabet, consider this:

The Motley Fool Stock Advisor analyst team just identified what they believe are the 10 best stocks for investors to buy now… and Alphabet wasn’t one of them. The 10 stocks that made the cut could produce monster returns in the coming years.

Consider when Netflix made this list on December 17, 2004... if you invested $1,000 at the time of our recommendation, you’d have $379,662!* Or when Nvidia made this list on April 15, 2005... if you invested $1,000 at the time of our recommendation, you’d have $1,206,116!*

Now, it’s worth noting Stock Advisor’s total average return is 886% β€” a market-crushing outperformance compared to 206% for the S&P 500. Don't miss the latest top 10 list, available with Stock Advisor, and join an investing community built by individual investors for individual investors.

See the 10 stocks Β»

*Stock Advisor returns as of July 29, 2026.

Daniel Foelber has no position in any of the stocks mentioned. The Motley Fool has positions in and recommends Alphabet, Amazon, Apple, and Microsoft. The Motley Fool has a disclosure policy.
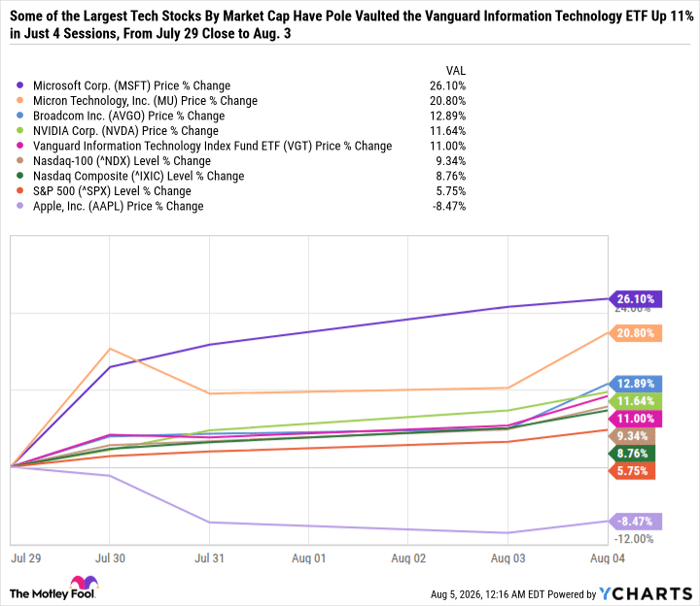
☐ β˜† βœ‡ The Motley Fool

Meet the Dividend Growth Stock That Warren Buffett Held for Decades, and Greg Abel Pegged as One of Berkshire Hathaway's Multidecade Compounders

By: newsfeedback@fool.com (Daniel Foelber) β€”

Key Points

  • Card member rewards spending is elevated following the launch of the revamped Platinum Card in September 2025.

  • American Express continues to grow revenue and earnings at a breakneck pace.

  • American Express is returning boatloads of cash to shareholders through dividends and buybacks.

On Jan. 1, Greg Abel succeeded Warren Buffett as CEO of Berkshire Hathaway (NYSE: BRKA) (NYSE: BRKB), taking over a portfolio of publicly traded equities worth hundreds of billions of dollars, as well as other controlled companies worth even more -- such as Berkshire's insurance businesses, railroads, Berkshire Hathaway Energy, manufacturing, service, retail businesses, and more.

Abel wasted no time making some massive portfolio moves, including selling several small positions and pole-vaulting Alphabet (on Buffett's recommendation) to one of Berkshire's top five holdings. Amid the portfolio changes, Abel added steadfast conviction to Berkshire's largest holdings, saying that Berkshire's concentration in American Express (NYSE: AXP), Apple, Coca-Cola, and Moody's will continue, as Berkshire expects these companies to compound over decades.

Where to invest $1,000 right now? Our analyst team just revealed what they believe are the 10 best stocks to buy right now, when you join Stock Advisor. See the stocks Β»

But it has been a rough year for American Express investors. The stock fell 4.3% on July 24 in response to its second-quarter 2026 earnings report, putting American Express down 11.8% year to date.

Here's why American Express is a no-brainer value stock to buy now despite its post-earnings sell-off.

Warren Buffett, Berkshire Hathaway CEO from 1970 until the end of 2025.

Image source: The Motley Fool.

On pace for a banner year

American Express barely missed on revenue expectations and noted an uptick in expenses related to its revamped U.S. Platinum Card perks. The sell-off seems overblown, given that the payment processor and card issuer raised its guidance and now expects a 10% increase in 2026 revenue.

The upbeat growth stems from strong customer additions and increasing customer spending. On a foreign-exchange-adjusted basis, which accounts for currency fluctuations, American Express reported 9% card member spending growth in Q2, which is the highest rate in three years. American Express is guiding for full-year earnings per share of $17.30 to $17.90, which would be an all-time high.

American Express's loyal customer base and steadily rising earnings enable it to consistently increase dividends and repurchase stock at a breakneck pace, accelerating earnings-per-share growth. As of the six months ended June 30, American Express has 682 million shares outstanding, down 3% from a year prior. And over the past decade, American Express has reduced its share count by more than 25%, it's roughly tripled its dividend, and the stock price has more than quintupled. Yet American Express remains an incredible value because earnings growth and buybacks have kept the valuation in check. American Express trades at just 18.5 times the midpoint of its 2026 earnings estimate.

A winning formula

American Express continues to deliver double-digit revenue and earnings growth even amid strained consumer spending. That growth is a testament to the strength of its business model.

American Express caters to an affluent customer base with a reward system built around discretionary spending and perks. Because of high spending on wants rather than needs, the customer base may be less sensitive to inflationary pressures, such as higher gas, food, and shelter costs.

Its members win because their perk value nearly doubles their membership costs on average. American Express collected just $5.61 billion in net card fees in the six months ended June 30, compared with $9.94 billion in card member rewards expenses.

If card fees were the only source of American Express's income, the company wouldn't last long. But like its card members, American Express also wins because customers have an incentive to prioritize spending with their American Express cards to justify the high annual fees and maximum membership rewards. The amount of fees that American Express collected from merchants alone in the six months ended June 30 was roughly double card member reward expenses.

And the merchants win because, although they pay American Express high fees, they still generate sales they might not have made if they hadn't accepted American Express.

American Express shareholders have historically won too because the company generates steady earnings growth that has justified a higher stock price, as well as rising cash flows that allow it to return capital to shareholders through a growing dividend and buybacks.

Add it all up, and American Express is as close to a perfect business model as you'll find.

A top-tier stock to buy now

American Express checks all the boxes of a textbook Warren Buffett stock. It has an established business model and brand, a wide moat from the network effects of its loyal customer base, and a clear path to growing earnings for decades to come. So it's no surprise that Abel called it out as a core Berkshire holding he expects to compound well into the future.

Add it all up, and American Express stands out as one of the best dividend growth stocks for investors to buy now, and one worthy of building an everlasting portfolio around.

Should you buy stock in American Express right now?

Before you buy stock in American Express, consider this:

The Motley Fool Stock Advisor analyst team just identified what they believe are the 10 best stocks for investors to buy now… and American Express wasn’t one of them. The 10 stocks that made the cut could produce monster returns in the coming years.

Consider when Netflix made this list on December 17, 2004... if you invested $1,000 at the time of our recommendation, you’d have $377,990!* Or when Nvidia made this list on April 15, 2005... if you invested $1,000 at the time of our recommendation, you’d have $1,269,518!*

Now, it’s worth noting Stock Advisor’s total average return is 896% β€” a market-crushing outperformance compared to 206% for the S&P 500. Don't miss the latest top 10 list, available with Stock Advisor, and join an investing community built by individual investors for individual investors.

See the 10 stocks Β»

*Stock Advisor returns as of July 27, 2026.

American Express is an advertising partner of Motley Fool Money. Daniel Foelber has positions in American Express. The Motley Fool has positions in and recommends Alphabet, American Express, Apple, Berkshire Hathaway, and Moody's. The Motley Fool has a disclosure policy.

☐ β˜† βœ‡ The Motley Fool

SpaceX Stock Is Down 48% From Its High. Here's Why ETFs Are Loading Up Anyway.

By: newsfeedback@fool.com (Daniel Foelber) β€”

Key Points

Space Exploration Technologies (NASDAQ: SPCX) closed at $118.24 per share on July 23 -- down 48% from its all-time high of $225.64 per share from June 16 -- which was the third trading session after its June 12 initial public offering (IPO).

However, several popular exchange-traded funds (ETFs) will continue buying SpaceX, even if its price keeps falling, because of their float-based weighting systems. The float is the number of shares available on the open market (in this case, the Nasdaq Stock Market) for public buying and selling. Float-based weighting systems will create substantial demand for SpaceX over the next several months as the float increases.

Where to invest $1,000 right now? Our analyst team just revealed what they believe are the 10 best stocks to buy right now, when you join Stock Advisor. See the stocks Β»

Here's why investors need to be wary of SpaceX's impact on the buying behavior of ETFs -- and the ripple effects this behavior has across the market.

Abstract concept featuring a grid of lines and dots joining together and heading toward a black hole.

Image source: Getty Images.

SpaceX's IPO changed the game

Today's largest companies by market cap all went public at a small fraction of their current value. Investors who bought Apple and Microsoft on the Nasdaq in the 1980s enjoyed life-changing gains. But SpaceX is different.

It built up a megacap valuation in the private markets and raised capital through several funding rounds over a multidecade period. So by the time it went public, it was so large that the indexes and ETFs had to adopt new rules to gradually build positions without artificially driving up the price.

The solution is float-adjusted market cap, which means the Nasdaq-100 and ETFs like Invesco QQQ Trust, Vanguard Total Stock Market ETF (NYSEMKT: VTI), Vanguard Growth ETF, Vanguard Mega Cap Growth ETF, etc., are buying SpaceX and weighting it based on a multiple of its float rather than its market cap. As of June 30, SpaceX is the 110th-largest holding in the Vanguard Total Stock Market ETF, right behind ServiceNow, even though SpaceX's market cap is over 15 times higher than ServiceNow's.

ETFs are about to buy a lot more SpaceX stock

SpaceX's float is about to increase substantially in August, beginning two days after SpaceX's Aug. 4 second-quarter 2026 earnings report.

On Aug. 6, 20% of early release eligible shares will be unlocked, which could drastically increase SpaceX's float if insiders sell their shares on Nasdaq. Once the float represents a large enough share of SpaceX's outstanding shares, SpaceX will be weighted by its market cap -- which is roughly the size of Meta Platforms' (NASDAQ: META). This means that before the end of the year, SpaceX will become a top-three holding in the Vanguard Communications Services ETF (NYSEMKT: VOX), a top-10 holding in the Vanguard Total Stock Market ETF, Vanguard Growth ETF, Vanguard Mega Cap Growth ETF, Vanguard Russell 1000 ETF, Vanguard Russell 1000 Growth ETF, and the Vanguard Large-Cap ETF, and probably a top-15 holding in the Vanguard Total World Stock ETF.

To illustrate just how massive the ETF buying influence will be, consider that, as of June 30, nine Vanguard ETFs collectively held $6.1 billion in SpaceX stock. SpaceX raised a total of $85.7 billion by selling 555 million shares at $135 each, and by underwriters exercising options to buy more shares. That means the total position of these Vanguard ETFs alone, which doesn't even factor in the Invesco QQQ Trust and ETFs operated by other investment management companies, was 7.1% of SpaceX's initial float.

The Vanguard Total Stock Market ETF alone is so massive that it holds $39.3 billion in Meta Platforms stock -- which again has a similar market cap to SpaceX. Once SpaceX's float is large enough, and the Vanguard Total Stock Market ETF weights it based on its market cap rather than float, the Vanguard Total Stock Market ETF will hold close to 3% of all of SpaceX's shares outstanding. Once SpaceX is added to the S&P 500 (likely next June), I'd expect the three largest S&P 500 ETFs by net assets -- the Vanguard S&P 500 ETF, the iShares Core S&P 500 ETF, and the SPDR S&P 500 ETF Trust -- to collectively hold over 5% of SpaceX's outstanding shares.

ETFs' insatiable appetites for blockbuster IPOs won't end with SpaceX

There are two key takeaways for investors regarding the impact of ETFs on SpaceX.

The first is that ETFs will continue loading up on SpaceX as its float grows, even if its stock price goes down, which is the opposite of how ETFs typically work. For example, Micron Technology made up 1.8% of the Vanguard Total Stock Market ETF as of June 30 -- ahead of Meta Platforms even though its market cap is higher -- simply because it ran up so much in the first half of the year.

The second takeaway is that, despite the buying power of ETFs, SpaceX stock has been absolutely crushed in July. Not only is it down big from its highs, but it's now down around 12% from its IPO price, even though SpaceX received a $300-per-share price target from Morgan Stanley. That's a red flag that investors are souring on SpaceX, or at least questioning its valuation. And the sell-off is especially concerning given that we have yet to enter the period when restrictions on insider shares are lifted.

SpaceX is in a league of its own in terms of its total addressable market and technology. But the company went public at such a lofty valuation that it was doomed to undergo extreme volatility right out of the gate. Investors may want to consider conducting a portfolio review to see if they own any ETFs that are buying SpaceX and will continue buying more SpaceX shares in the coming months. If that is the case, it's important to make sure you are comfortable with that dynamic and to recognize that it will likely repeat when those same ETFs buy Anthropic and OpenAI in a similar fashion.

Should you buy stock in Space Exploration Technologies right now?

Before you buy stock in Space Exploration Technologies, consider this:

The Motley Fool Stock Advisor analyst team just identified what they believe are the 10 best stocks for investors to buy now… and Space Exploration Technologies wasn’t one of them. The 10 stocks that made the cut could produce monster returns in the coming years.

Consider when Netflix made this list on December 17, 2004... if you invested $1,000 at the time of our recommendation, you’d have $377,990!* Or when Nvidia made this list on April 15, 2005... if you invested $1,000 at the time of our recommendation, you’d have $1,269,518!*

Now, it’s worth noting Stock Advisor’s total average return is 896% β€” a market-crushing outperformance compared to 206% for the S&P 500. Don't miss the latest top 10 list, available with Stock Advisor, and join an investing community built by individual investors for individual investors.

See the 10 stocks Β»

*Stock Advisor returns as of July 27, 2026.

Daniel Foelber has no position in any of the stocks mentioned. The Motley Fool has positions in and recommends Apple, Meta Platforms, Micron Technology, Microsoft, ServiceNow, and Vanguard Growth ETF. The Motley Fool has a disclosure policy.

☐ β˜† βœ‡ The Motley Fool

The Vanguard Total Stock Market ETF (VTI) Now Holds 18,738,438 Shares of SpaceX Stock. Here's What That Means for Investors.

By: newsfeedback@fool.com (Daniel Foelber) β€”

Key Points

Investment management firm Vanguard recently updated the holdings of many of its index funds and exchange-traded funds (ETFs).

The second-largest ETF by net assets, the Vanguard Total Stock Market ETF (NYSEMKT: VTI), holds 18,738,438 shares of Space Exploration Technologies (NASDAQ: SPCX) -- worth $3.2 billion as of June 30. That's 3.4% of the 555 million shares that SpaceX sold for $135 from its initial public offering (IPO). Granted, SpaceX also raised another $10.7 billion from underwriters that exercised options to buy shares. But the key takeaway is the speed and size at which the ETF gobbled up SpaceX stock.

Missed Nvidia in 2009? This Rare Signal Is Flashing Again. In 2009, a "Double Down" signal flashed for a little-known chipmaker called Nvidia. For the first time in years, that same "Total Conviction" signal is flashing for a company 1/100th the size of Nvidia. Continue Β»

Here's what investors need to know about SpaceX's impact on well-known low-cost ETFs, and ways they can position their portfolio to get exposure to SpaceX or avoid it entirely.

A SpaceX Falcon Heavy rocket during launch.

Image source: Getty Images.

ETFs are buying SpaceX stock at a rapid rate

The Vanguard Total Stock Market ETF was aggressively buying a good chunk of SpaceX's float in June at a price far higher than the price at the time of this writing of $118.24 per share. In contrast, Vanguard's largest ETF by net assets, the Vanguard S&P 500 ETF, won't begin buying SpaceX until it is added to the S&P 500, which will be June 2027 at the earliest.

The value of the Vanguard Total Stock Market ETF's SpaceX position is roughly equal to the combined value of the eight other Vanguard ETFs that bought SpaceX in June.

The Vanguard Total Stock Market ETF is so large that even a $3.2 billion position represents just 0.14% of the fund. And there are 109 stocks with higher weights in the ETF than SpaceX.

Other Vanguard ETFs have a higher percentage weighting in SpaceX than the Vanguard Total Stock Market ETF. SpaceX already makes up 2.4% of the Vanguard Communication Services ETF (NYSEMKT: VOX) -- a sector ETF that invests in communication services stocks like Alphabet, Meta Platforms, and Netflix.

Because the sector ETF is more focused, it will hold a larger position in SpaceX than a broad-based fund like the Vanguard Total Stock Market ETF, which aims to own the entire U.S. stock market. Similarly, growth-focused ETFs like the Vanguard Growth ETF and Vanguard Mega Cap Growth ETF will own more SpaceX than the Vanguard Total Stock Market ETF.

Aligning ETF holdings with your interest in IPOs

The Vanguard Total Stock Market ETF bought a sizable stake in SpaceX less than three weeks after its IPO -- showcasing the impact of ETFs on demand for newly public companies. And it stands to reason that these ETFs will buy even more SpaceX as more shares become available for trading on the Nasdaq.

That timeline depends on the SpaceX lockup period and whether holders of SpaceX restricted stock units and early release eligible shares decide to sell. The first stress test will come on Aug. 6 -- two days after SpaceX reports second-quarter 2026 earnings. On that date, 20% of early-release eligible shares will be transferable.

Investors who don't want to be in rules-based ETFs that will be buying shares of SpaceX as more hit the Nasdaq should consider ETFs whose criteria don't align with SpaceX in the first place, such as the Vanguard Value ETF, the Vanguard Dividend Appreciation ETF, or any non-communications sector ETF. Investors who like the idea of being in an ETF that will be backing up the truck on SpaceX, on the other hand, may want to take a closer look at the Vanguard Communication Services ETF.

Should you buy stock in Space Exploration Technologies right now?

Before you buy stock in Space Exploration Technologies, consider this:

The Motley Fool Stock Advisor analyst team just identified what they believe are the 10 best stocks for investors to buy now… and Space Exploration Technologies wasn’t one of them. The 10 stocks that made the cut could produce monster returns in the coming years.

Consider when Netflix made this list on December 17, 2004... if you invested $1,000 at the time of our recommendation, you’d have $377,990!* Or when Nvidia made this list on April 15, 2005... if you invested $1,000 at the time of our recommendation, you’d have $1,269,518!*

Now, it’s worth noting Stock Advisor’s total average return is 896% β€” a market-crushing outperformance compared to 206% for the S&P 500. Don't miss the latest top 10 list, available with Stock Advisor, and join an investing community built by individual investors for individual investors.

See the 10 stocks Β»

*Stock Advisor returns as of July 26, 2026.

Daniel Foelber has positions in Netflix. The Motley Fool has positions in and recommends Alphabet, Meta Platforms, Netflix, Vanguard Dividend Appreciation ETF, Vanguard Growth ETF, Vanguard S&P 500 ETF, and Vanguard Value ETF. The Motley Fool has a disclosure policy.

☐ β˜† βœ‡ The Motley Fool

How Is SpaceX (SPCX) Already the Largest of 3,372 Holdings in This $97.7 Billion Vanguard ETF?

By: newsfeedback@fool.com (Daniel Foelber) β€”

Key Points

After weeks of waiting, investment management firm Vanguard finally updated the holdings of its 48 passively managed equity exchange-traded funds (ETFs).

Unsurprisingly, Space Exploration Technologies (NASDAQ: SPCX) popped up in the Vanguard Total Stock Market ETF, the Vanguard Growth ETF, and the Vanguard Mega Cap Growth ETF, among others.

Missed Nvidia in 2009? This Rare Signal Is Flashing Again. In 2009, a "Double Down" signal flashed for a little-known chipmaker called Nvidia. For the first time in years, that same "Total Conviction" signal is flashing for a company 1/100th the size of Nvidia. Continue Β»

By far the biggest surprise was that, as of June 30, SpaceX is the No. 1 holding in the Vanguard Extended Market ETF (NYSEMKT: VXF), ahead of 3,371 other stocks.

This is no small ETF by any means -- the Vanguard Extended Market ETF has $97.7 billion in net assets and traces its inception date back to December 2001.

Here's why SpaceX is now the top holding of the Vanguard Extended Market ETF and how it compares to the other Vanguard ETFs that bought SpaceX in June.

The sun on Earth’s horizon illuminates a grid of connected lines and dots, illustrating the growing importance of low-Earth-orbit broadband and mobile satellites.

Image source: Getty Images.

SpaceX is making waves in the ETF world

The Vanguard Extended Market ETF's 6,775,494 shares of SpaceX were valued at $1.158 billion as of June 30. The fund includes a blend of small- and mid-cap stocks, with a few large caps sprinkled in. So you may be wondering why a stock like SpaceX is in the ETF, given it has a $1.63 trillion market cap and is one of the 10 largest U.S. companies by market cap.

SpaceX's initial public offering was the largest in history based on SpaceX's valuation. But SpaceX raised just $75 billion by selling 555 million shares at $135 each and another $10.7 billion from underwriters with options to buy additional shares -- far less than its valuation. So the number of shares available for public trading on the Nasdaq -- known as the float -- is only around 5% of SpaceX's total shares outstanding.

Because SpaceX's float is such a small percentage of its market cap, the rules-based S&P 500 Completion Index that the Vanguard Extended Market ETF is modeled after probably classified SpaceX as something other than a megacap stock. This is why SpaceX was pole-vaulted to the fund's top holding in a matter of weeks.

These same market dynamics are why SpaceX makes up such a small percentage of funds like the Vanguard Growth ETF. If SpaceX were weighted by market cap, it would have a weighting similar to Meta Platforms at about 3.4%. Instead, SpaceX is just 0.29% of the fund, weighted by a multiple of its float rather than market cap.

The IPO wild west is just beginning

Float-based market cap weightings are effective because they act as a check-and-balance system on ETF demand. If SpaceX were weighted by market cap, then ETFs would artificially drive up its price, given how few of its outstanding shares are available for trading on the Nasdaq. But the pattern in which passively managed Vanguard ETFs are buying SpaceX showcases the imperfect system of megacap IPOs.

As SpaceX gradually unlocks shares starting Aug. 6, investors can expect it to make up a larger share of well-known ETFs like the Vanguard Growth ETF and Vanguard Total Stock Market ETF. But that larger float will also likely trigger SpaceX's removal from the Vanguard Extended Market ETF.

How ETFs are responding to SpaceX is a reminder to always understand what you're buying and why you're holding it. In the case of the Vanguard Extended Market ETF, I wouldn't be surprised if it dumped its entire SpaceX holding before the end of the year, but also had a short period where upcoming megacap IPOs like Anthropic and OpenAI would become top holdings, only to eventually be removed from the ETF.

Should you buy stock in Vanguard Index Funds - Vanguard Extended Market ETF right now?

Before you buy stock in Vanguard Index Funds - Vanguard Extended Market ETF, consider this:

The Motley Fool Stock Advisor analyst team just identified what they believe are the 10 best stocks for investors to buy now… and Vanguard Index Funds - Vanguard Extended Market ETF wasn’t one of them. The 10 stocks that made the cut could produce monster returns in the coming years.

Consider when Netflix made this list on December 17, 2004... if you invested $1,000 at the time of our recommendation, you’d have $371,519!* Or when Nvidia made this list on April 15, 2005... if you invested $1,000 at the time of our recommendation, you’d have $1,281,302!*

Now, it’s worth noting Stock Advisor’s total average return is 892% β€” a market-crushing outperformance compared to 206% for the S&P 500. Don't miss the latest top 10 list, available with Stock Advisor, and join an investing community built by individual investors for individual investors.

See the 10 stocks Β»

*Stock Advisor returns as of July 25, 2026.

Daniel Foelber has no position in any of the stocks mentioned. The Motley Fool has positions in and recommends Meta Platforms and Vanguard Growth ETF. The Motley Fool has a disclosure policy.

☐ β˜† βœ‡ The Motley Fool

This Industrial Stock Is Up 533% in 2 Years. I Predict It Will Join the Dow if Caterpillar Issues a Stock Split.

By: newsfeedback@fool.com (Daniel Foelber) β€”

Key Points

  • Even with Caterpillar, industrials aren't the heaviest-weighted sector in the Dow.

  • GE Vernova equipment is in high demand for data center applications.

  • GE Vernova would need to issue a stock split to be considered for the Dow.

International Business Machines had its worst day in its history on July 14. So you may think that the blue chip dividend stock would drag down the Dow Jones Industrial Average, but that didn't happen. IBM has only a 2.3% weighting in the Dow, so its losses were more than offset by fellow Dow component Goldman Sachs, which has a 12.4% weighting and gained 9% that day.

This is just one of many examples when a Dow heavyweight has carried drastic underperformance from lower-weighted components. Ten of the Dow's 30 components are down year to date, but the Dow is up nearly 8% thanks to the overperformance of its top three heaviest weighted components. Goldman Sachs has the top weighting in the Dow and is up 23%, followed by Caterpillar (NYSE: CAT), which has a 10.3% weighting and is up 56%; and UnitedHealth Group, which has a 4.9% weighting and is up 30% on the year.

Missed Nvidia in 2009? This Rare Signal Is Flashing Again. In 2009, a "Double Down" signal flashed for a little-known chipmaker called Nvidia. For the first time in years, that same "Total Conviction" signal is flashing for a company 1/100th the size of Nvidia. Continue Β»

The price-weighted Dow index can become unbalanced if a handful of stocks surge in price without issuing stock splits. Goldman Sachs is up 190% in the last five years, and Caterpillar has done even better, jumping 330%. Combined, these two stocks make up over 22% of the Dow.

Right now, the industrials sector has the second-highest overall weighting in the Dow, representing 19% of the index. I believe there's an industrial stock that would be an ideal component to join the Dow, but it would need Caterpillar to issue a stock split first to balance the index's industrial sector weighting. That stock is GE Vernova (NYSE: GEV) -- let's see if it's a good buy now.

Engineers working with specialized industrial machinery.

Image source: Getty Images.

A Caterpillar split could open the door for GE Vernova

GE Vernova has some history in the Dow. It was created by the 2023 split of General Electric, which was divided into GE Vernova, GE Healthcare Technologies, and GE Aerospace. GE was one of the original members of the Dow when it was founded in 1896, but was removed in 2018.

The three independent companies have collectively produced incredible gains for investors who held the original stock. GE Vernova is up a mind-numbing 700% since its spinoff and 533% in the last two years. The rapid rise has pole-vaulted its market cap to $282 billion -- making it the third most valuable U.S. industrial company behind Caterpillar and GE Aerospace.

But Caterpillar would likely need to split its stock to make room for GE Vernova so the industrial sector isn't overweighted in the index. Caterpillar has issued stock splits in the past; its most recent split came in 2005.

And which company would be removed from the index to make room for GE Vernova? A very logical seat change could be dropping Nike, given that the athletic wear company is hovering near a 12-year low and its turnaround is taking far longer than expected. Nike has the smallest weighting in the Dow, making up only 0.48% of the index.

GE Vernova is a candidate to split its stock as well

At just over $1,000 per share at the time of this writing, GE Vernova would need to issue a stock split of its own before being added to the Dow.

If Caterpillar issued a stock split and GE Vernova replaced Nike at its current price, the Dow's industrial sector weighting would increase even more, and GE Vernova would instantly become one of the most heavily weighted components alongside Goldman Sachs. The Dow typically adds stocks only if they are priced closer to the index's median weighting or have recently split their own shares, to avoid tilting the index's balance.

For example, Alphabet issued a 20-for-1 stock split in 2022 and was added to the Dow in June of this year. If GE Vernova issued a 4-for-1 split, it would be priced right around the median of the Dow components.

This hypergrowth industrial stock deserves a seat in the Dow

Given its industry-leading role in supplying industrial machinery, such as heavy-duty gas turbines, for AI data centers, GE Vernova stands out as a logical choice for adding another industrial component to the Dow.

Despite its massive run-up in recent years, GE Vernova fetches a surprisingly reasonable 30.8 price-to-earnings ratio because its earnings growth has kept up with its stock price appreciation. However, analyst consensus estimates have GE Vernova earning $30.64 in 2026 earnings per share (EPS) but just $24.48 in 2027 EPS.

Investors who believe we are still in the early innings of the AI infrastructure build-out may still want to buy GE Vernova, but it's worth noting that cyclical stocks can look cheap when their trailing earnings are in an expansion cycle, and then far more expensive as earnings compress during downturns. GE Vernova could pull back just as quickly as it ran up if there's a spending slowdown, making the stock ideally suited for risk-tolerant investors willing to endure volatility.

Should you buy stock in GE Vernova right now?

Before you buy stock in GE Vernova, consider this:

The Motley Fool Stock Advisor analyst team just identified what they believe are the 10 best stocks for investors to buy now… and GE Vernova wasn’t one of them. The 10 stocks that made the cut could produce monster returns in the coming years.

Consider when Netflix made this list on December 17, 2004... if you invested $1,000 at the time of our recommendation, you’d have $371,519!* Or when Nvidia made this list on April 15, 2005... if you invested $1,000 at the time of our recommendation, you’d have $1,281,302!*

Now, it’s worth noting Stock Advisor’s total average return is 892% β€” a market-crushing outperformance compared to 206% for the S&P 500. Don't miss the latest top 10 list, available with Stock Advisor, and join an investing community built by individual investors for individual investors.

See the 10 stocks Β»

*Stock Advisor returns as of July 24, 2026.

Daniel Foelber has positions in Nike. The Motley Fool has positions in and recommends Alphabet, Caterpillar, GE Aerospace, GE HealthCare Technologies, GE Vernova, Goldman Sachs Group, International Business Machines, and Nike. The Motley Fool recommends UnitedHealth Group. The Motley Fool has a disclosure policy.

☐ β˜† βœ‡ The Motley Fool

Meet the 9 Vanguard ETFs That Are Buying SpaceX Stock in Droves. Here's My Top Pick of the Bunch.

By: newsfeedback@fool.com (Daniel Foelber) β€”

Key Points

Space Exploration Technologies (NASDAQ: SPCX) had its initial public offering (IPO) on June 12 and was fast-tracked into the Nasdaq-100 on July 7. But SpaceX won't be added to the S&P 500 (SNPINDEX: ^GSPC) or to index funds and exchange-traded funds (ETFs) that track the S&P 500 until at least a year after its IPO. That means that SpaceX is still not a holding in Vanguard's largest ETF by net assets: the Vanguard S&P 500 ETF (NYSEMKT: VOO).

However, there are plenty of major Vanguard ETFs that don't use the S&P 500 as a benchmark. Here's how much SpaceX stock they are buying and what investors should expect their SpaceX positions to look like in the coming months.

Where to invest $1,000 right now? Our analyst team just revealed what they believe are the 10 best stocks to buy right now, when you join Stock Advisor. See the stocks Β»

The sun reflects off a satellite orbiting Earth, while a hurricane swirls below.

Image source: Getty Images.

$6.1 billion in SpaceX stock

The wait is over. Vanguard finally updated its ETF holdings as of June 30. Even though that period marks less than three weeks after SpaceX's IPO, several of Vanguard's largest ETFs were already gobbling up SpaceX.

After digging through Vanguard's 48 passively managed equity ETFs, these are the ones that bought SpaceX stock as of June 30 (to the best of my knowledge):

Vanguard ETF

Current % of Funds

SpaceX Ranking

Shares

Market Value1

Hypothetical Eventual Percentage of Funds2

Vanguard Communication Services ETF (NYSEMKT: VOX)

2.37%

13

632,077

$142 million

20.3%

Vanguard Extended Market ETF (NYSEMKT: VXF)

1.14%

1

6,775,494

$1.158 billion

0%

Vanguard Mega Cap Growth ETF (NYSEMKT: MGK)

0.48%

41

942,362

$161 million

4.1%

Vanguard Growth ETF (NYSEMKT: VUG)

0.29%

49

6,480,297

$1.107 billion

3.4%

Vanguard Russell 1000 Growth ETF (NASDAQ: VONG)

0.24%

51

757,638

$129 million

3%

Vanguard Large-Cap ETF (NYSEMKT: VV)

0.16%

110

689,533

$118 million

2%

Vanguard Total Stock Market ETF (NYSEMKT: VTI)

0.14%

110

18,738,438

$3.202 billion

1.7%

Vanguard Russell 1000 ETF (NASDAQ: VONE)

0.13%

120

87,520

$15 million

1.8%

Vanguard World Stock ETF (NYSEMKT: VT)

0.08%

196

441,613

$75 million

1.1%

Data source: Vanguard. 1. Market value as of June 30, 2026. 2. Hypothetical eventual percentage of funds based on Meta Platforms' weighting in each fund.

Investors can expect SpaceX's weighting in these ETFs to increase in line with the SpaceX shares available for trading on the Nasdaq -- known as the float. For the time being, SpaceX isn't weighted in these ETFs based on its market cap but rather on a float-adjusted weighting to account for the vast majority of SpaceX shares that are held by insiders and restricted from trading.

However, 20% of Early Release Eligible Shares will be unlocked on Aug. 6. A total of 55% of Early Release Eligible Shares could be unlocked before the end of October.

Investors can expect ETFs to gradually increase their SpaceX holdings as its float increases. Eventually, SpaceX will be weighted by its market cap rather than its float. With a market cap of $1.5 trillion at the time of this writing, SpaceX currently has roughly the same market cap as Meta Platforms.

The table's Hypothetical Eventual Percentage of Funds column uses Meta as a proxy for weighting SpaceX in each fund. It shows Meta's current weighting in each fund and, therefore, roughly what SpaceX would be weighted once it is based on market cap rather than float.

On a percentage basis, the Vanguard Communication Services ETF has the largest SpaceX position -- making it the ETF's 13th-largest holding. Surprisingly, SpaceX is the No. 1 largest holding in the Vanguard Extended Market ETF. But that ETF tracks the S&P Completion Index, which includes mid- and small-cap equities. SpaceX may temporarily appear in that index due to its float-adjusted market cap, but investors should expect its weighting in the Vanguard Extended Market ETF to be 0% before the end of the year.

As you can see in the table, SpaceX was added to Russell 1000 funds because SpaceX is in that index, which doesn't have the same admission standards as the S&P 500. And it's also on track to be a major holding in the Vanguard Growth ETF, one of Vanguard's largest ETFs by net assets; the Vanguard Mega Cap Growth ETF; and the Vanguard Total Stock Market ETF -- the second-largest Vanguard ETF by net assets, behind the Vanguard S&P 500 ETF. The Vanguard Total Stock Market ETF is so big that even a 0.14% position is worth over $3 billion -- giving the ETF roughly the same number of SpaceX shares as the other eight Vanguard ETFs combined.

The Vanguard World Stock ETF holds the smallest SpaceX weighting because it includes more than 10,000 stocks from developed and emerging markets. Even if SpaceX had Meta Platforms' weight in that ETF, it would still be a small position at just 1.1%.

An excellent ETF to buy and hold

There are plenty of ways to get exposure to SpaceX, such as buying the stock directly, selecting an ETF where SpaceX will soon become a top holding, like the Vanguard Communication Services ETF, low-cost growth ETFs, or general total U.S. or world stock market ETFs.

The dirt cheap 0.03% expense ratio and simplicity of the Vanguard Total Stock Market ETF make it my favorite buy of the bunch. The ETF is very similar to the Vanguard S&P 500 ETF, since the S&P 500 accounts for about 80% of the U.S. stock market. But I like the additional diversification that the Total Stock Market ETF provides.

The Total Stock Market ETF added SpaceX faster than an ETF that is tied to a rules-based index like the S&P 500. And it will probably add Anthropic and OpenAI within weeks of their IPOs.

All told, investors who want a smaller position in SpaceX may prefer the Vanguard Total Stock Market ETF over the growth of sector-specific funds.

Should you buy stock in Space Exploration Technologies right now?

Before you buy stock in Space Exploration Technologies, consider this:

The Motley Fool Stock Advisor analyst team just identified what they believe are the 10 best stocks for investors to buy now… and Space Exploration Technologies wasn’t one of them. The 10 stocks that made the cut could produce monster returns in the coming years.

Consider when Netflix made this list on December 17, 2004... if you invested $1,000 at the time of our recommendation, you’d have $369,577!* Or when Nvidia made this list on April 15, 2005... if you invested $1,000 at the time of our recommendation, you’d have $1,301,557!*

Now, it’s worth noting Stock Advisor’s total average return is 908% β€” a market-crushing outperformance compared to 208% for the S&P 500. Don't miss the latest top 10 list, available with Stock Advisor, and join an investing community built by individual investors for individual investors.

See the 10 stocks Β»

*Stock Advisor returns as of July 24, 2026.

Daniel Foelber has no position in any of the stocks mentioned. The Motley Fool has positions in and recommends Meta Platforms, Vanguard Growth ETF, and Vanguard S&P 500 ETF. The Motley Fool recommends Nasdaq. The Motley Fool has a disclosure policy.

☐ β˜† βœ‡ The Motley Fool

Meet the Only Vanguard ETF That Has a Higher SpaceX Weighting Than the QQQ Nasdaq-100 ETF

By: newsfeedback@fool.com (Daniel Foelber) β€”

Key Points

Space Exploration Technologies (NASDAQ: SPCX) officially joined the Nasdaq-100 on July 7. The megacap growth stock was fast-tracked into the index less than a month after its June 12 initial public offering.

However, the percentage of shares available for public trading -- known as the float -- is roughly 5% of SpaceX's market cap. That number will increase as shares are gradually unlocked beginning Aug. 6. Until then, SpaceX's Nasdaq-100 weighting is around four or five times its float rather than its market cap.

Where to invest $1,000 right now? Our analyst team just revealed what they believe are the 10 best stocks to buy right now, when you join Stock Advisor. See the stocks Β»

So instead of being over 4% of the Nasdaq-100 and Nasdaq-100-based exchange-traded funds (ETFs) like the Invesco QQQ Trust (NASDAQ: QQQ), SpaceX is 1.1% for the time being -- making it the 22nd largest holding in the ETF.

A satellite in space overlooking a cloudy Earth sky with stars on the horizon.

Image source: Getty Images.

Investment management firm Vanguard just updated its holdings across dozens of its ETFs. As of June 30, the data shows that multiple Vanguard ETFs bought SpaceX in June, including the Vanguard Total Stock Market ETF (NYSEMKT: VTI), the Vanguard Growth ETF (NYSEMKT: VUG), the Vanguard Mega Cap Growth ETF (NYSEMKT: MGK), and the Vanguard Communication Services ETF (NYSEMKT: VOX). But only one Vanguard ETF has a higher weighting in SpaceX than the Nasdaq-100.

SpaceX will anchor the Vanguard Communication Services ETF

Vanguard has low-cost ETFs for each of the 11 stock market sectors. In June, I correctly predicted that Vanguard would add SpaceX to its communication sector ETF rather than industrials or technology because most of SpaceX's revenue and near-term growth are driven by its Starlink network of low-earth orbit satellites and because SpaceX owns the social media platform X (formerly Twitter).

That prediction came true when Vanguard updated the holdings of its Communication Services ETF, and SpaceX already jumped to the 13th-largest holding at 2.4%. That's significantly higher than the less than 0.5% weighting in the three Vanguard ETFs mentioned earlier.

Investors can expect SpaceX's weighting in the communications sector to grow as more shares are unlocked and traded on the Nasdaq. When SpaceX is eventually weighted by market cap, it will likely rank as the third-largest holding behind Alphabet and Meta Platforms. But it could even be the second-largest holding if it overtakes Meta Platforms in market cap again.

Sector ETF concentration is a bonus

With a mere 0.09% expense ratio, the Vanguard Communication Services ETF is one of the best ETFs to buy for investors looking for a low-cost option that will make SpaceX a top holding. Whereas funds based on the Nasdaq-100 include stocks from all sectors, sector-based ETFs give added weight to industry leaders because there are fewer components. This structure allows Amazon and Tesla to dominate the consumer discretionary sector, ExxonMobil and Chevron to lead the energy sector, and so on.

SpaceX's entry into the communications sector puts it in the big three alongside Alphabet and Meta Platforms. Once SpaceX's lockup period fully ends in early December, investors can expect close to 60% of the ETF to be invested in these three stocks.

Should you buy stock in Vanguard World Fund - Vanguard Communication Services ETF right now?

Before you buy stock in Vanguard World Fund - Vanguard Communication Services ETF, consider this:

The Motley Fool Stock Advisor analyst team just identified what they believe are the 10 best stocks for investors to buy now… and Vanguard World Fund - Vanguard Communication Services ETF wasn’t one of them. The 10 stocks that made the cut could produce monster returns in the coming years.

Consider when Netflix made this list on December 17, 2004... if you invested $1,000 at the time of our recommendation, you’d have $369,577!* Or when Nvidia made this list on April 15, 2005... if you invested $1,000 at the time of our recommendation, you’d have $1,301,557!*

Now, it’s worth noting Stock Advisor’s total average return is 908% β€” a market-crushing outperformance compared to 208% for the S&P 500. Don't miss the latest top 10 list, available with Stock Advisor, and join an investing community built by individual investors for individual investors.

See the 10 stocks Β»

*Stock Advisor returns as of July 23, 2026.

Daniel Foelber has no position in any of the stocks mentioned. The Motley Fool has positions in and recommends Alphabet, Amazon, Chevron, Meta Platforms, Tesla, and Vanguard Growth ETF. The Motley Fool recommends Nasdaq. The Motley Fool has a disclosure policy.

☐ β˜† βœ‡ The Motley Fool

SpaceX Earnings Are Coming Aug. 4. Here's Why Aug. 6 Could Prove to Be the Real Stress Test With SPCX Down 47% From Its High.

By: newsfeedback@fool.com (Daniel Foelber) β€”

Key Points

  • SpaceX’s unique lockup period is partially dependent on the timeline of its Q2 and Q3 2026 earnings releases.

  • With the stock price beaten down, investors can expect 20% of early release eligible shares to be available for transfer on Aug. 6.

  • More shares will be unlocked in the coming months.

Space Exploration Technologies (NASDAQ: SPCX) has officially announced Aug. 4 as the date of its highly anticipated earnings release for the quarter ended June 30. The earnings release and earnings call with Wall Street analysts will provide an updated look at where SpaceX is and where the company could be headed.

Here's why investors should also pay close attention to Aug. 6, and what the date could mean for SpaceX stock.

Where to invest $1,000 right now? Our analyst team just revealed what they believe are the 10 best stocks to buy right now, when you join Stock Advisor. See the stocks Β»

A SpaceX rocket launching from Earth.

Image source: Getty Images.

Public markets have only gotten a taste of SpaceX

SpaceX went public on June 12, raising $75 billion by selling 555 million shares at $135 per share and then another $10.7 billion from underwriters exercising options to buy additional shares. But with SpaceX's market cap at $1.58 trillion at the time of this writing, that leaves the vast majority of shares owned by insiders through restricted stock units and early release eligible shares.

That means that the supply of shares potentially hitting public markets will be far higher than the shares currently available, which will test SpaceX's already beaten-down stock price.

At $119.85 as of market close on July 20, SpaceX is down 47% from its intraday high and 11.2% from its initial public offering (IPO) price.

Open the floodgates

In SpaceX's May 20 Form S-1 filing with the Securities and Exchange Commission, SpaceX outlines its unusual schedule for unlocking restricted shares at a far faster rate than the typical 180-day period for IPOs. The first wave of early release eligible shares will be made available for sale "on or after the second full trading day on Nasdaq immediately following the public release of our quarterly financial results for the quarter ended June 30, 2026." With the earnings call confirmed for Aug. 4 after market close at 4:30 p.m. ET, that makes Aug. 6 the first time since SpaceX's IPO when holders of early-release-eligible shares may choose to sell a portion of those shares on the Nasdaq.

An additional 10% of early release eligible shares may be transferred if SpaceX is above $175.50 per share for five of the 10 trading days leading up to and including Aug. 4. However, that is highly unlikely to happen considering that count down began on July 21, and SpaceX remains down over 30% from that price it needs to average over the next couple of weeks to trigger the extra release of shares.

Another 7% of shares will be unlocked on each of the following dates -- Aug. 31, Sept. 10, Sept. 25, Oct. 10, and Oct. 25. Another 28% of shares will be released two days after the quarter ended Sept. 30 earnings, before all shares are unlocked on Dec. 9.

A critical moment for SpaceX stock

SpaceX's earnings report, combined with more shares hitting public markets, will be the ultimate stress test for the growth stock. Especially if insiders decide to sell shares with SpaceX below its IPO price.

This is an incredibly exciting company for its technological prowess, lack of competition, and virtually infinite total addressable market. But I still think it's best if investors keep SpaceX on a watch list to see how the insider lock-up expiration unfolds, and for SpaceX to begin generating positive free cash flow so it doesn't have to continue relying on capital markets to raise money.

Should you buy stock in Space Exploration Technologies right now?

Before you buy stock in Space Exploration Technologies, consider this:

The Motley Fool Stock Advisor analyst team just identified what they believe are the 10 best stocks for investors to buy now… and Space Exploration Technologies wasn’t one of them. The 10 stocks that made the cut could produce monster returns in the coming years.

Consider when Netflix made this list on December 17, 2004... if you invested $1,000 at the time of our recommendation, you’d have $370,332!* Or when Nvidia made this list on April 15, 2005... if you invested $1,000 at the time of our recommendation, you’d have $1,272,280!*

Now, it’s worth noting Stock Advisor’s total average return is 904% β€” a market-crushing outperformance compared to 208% for the S&P 500. Don't miss the latest top 10 list, available with Stock Advisor, and join an investing community built by individual investors for individual investors.

See the 10 stocks Β»

*Stock Advisor returns as of July 22, 2026.

Daniel Foelber has no position in any of the stocks mentioned. The Motley Fool has no position in any of the stocks mentioned. The Motley Fool has a disclosure policy.
☐ β˜† βœ‡ The Motley Fool

SpaceX Hosts First Earnings Call Since Its IPO. Is SpaceX a Buy Ahead of the Aug. 4 Earnings Release?

By: newsfeedback@fool.com (Daniel Foelber) β€”

Key Points

After the market close on July 20, Space Exploration Technologies (NASDAQ: SPCX) said it will release second-quarter earnings on Aug. 4.

The report will coincide with SpaceX's first earnings call with analysts as a public company and comes at a pivotal time, with the stock hovering near its lowest point since its June 12 initial public offering (IPO). As of the market close on July 21, SpaceX shares are down 40% from its intraday high of $225.64 on June 16.

Missed Nvidia in 2009? This Rare Signal Is Flashing Again. In 2009, a "Double Down" signal flashed for a little-known chipmaker called Nvidia. For the first time in years, that same "Total Conviction" signal is flashing for a company 1/100th the size of Nvidia. Continue Β»

Here's what investors should look for when SpaceX reports and if the growth stock is a buy now.

Illustration in a wood carving style of a person looking through binoculars at the cosmos.

Image source: Getty Images.

Welcome to the public stage

Aug. 4 will be Elon Musk's first earnings call as chief executive officer of a company that isn't Tesla (NASDAQ: TSLA). Investors should tune in to see how the earnings call is conducted, whether its format differs from Tesla's, and whether it leans more on SpaceX's other executives than on Musk.

It would also be worth paying attention to how SpaceX releases supplemental materials, whether it includes useful information in its presentation decks and earnings release, or whether investors will need to dig for details in its quarterly 10-Q filing with the Securities and Exchange Commission (SEC).

SpaceX's Model 3 moment

Since 2023, SpaceX has been responsible for launching more than 80% of the world's mass put into orbit. The bulk of that mass has come from SpaceX's Starlink network of low earth orbit broadband and mobile satellites.

With 9,600 Starlink satellites in orbit as of March 31 and 10.3 million Starlink subscribers, Starlink is instrumental to SpaceX's revenue and free cash flow growth. SpaceX has a mix of consumer and enterprise solutions. As it has added more customers, its revenue per user has declined. So investors should tune in to SpaceX's plans to expand Starlink and whether its pricing model will change as it improves connectivity.

In its May 20 Form S-1 IPO filing with the SEC, SpaceX said it expects to begin deploying its next-generation Starlink V3 satellites on Starship launchers in the second half of 2026, and it is on schedule to do so. SpaceX planned to launch its 13th Starship test flight on July 16 but scrubbed it and rescheduled it for July 23. Part of the payload includes 20 Starlink V3 satellites.

Compared to V2 satellites, V3 will offer a 10-fold improvement in downlink capacity and a 22-fold increase in uplink capacity -- adding to Starlink's competitive advantages.

All told, Starlink could prove to be as important to SpaceX as the Model 3 was to Tesla. The Model 3 provided a high-volume electric vehicle at a competitive price, vaulting Tesla from a struggling company to a cash cow. Without Model 3, Tesla would have lacked the resources needed to expand its robotaxi fleet and the Optimus line of humanoid robots.

AI satellites

Scaling Starlink is a bold endeavor in and of itself. But SpaceX has far more ambitious plans, namely, deploying millions of artificial intelligence (AI) compute satellites in space.

SpaceX's February 2026 acquisition of xAI is instrumental in its AI compute constellation plans because it effectively gives SpaceX a major internal customer and a sandbox for testing satellite performance.

What's more, SpaceX, xAI, and Tesla are collaborating on the Terafab facility in Texas to mass-produce AI chips, enabling these companies to secure their own compute rather than relying on other suppliers. SpaceX is also building a factory of more than 11-million-square feet in Texas called Gigafactory, which will handle end-to-end production of AI satellites -- from solar panels to the AI compute modules.

These projects will be incredibly costly, take years to scale, and have no clear timeline for profitability. SpaceX's earnings call should provide investors with updates on these projects.

A potential merger with Tesla

With SpaceX now public, some folks are speculating that it's only a matter of time before Tesla and SpaceX attempt to merge. After all, SpaceX bought xAI even though there were several valid reasons Tesla could have bought it instead. Tesla is a major customer of xAI, with xAI playing a role in Tesla's robotics, automotive vehicles, and energy storage projects.

A merger between SpaceX and Tesla would make Terafab a unified project under one umbrella rather than a partnership. And Tesla may be able to assist SpaceX with its energy storage needs.

Investors will likely be looking for insight on the SpaceX earnings call about its considerations for a merger with Tesla or why it may downplay merger speculation. Even if SpaceX and Tesla shareholders were vote to approve a merger, it would still face intense regulatory scrutiny.

SpaceX has a lot to prove

Aug. 4 also is a critical day for SpaceX investors because it opens the door to a major share unlocking just two days later, letting early investors who were barred from selling after the IPO dispose of shares on public markets.

So far, SpaceX has been a tale of insatiable investor euphoria that briefly made it worth more than Amazon and Microsoft, only to have it fall as investors questioned its viability and path to profitability.

SpaceX has done an excellent job outlining a roadmap that features bold plans for AI compute satellites, lunar economies, colonies on Mars, and interplanetary travel. But SpaceX must fill the gaps in that roadmap before the stock becomes a reasonable buy for long-term investors.

Should you buy stock in Space Exploration Technologies right now?

Before you buy stock in Space Exploration Technologies, consider this:

The Motley Fool Stock Advisor analyst team just identified what they believe are the 10 best stocks for investors to buy now… and Space Exploration Technologies wasn’t one of them. The 10 stocks that made the cut could produce monster returns in the coming years.

Consider when Netflix made this list on December 17, 2004... if you invested $1,000 at the time of our recommendation, you’d have $364,562!* Or when Nvidia made this list on April 15, 2005... if you invested $1,000 at the time of our recommendation, you’d have $1,247,668!*

Now, it’s worth noting Stock Advisor’s total average return is 894% β€” a market-crushing outperformance compared to 207% for the S&P 500. Don't miss the latest top 10 list, available with Stock Advisor, and join an investing community built by individual investors for individual investors.

See the 10 stocks Β»

*Stock Advisor returns as of July 22, 2026.

Daniel Foelber has no position in any of the stocks mentioned. The Motley Fool has positions in and recommends Amazon, Microsoft, and Tesla. The Motley Fool has a disclosure policy.
☐ β˜† βœ‡ The Motley Fool

Micron's 30% Decline Is Dragging Down the iShares Semiconductor ETF (NASDAQ: SOXX). Here's a Low-Cost Vanguard ETF to Buy Instead.

By: newsfeedback@fool.com (Daniel Foelber) β€”

Key Points

Semiconductors have been one of the best-performing industries this year. The iShares Semiconductor ETF (NASDAQ: SOXX), which closely tracks the industry, is up a staggering 73.1% year-to-date (YTD) but is down over 20% from its June 22 all-time high.

Here's why semiconductor stocks are selling off, and why the Vanguard Information Technology ETF (NYSEMKT: VGT) is a better buy than the iShares Semiconductor ETF.

Where to invest $1,000 right now? Our analyst team just revealed what they believe are the 10 best stocks to buy right now, when you join Stock Advisor. See the stocks Β»

A building at dusk featuring the Micron logo.

Image source: Micron.

The memory chip bottleneck

The all-time high in the iShares Semiconductor ETF occurred when many memory chip stocks, including Micron Technology (NASDAQ: MU) and Sandisk, hit all-time highs. Those rallies have been fueled by surging earnings growth.

Micron's stock price is up 629% in the past year. To the company's credit, its earnings are also up 483% -- with analysts projecting more room to run.

MU Chart

MU data by YCharts

AI workflows require massive amounts of computing power from logic chips such as graphics processing units (GPUs), central processing units (CPUs), and custom application-specific integrated circuits (ASICs) such as Alphabet's Tensor Processing Units. But high-powered AI computing clusters won't perform at optimal levels without memory chips such as high-bandwidth memory, a form of dynamic random-access memory.

The memory shortage has given Micron and others incredible pricing power that has fueled margin expansion and an earnings surge. Micron CEO Sanjay Mehrotra said the following on Micron's June earnings call:

AI systems are powered by GPU, ASIC, and CPU designs from an increasingly broad set of suppliers. However, they all share one important characteristic -- AI system performance is architecturally dependent on memory subsystem performance and capacity. This has given rise to a more complex memory hierarchy that is providing greater differentiation opportunities for Micron than at any time in our history. It has also elevated the role of memory in the AI world to a strategic asset.

The rapid increase in memory chip stocks has pole-vaulted Micron to one of the largest holdings in the iShares Semiconductor ETF, with a 7.6% weighting. Semiconductor equipment makers Applied Materials, KLA Corp., Lam Research, and ASML collectively make up 17.3% of the ETF, with all four stocks more than doubling in the past year.

In sum, the iShares Semiconductor ETF is heavily weighted toward stocks that have recently surged. But concentration is a double-edged sword, as high allocations to hot stocks have accelerated the sell-off in the iShares Semiconductor ETF over the last month.

A better-structured growth stock ETF

The semiconductor industry has also been a driving force behind the sustained outperformance of the tech sector relative to the S&P 500 (SNPINDEX: ^GSPC) and the Nasdaq-100 in recent years. In fact, semiconductors, semiconductor materials, and semiconductor equipment now make up 46.4% of the Vanguard Tech ETF, an ultra-low-cost ETF that tracks the broader tech sector.

There are plenty of reasons to buy the Vanguard Tech ETF over the iShares Semiconductor ETF. For starters, it sports a lower expense ratio of just 0.09%, compared with 0.34% for the iShares Semiconductor ETF.

Second, the Vanguard Tech ETF provides investors with exposure to key tech stocks such as Apple and Microsoft that aren't in the iShares Semiconductor ETF. And although other industries, such as software and hardware, have been lagging somewhat as of late, they have provided the Vanguard Tech ETF with greater diversification than the iShares Semiconductor ETF.

If the memory bottleneck is solved and a balance between supply and demand is restored, margins will compress for memory chip companies like Micron. The value could shift to companies building and using AI tools, rather than the companies providing AI computing, memory, networking, and infrastructure. So long-term investors may prefer to get exposure to the entire tech sector rather than betting on sustained momentum from semiconductor companies alone.

The size of non-semiconductor stocks such as Apple and Microsoft helps balance out the weightings of Vanguard Tech ETF components. Whereas rapid run-ups in certain stocks can shift the iShares Semiconductor ETF's balance. For example, Intel now holds a 5.4% weighting in the iShares Semiconductor ETF -- ahead of Taiwan Semiconductor at 4.4% -- even though Intel's market cap is $477.7 billion, compared with $2.07 trillion for Taiwan Semiconductor.

A more balanced way to bet big on semiconductor stocks

Investors seeking maximum semiconductor exposure may prefer the iShares Semiconductor ETF over the Vanguard Information Technology ETF. But given nearly half of the Vanguard Tech ETF is in semiconductor stocks, it stands out as a better buy for investors looking for a more balanced growth stock alternative with lower fees.

It's worth noting that the Vanguard Tech ETF still has significantly larger exposure to the memory chip boom than the Nasdaq-100 or S&P 500. Micron, for example, now makes up 5% of the Vanguard Tech ETF, compared with 4.3% of the Nasdaq-100 and 1.4% of the S&P 500.

All told, the Vanguard Tech ETF is an excellent way to get heightened exposure to semiconductor stocks without diving in headfirst with a pure-play industry fund like the iShares Semiconductor ETF.

Should you buy stock in iShares Trust - iShares Semiconductor ETF right now?

Before you buy stock in iShares Trust - iShares Semiconductor ETF, consider this:

The Motley Fool Stock Advisor analyst team just identified what they believe are the 10 best stocks for investors to buy now… and iShares Trust - iShares Semiconductor ETF wasn’t one of them. The 10 stocks that made the cut could produce monster returns in the coming years.

Consider when Netflix made this list on December 17, 2004... if you invested $1,000 at the time of our recommendation, you’d have $371,842!* Or when Nvidia made this list on April 15, 2005... if you invested $1,000 at the time of our recommendation, you’d have $1,244,783!*

Now, it’s worth noting Stock Advisor’s total average return is 900% β€” a market-crushing outperformance compared to 207% for the S&P 500. Don't miss the latest top 10 list, available with Stock Advisor, and join an investing community built by individual investors for individual investors.

See the 10 stocks Β»

*Stock Advisor returns as of July 19, 2026.

Daniel Foelber has positions in ASML. The Motley Fool has positions in and recommends ASML, Alphabet, Apple, Applied Materials, Intel, KLA, Lam Research, Micron Technology, Microsoft, Taiwan Semiconductor Manufacturing, and iShares Trust-iShares Semiconductor ETF. The Motley Fool has a disclosure policy.
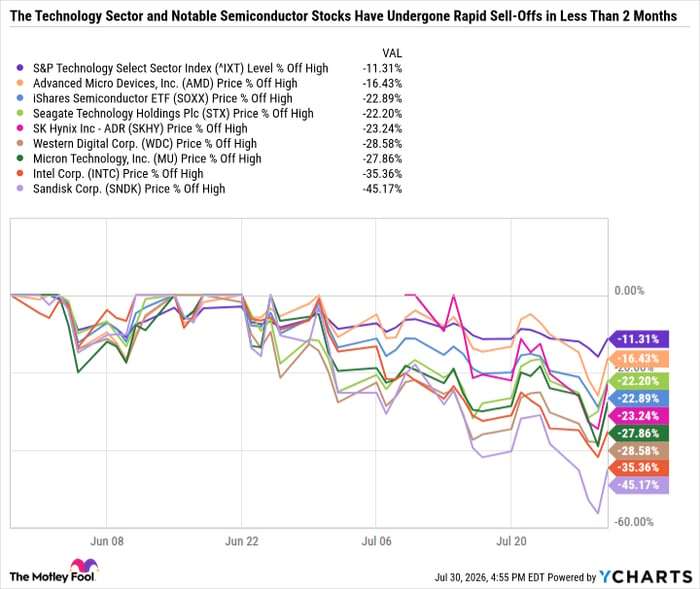
☐ β˜† βœ‡ The Motley Fool

Netflix's Post-Earnings Sell-Off Just Revealed Why It Was Bidding to Acquire Warner Bros. and Roku

By: newsfeedback@fool.com (Daniel Foelber) β€”

Key Points

  • The Netflix sell-off is intensifying after its second-quarter results and third-quarter guidance.

  • Netflix’s pursuit of content quality comes at a steep price.

  • Netflix’s valuation is at multiyear lows.

Netflix (NASDAQ: NFLX) was down 8.2% in after-hours trading on July 16 at 5:53 PM EDT -- falling to $68.23 per share as investors digested its second-quarter 2026 earnings and weak third-quarter guidance. The problem is abundantly clear -- most of Netflix's revenue growth is coming from price increases.

Netflix's third price increase in less than three years marked a 12.5% jump in U.S. ad-supported monthly pricing, an 11.1% boost in U.S. standard monthly pricing, and an 8% increase in U.S. premium monthly pricing. In its latest quarter, Netflix reported a 13.4% year-over-year increase in revenue and is guiding for a 11.7% year-over-year increase in third-quarter revenue. Which sounds good on paper, until you factor in the glaring reality that price increases are the majority of revenue growth.

Missed Nvidia in 2009? This Rare Signal Is Flashing Again. In 2009, a "Double Down" signal flashed for a little-known chipmaker called Nvidia. For the first time in years, that same "Total Conviction" signal is flashing for a company 1/100th the size of Nvidia. Continue Β»

Here's what the results mean for investors, how they help paint the picture of why Netflix pursued major acquisitions, and if the growth stock is a buy now.

The Netflix logo on top of a building.

Image source: Netflix.

Competition for capturing user screen time is intensifying

In February, Netflix declined to raise its offer to buy Warner Bros. Discovery, losing the bid to Paramount Skydance. Netflix was also in the hunt to buy Roku before being outbid by Fox Corp. in June.

The moves were somewhat alarming, given Netflix's history of organic growth through licensing and producing its own content. But investors have been concerned that Netflix's viewer engagement is under pressure from a slew of competitors in traditional media, streaming services, gaming, and user-generated content on platforms like Alphabet-owned YouTube.

At its core, Netflix's business model is to have subscription revenue exceed content costs. The more subscription revenue, the more demand for content. And as its global subscriber base has grown and Netflix has aggressively raised prices, there's more pressure for it to produce high-quality, engaging content.

In its July 16 shareholder letter, Netflix emphasized the importance of content quality:

We've used "engagement" as a shorthand for the value we deliver members. But, as we've developed an increasingly sophisticated understanding of how consumers ascribe value to our service, we know not all hours are equal. Time spent is just one aspect of strong engagement -- quality and variety also matter. The key is to improve across all of those dimensions: quality, variety, and quantity.

In practice, Netflix's definition of quality seems to revolve around proven content, such as Warner Bros. Discovery's intellectual property, including franchises like the DC and Harry Potter universes, Game of Thrones, Looney Tunes, and more. Proven content also includes Netflix's push into sports through the latest MLB Home Run Derby on July 13 and marquee NFL games like opening week, Thanksgiving Eve, Christmas Day, and week 18.

Two sides to the Netflix narrative

The glass-half-empty view of Netflix is that the company is desperately trying to buy content at premium prices to keep subscribers engaged and justify price increases. And that Netflix could eventually resemble a modern-day network with an emphasis on live-streamed events rather than pre-produced shows and movies. Netflix's quarter after quarter of slowing growth and dependence on price increases is fueling that narrative, which is why the stock is tanking.

However, the glass-half-full view on Netflix is that the company is simply bigger than it used to be and has the deep pockets to branch into new markets rather than relying heavily on its own content. To its credit, Netflix isn't willing to pay any price for content, as evidenced by its willingness to be outbid by much smaller companies in Paramount-Skydance and Fox. And Netflix has collected a sizable consolation prize in the process through its $2.8 billion termination fee from Warner Bros. Discovery.

Netflix's latest results are disappointing, and it was a mistake in hindsight to raise prices so much in just a few years. But the stock's decline reflects that pessimism -- with Netflix sporting its lowest valuation in years -- trading at just 19.1 times 2026 full-year earnings estimates as of its after-hours price at the time of this writing.

Netflix is no stranger to taking risks

Netflix has always been a risk-taking company, from disrupting Blockbuster through mail-order DVDs to pioneering the modern streaming platform to producing award-winning live-action and animated series and movies. Each evolution has been riddled with bumps along the way and periods of investor loss of confidence. And right now, Netflix is enduring another such period as investors question the price it is willing to pay for quality entertainment and if it's making the right choices with sports and pushing into daytime and mobile device viewing.

So while it's understandable if some investors want to wait for the dust to settle and for Netflix to regain its footing, folks who are confident in Netflix's long-term strategy are getting an impeccable opportunity to buy the streaming service stock at a dirt-cheap price.

Should you buy stock in Netflix right now?

Before you buy stock in Netflix, consider this:

The Motley Fool Stock Advisor analyst team just identified what they believe are the 10 best stocks for investors to buy now… and Netflix wasn’t one of them. The 10 stocks that made the cut could produce monster returns in the coming years.

Consider when Netflix made this list on December 17, 2004... if you invested $1,000 at the time of our recommendation, you’d have $371,842!* Or when Nvidia made this list on April 15, 2005... if you invested $1,000 at the time of our recommendation, you’d have $1,244,783!*

Now, it’s worth noting Stock Advisor’s total average return is 900% β€” a market-crushing outperformance compared to 207% for the S&P 500. Don't miss the latest top 10 list, available with Stock Advisor, and join an investing community built by individual investors for individual investors.

See the 10 stocks Β»

*Stock Advisor returns as of July 19, 2026.

Daniel Foelber has positions in Netflix. The Motley Fool has positions in and recommends Alphabet, Netflix, Roku, and Warner Bros. Discovery. The Motley Fool has a disclosure policy.

☐ β˜† βœ‡ The Motley Fool

Conagra Brands Slashes Its 10% Dividend Yield in Half Just 1 Month After Getting Kicked Out of the S&P 500. Here's Why the Stock Isn't Tanking.

By: newsfeedback@fool.com (Daniel Foelber) β€”

Key Points

Conagra Brands (NYSE: CAG) reported fourth-quarter and full-year fiscal 2026 earnings on July 15. Newly appointed CEO John Brase, who took the helm on June 1, wasted no time announcing a 50% cut to the dividend, reducing the quarterly payout from $0.35 per share to $0.175, or $0.70 per year. The dividend cut will reduce Conagra's yield from 10% to 5%, which is still high-yield territory and significantly higher than the S&P 500's dividend yield of 1%.

With Conagra stock down more than 50% in the last two years and its market cap falling to $6.7 billion, Conagra was kicked out of the S&P 500 on June 29.

Missed Nvidia in 2009? This Rare Signal Is Flashing Again. In 2009, a "Double Down" signal flashed for a little-known chipmaker called Nvidia. For the first time in years, that same "Total Conviction" signal is flashing for a company 1/100th the size of Nvidia. Continue Β»

Despite the massive dividend cut, Conagra Brands fell just 0.4% on July 15. Here's why the dividend cut could signal the right move for long-term investors. Is the value stock a good buy now?

A person in a kitchen decides between eating a doughnut and broccoli.

Image source: Getty Images.

The good and the bad from Conagra's results

Conagra reported a 2.9% decrease in net sales for fiscal 2026 and a 0.4% decline in organic net sales. The company is guiding for a 1% to 3% decline in fiscal 2027 organic net sales compared to fiscal 2026 as the industrywide slowdown drags on.

Conagra took a $2 billion goodwill and brand impairment charge in its latest quarter, which it attributed to a sustained decline in its share price and market capitalization. The impairment charge led to a hefty $3.37 in negative earnings per share (EPS). But excluding that charge, Conagra earned $0.47 in EPS and is guiding for adjusted fiscal 2027 EPS of $1.40 to $1.50 and adjusted operating margins of 10% to 10.5%.

While impairment charges affect the income statement and earnings, they don't affect cash inflows and outflows. In fact, Conagra raked in $979 million in free cash flow (FCF) in fiscal year 2026, which was less than the $1.3 billion from the prior fiscal year but was still enough to cover $670 million in dividends. With dividend expense cut in half and growth basically stalling, Conagra should have more cash to work with in fiscal 2027 to try to turn its business around.

Conagra exited fiscal 2026 with $7.1 billion in net debt, a 11.9% reduction from the prior year, but still a significant amount of debt for a company of its size. With more FCF to work with, Conagra should be able to reduce its leverage further in fiscal 2027.

A dividend cut was the right move

While no investor wants to see their quarterly dividend checks shrink, the trade-off is worth it if the underlying business improves. After all, a dividend is only as reliable as the company paying it. And if the dividend is soaking up much-needed cash or adding to the company's debt, it's unstable.

If you had invested $1,000 in Conagra stock 10 years ago, you'd have $554 today -- even when factoring in dividends. You can think of collecting high-yield dividends from a struggling company like plugging holes in a sinking ship. It would be far more useful to fix the underlying problem causing the ship to sink than to appease shareholders with a short-term solution like a high dividend.

However, the challenge with Conagra is that extra cash alone won't solve its problems. The company doesn't have an exciting new business idea with a good chance of generating a high return on capital. Rather, it has a portfolio anchored in frozen foods, snacks, treats, and processed foods.

Conagra has made a concerted effort to fine-tune its healthier brands by reducing its product count, removing artificial colors, and offering more nutritious versions of some products. But there's no denying Conagra is operating in the most challenging part of the food industry -- which is North American processed foods.

For context, PepsiCo (NASDAQ: PEP) is hovering around a multiyear low because its North American snack business (PepsiCo owns Frito-Lay) is dragging down what has otherwise been a solid performance from its North American beverage portfolio and excellent international results. Conagra doesn't benefit from diversification, as the vast majority of its sales come from North America.

Conagra is dirt cheap for good reasons

Even after its dividend cut, Conagra will still yield around 5%. Its FCF should be more than enough to cover its dividend. And the stock trades at just 9.7 times the midpoint of its adjusted earnings forecast. But Conagra has a lot of debt. And the company's pivot toward healthier options has yet to translate to meaningful results. So investors should consider the consumer staples stock only if they believe the company's portfolio of brands is strong enough to adapt to changing consumer preferences. If that happens, Conagra could look dirt cheap in hindsight. But a safer bet is to go with a stock like Pepsi that isn't solely dependent on the North American packaged food industry.

Like Conagra, Pepsi's valuation has compressed down to multiyear lows. Pepsi trades at just 15.8 times forward earnings, has a solid balance sheet, yields 4.4%, and has 54 consecutive years of increasing its dividend -- making it a Dividend King (a company that has raised its dividend for 50 or more consecutive years).

So while investors could reach all the way to the bottom of the bargain bin and scoop up shares of Conagra, a far less risky way to bet on a recovery in the North American packaged food industry is to go with Pepsi.

Should you buy stock in Conagra Brands right now?

Before you buy stock in Conagra Brands, consider this:

The Motley Fool Stock Advisor analyst team just identified what they believe are the 10 best stocks for investors to buy now… and Conagra Brands wasn’t one of them. The 10 stocks that made the cut could produce monster returns in the coming years.

Consider when Netflix made this list on December 17, 2004... if you invested $1,000 at the time of our recommendation, you’d have $371,842!* Or when Nvidia made this list on April 15, 2005... if you invested $1,000 at the time of our recommendation, you’d have $1,244,783!*

Now, it’s worth noting Stock Advisor’s total average return is 900% β€” a market-crushing outperformance compared to 207% for the S&P 500. Don't miss the latest top 10 list, available with Stock Advisor, and join an investing community built by individual investors for individual investors.

See the 10 stocks Β»

*Stock Advisor returns as of July 19, 2026.

Daniel Foelber has no position in any of the stocks mentioned. The Motley Fool has no position in any of the stocks mentioned. The Motley Fool has a disclosure policy.

☐ β˜† βœ‡ The Motley Fool

Caterpillar (NYSE: CAT) Now Makes Up 11% of the Dow. Could a Stock Split Come Before Year-End?

By: newsfeedback@fool.com (Daniel Foelber) β€”

Key Points

  • The stock's rapid run-up has given it an outsize weighting in the Dow.

  • Caterpillar and Goldman Sachs are by far the heaviest-weighted Dow components.

  • The company may want to wait until after the next cyclical slowdown to issue a stock split.

Caterpillar (NYSE: CAT) is up 265% in the last three years, largely thanks to the artificial intelligence (AI) boom. Its earth-moving equipment is being used for AI data center construction. Caterpillar also has a massive mining business that is benefiting from resource demand.

Perhaps most importantly, Caterpillar's Power & Energy segment is perfectly positioned to capitalize on surging power generation demand as AI data centers look to go behind the meter by producing their own electricity and avoid lengthy interconnection delays associated with grid power. With the AI energy bottleneck intensifying and hyperscalers continuing to pour record capital expenditures into AI, demand for Caterpillar's products should continue to outpace supply for the foreseeable future.

Missed Nvidia in 2009? This Rare Signal Is Flashing Again. In 2009, a "Double Down" signal flashed for a little-known chipmaker called Nvidia. For the first time in years, that same "Total Conviction" signal is flashing for a company 1/100th the size of Nvidia. Continue Β»

Now, with Caterpillar's stock price knocking on the door of $1,000 per share, some investors may be wondering if the industrial giant could issue a stock split -- especially with Caterpillar now making up a staggering 10.6% of the Dow Jones Industrial Average.

Here's why a stock split could be on deck, and the biggest obstacle standing in its way.
The Cat logo on Caterpillar earth-moving equipment.

Image source: Getty Images.

There's an even better stock split candidate than Caterpillar

Because of its price-weighted nature, stock splits have a major impact on the Dow. Amazon and Alphabet issued stock splits in 2022, which brought their stock prices closer to the median of the Dow and paved the way for their entry into the index. Similarly, stocks that run up in price and don't split can quickly tilt the index out of balance.

Caterpillar's surging stock price has propelled it to the second-highest-weighted company in the Dow behind Goldman Sachs. Combined, both stocks make up 23.5% of the Dow. In contrast, the two largest stocks in the S&P 500 make up 14.4% of the index.

But even with Caterpillar's massive weighting, the industrial sector only makes up 17.3% of the index compared to 28.6% for financials. So, despite what the name implies, the Dow isn't the industrially focused index it used to be.

Therefore, there's a much stronger case for Goldman Sachs to issue a stock split and reduce its individual and sector weightings. What's more, Meta Platforms has a compelling case for inclusion in the Dow, given its consistently high free cash flow, industry-leading position, and recently implemented dividend. Goldman Sachs splitting its stock would provide the catalyst needed to add Meta to the index, most likely replacing Nike.

The Dow can rebalance naturally

The Dow has gone through many periods when stocks temporarily accounted for a large share of the index, only for market cycles to even out the weights over time.

In 2019, Boeing made up over 11% of the Dow, driven by a rapid price surge. But the COVID-19 pandemic, along with other issues, has made Boeing a major laggard since. And without even issuing a stock split, Boeing's underperformance, paired with outperformance by other components and index shake-ups, has pushed Boeing down to just 2.5% of the Dow.

That's not to say that Caterpillar is destined for the same fate, but it is a cyclical company. So it wouldn't be surprising if Caterpillar waited to see how the AI infrastructure market evolves instead of rushing to issue a split.

Should you buy stock in Caterpillar right now?

Before you buy stock in Caterpillar, consider this:

The Motley Fool Stock Advisor analyst team just identified what they believe are the 10 best stocks for investors to buy now… and Caterpillar wasn’t one of them. The 10 stocks that made the cut could produce monster returns in the coming years.

Consider when Netflix made this list on December 17, 2004... if you invested $1,000 at the time of our recommendation, you’d have $371,842!* Or when Nvidia made this list on April 15, 2005... if you invested $1,000 at the time of our recommendation, you’d have $1,244,783!*

Now, it’s worth noting Stock Advisor’s total average return is 900% β€” a market-crushing outperformance compared to 207% for the S&P 500. Don't miss the latest top 10 list, available with Stock Advisor, and join an investing community built by individual investors for individual investors.

See the 10 stocks Β»

*Stock Advisor returns as of July 18, 2026.

Daniel Foelber has positions in Nike. The Motley Fool has positions in and recommends Alphabet, Amazon, Boeing, Caterpillar, Goldman Sachs Group, Meta Platforms, and Nike. The Motley Fool has a disclosure policy.

☐ β˜† βœ‡ The Motley Fool

Prediction: The Most Important Stock in the Dow Jones Will Issue a 4-for-1 Stock Split Before the End of 2026

By: newsfeedback@fool.com (Daniel Foelber) β€”

Key Points

  • Rising stock prices and a lack of stock splits have combined to make financials a disproportionately large share of the Dow.

  • A 4-for-1 stock split brings Goldman Sachs closer to the median Dow stock price.

  • Even with a Goldman Sachs stock split, financials will still be the Dow's largest sector weight.

The 130-year-old Dow Jones Industrial Average (DJINDICES: ^DJI) is one of the oldest and most iconic stock market indexes. And with just 30 components, it is far more selective than the S&P 500 or the thousands of companies listed on the Nasdaq Composite.

And while the Dow is getting more tech-focused -- most notably with its addition of Alphabet in June -- no component holds more weight than Goldman Sachs (NYSE: GS).

Missed Nvidia in 2009? This Rare Signal Is Flashing Again. In 2009, a "Double Down" signal flashed for a little-known chipmaker called Nvidia. For the first time in years, that same "Total Conviction" signal is flashing for a company 1/100th the size of Nvidia. Continue Β»

Here's why Goldman Sachs is so large that it can single-handedly move the index, and why a stock split could be in the cards before the end of the year.

An investor reading a newspaper on Wall Street.

Image source: Getty Images.

A Goldman Sachs stock split is coming

The Dow is a price-weighted index. So, companies are weighted by their stock prices rather than by market cap. Modern market mechanics make it easy to weight an index like the S&P 500 and Nasdaq in real time using market cap. But back in 1896, when Charles Dow published the index, it was more convenient to simply add up the stock prices of the components and divide by the number of components to get the average.

Goldman Sachs has never issued a stock split since going public in 1999. But the stock has been on an absolute tear -- tripling over the last five years and rising 9% on July 14 to an all-time high closing price of $1,140 per share.

Goldman Sachs is the only Dow stock trading above $1,000 per share and accounts for 12.9% of the index. For context, the median-priced Dow stock is closer to $250 per share.

Goldman Sachs' high share price is reason alone for it to issue a 4-for-1 stock split. But what makes the argument even more compelling is that the financial sector accounts for such a large share of the Dow.

The financial stocks in the Dow are all within striking distance of all-time highs, and none have issued stock splits for over a decade.

GS Chart

GS data by YCharts.

Goldman Sachs, Visa, American Express, JPMorgan Chase, and Travelers Companies are all top-10 components in the Dow and make up a combined 28.6% of the index -- by far the most of any sector. For context, financials make up just 11.8% of the S&P 500.

Even if Goldman Sachs issued a 4-for-1 stock split, financials would still be highest weighted sector in the Dow.

Goldman Sachs exposes a glaring flaw in the Dow

Even if you're not interested in investing in Goldman Sachs directly, its high share price and inclusion in the Dow illustrate just how influential a single stock can be on the storied index.

These market dynamics are worth paying attention to, as an up day in the Dow under its current structure could just mean Goldman Sachs and the financial sector are going up, rather than the broader market.

Until Goldman Sachs issues a stock split or the financial sector's weighting declines, investors are better off using the S&P 500 as a benchmark because it better reflects the most valuable U.S. companies.

Should you buy stock in Goldman Sachs Group right now?

Before you buy stock in Goldman Sachs Group, consider this:

The Motley Fool Stock Advisor analyst team just identified what they believe are the 10 best stocks for investors to buy now… and Goldman Sachs Group wasn’t one of them. The 10 stocks that made the cut could produce monster returns in the coming years.

Consider when Netflix made this list on December 17, 2004... if you invested $1,000 at the time of our recommendation, you’d have $400,964!* Or when Nvidia made this list on April 15, 2005... if you invested $1,000 at the time of our recommendation, you’d have $1,272,955!*

Now, it’s worth noting Stock Advisor’s total average return is 930% β€” a market-crushing outperformance compared to 210% for the S&P 500. Don't miss the latest top 10 list, available with Stock Advisor, and join an investing community built by individual investors for individual investors.

See the 10 stocks Β»

*Stock Advisor returns as of July 18, 2026.

JPMorgan Chase is an advertising partner of Motley Fool Money. American Express is an advertising partner of Motley Fool Money. Daniel Foelber has positions in American Express. The Motley Fool has positions in and recommends Alphabet, American Express, Goldman Sachs Group, JPMorgan Chase, and Visa. The Motley Fool has a disclosure policy.

☐ β˜† βœ‡ The Motley Fool

ASML Stock: Next Stop $3,000?

By: newsfeedback@fool.com (Daniel Foelber) β€”

Key Points

  • The chip equipment maker is progressing on its 2030 goals far faster than expected.

  • Strong customer commitments give ASML the green light to increase production capacity.

  • ASML's shares command a premium valuation right now, but it is well deserved.

ASML Holding (NASDAQ: ASML) reported another beat-and-raise quarter, blowing expectations out of the water with second-quarter 2026 net sales of 9.3 billion euros ($10.6 billion), 54% gross margin, and net income of 2.9 billion euros ($3.3 billion). When ASML reported first-quarter results in April, it expected second-quarter net sales of 8.4 billion to 9 billion euros ($9.6 billion to $10.3 billion) and gross margin of 51% to 52%.

It gets even better. When ASML reported 2025 year-end results in January, it projected full-year 2026 net sales of 34 billion to 39 billion euros ($38.8 billion to $44.6 billion) and a gross margin of 51% to 53%. Now, ASML is forecasting 43 billion to 45 billion euros ($49.1 billion to $51.4 billion) in 2026 net sales and a gross margin of 54% to 56%.

Missed Nvidia in 2009? This Rare Signal Is Flashing Again. In 2009, a "Double Down" signal flashed for a little-known chipmaker called Nvidia. For the first time in years, that same "Total Conviction" signal is flashing for a company 1/100th the size of Nvidia. Continue Β»

Here's how the upbeat guidance fits into ASML's investment thesis, and why the artificial intelligence (AI) semiconductor stock has room to run above $3,000 per share and join the $1 trillion club.

An ASML machine is being unloaded from an airplane.

Image source: ASML.

ASML has a track record of underpromising and overdelivering

Given management's notoriously cautious tone, raising guidance for the second consecutive quarter is particularly notable.

Just one year ago, when ASML reported second-quarter 2025 results, the stock tanked because management said it couldn't confirm it would grow in 2025 because of macroeconomic and geopolitical uncertainty. After all, the report came amid trade tensions between the U.S. and China. As a Dutch company, ASML is highly vulnerable to U.S. trade policy.

The market mistook ASML's reserved rhetoric for weakness when, in reality, management was simply communicating risks to investors. Those risks were overblown. ASML has continued to deliver even better growth than expected, and the stock has more than doubled over the past year.

The AI build-out is just getting started

ASML's latest outlook is particularly encouraging, given management's aversion to overpromising.

Based on stronger-than-expected order intake, ASML plans to add 30% to its 2026 low numerical aperture (Low-NA) capacity of around 65 units in 2027, and another 30% increase in 2028. It also plans a 30% increase in deep ultraviolet (DUV) immersion capacity to around 130 units in 2027 and another 30% increase in capacity for 2028 -- all while continuing to invest in its high numerical aperture (High-NA) extreme ultraviolet (EUV) systems for next-generation AI chips.

ASML is the world's leading manufacturer of semiconductor equipment for the lithography step of chip manufacturing, which involves printing designs on to silicon wafers. The bulk of ASML's sales is still for DUV machines and servicing existing equipment. But ASML is perfectly positioned for the next upgrade cycle as fabs invest in new equipment, such as Low-NA and High-NA EUV systems. ASML sits at the top of the value chain, selling its equipment to chip manufacturers including Taiwan Semiconductor Manufacturing, Samsung Electronics, and Intel. So ASML's decision to increase production is a vote of confidence in AI-driven chip demand.

The simplest reason to buy and hold ASML is that its systems are needed to produce both logic chips -- graphics processing units, central processing units, custom AI application-specific integrated circuits -- and memory chips, such as high-bandwidth memory, dynamic random-access memory, and AI NAND (flash) chips. This advantage makes ASML perfectly positioned to benefit from increased AI chip innovation and production, regardless of whether the bottlenecks stem from logic chips or the current memory chip shortage.

ASML is growing into its premium valuation

In its November 2024 investor day presentation, ASML said it had the opportunity to reach 2030 annual sales of 44 billion to 60 billion euros ($50.3 billion to $68.5 billion) on gross margin between 56% and 60%. The gross margin figures are higher because higher-margin EUV systems account for a larger share of sales.

But ASML's updated 2026 guidance of 43 billion to 45 billion euros in sales means it's on track to hit the low end of its 2030 net sales and gross margin guidance this year. Compared with 32.7 billion euros ($37.4 billion) in 2025 net sales and 52.8% gross margin, ASML is poised to grow revenue by a staggering 34.6% year over year while expanding margin. So while I initially predicted that ASML would join the $1 trillion club by 2030, I could see it reaching that milestone and surpassing $3,000 per share sooner than expected.

That said, there's no denying ASML is priced for perfection at 48.5 times forward earnings. And the stock would probably tank if its growth were to slow. So investors should consider buying ASML only if they believe in the long-term growth of AI adoption and innovation, which would support the build-out of more advanced AI chip fabs, and, in turn, ASML's High-NA machines.

Should you buy stock in ASML right now?

Before you buy stock in ASML, consider this:

The Motley Fool Stock Advisor analyst team just identified what they believe are the 10 best stocks for investors to buy now… and ASML wasn’t one of them. The 10 stocks that made the cut could produce monster returns in the coming years.

Consider when Netflix made this list on December 17, 2004... if you invested $1,000 at the time of our recommendation, you’d have $397,351!* Or when Nvidia made this list on April 15, 2005... if you invested $1,000 at the time of our recommendation, you’d have $1,304,257!*

Now, it’s worth noting Stock Advisor’s total average return is 934% β€” a market-crushing outperformance compared to 210% for the S&P 500. Don't miss the latest top 10 list, available with Stock Advisor, and join an investing community built by individual investors for individual investors.

See the 10 stocks Β»

*Stock Advisor returns as of July 17, 2026.

Daniel Foelber has positions in ASML. The Motley Fool has positions in and recommends ASML, Intel, and Taiwan Semiconductor Manufacturing. The Motley Fool has a disclosure policy.

☐ β˜† βœ‡ The Motley Fool

After a Hot Start to the Year, the Schwab U.S. Dividend Equity ETF (SCHD) Has Gone Practically Nowhere for 5 Months. Is It a Buying Opportunity for Value Investors?

By: newsfeedback@fool.com (Daniel Foelber) β€”

Key Points

  • The Schwab U.S. Dividend Equity ETF has been underperforming the growth-stock-driven S&P 500 in recent months.

  • The S&P 500’s yield is now just 1% because growth stocks make up so much of the index.

  • Unlike covered-call ETFs, the Schwab U.S. Dividend Equity ETF offers a high yield without capping upside potential.

With just under $100 billion in net assets and a 3.3% yield, the Schwab U.S. Dividend Equity ETF (NYSEMKT: SCHD) is an ultrapopular exchange-traded fund (ETF) for generating passive income. The fund is crushing the S&P 500 index (SNPINDEX: ^GSPC) year to date -- up 18.1%, compared to 10.7% for the index. But the bulk of those gains came in the first six weeks of the year as investors gravitated toward value stocks.

Over the last five months, the Schwab U.S. Dividend Equity ETF is only up 3.4%, while the S&P 500 is up 10.9% -- driven by massive gains in megacap tech stocks.

Where to invest $1,000 right now? Our analyst team just revealed what they believe are the 10 best stocks to buy right now, when you join Stock Advisor. See the stocks Β»

Here's why the Schwab U.S. Dividend Equity ETF has stalled out. Let's determine whether it's a buying opportunity for patient investors.

A cartoon piggy bank looks startled as it teeters atop a tall stack of coins.

Image source: Getty Images.

An ETF built around value-focused sectors

The Schwab U.S. Dividend Equity ETF is intended to provide investors with a steady stream of passive income, by investing primarily in industry-leading, large-cap, dividend-paying value stocks.

Unlike the S&P 500, which is heavily weighted toward growth-focused sectors like technology and communications, a whopping 55.1% of the Schwab U.S. Dividend Equity ETF is invested in consumer staples, healthcare, and energy, while less than 20% is in tech and communications. For context, consumer staples, healthcare, and energy make up 16.5% of the S&P 500, while tech and communications account for 47.3%.

Growth-focused sectors had a slow start to the year as investors questioned record capital expenditures on artificial intelligence (AI). But while many of the largest tech stocks by market cap remain in large drawdowns from their all-time highs, the massive boom in semiconductor stocks -- especially memory-chip stocks -- has propelled the S&P 500 to new highs. The iShares Semiconductor ETF, which tracks the industry, has nearly doubled year to date -- up 93%, compared to 29% for the tech sector. And the semiconductor industry alone now makes up roughly 43.5% of the tech sector.

In sum, semiconductor stocks are providing market-moving gains to the major indexes. The Schwab U.S. Dividend Equity ETF holds two semiconductor stocks: Texas Instruments (4% weighting) and Qualcomm (3.1% weighting). But overall, investors should expect the ETF to lag the S&P 500 when growth-focused sectors are fueling market gains.

Generating passive income from a portfolio of stocks

While some investors focus exclusively on total returns -- capital gains plus dividends -- others may be looking to supplement retirement income by targeting dividend-paying value stocks, many of which are less volatile than the S&P 500. The Schwab U.S. Dividend Equity ETF is a good buy for investors who value passive income as a core element of an investment thesis. The fund's quarterly dividend payments allow investors to book returns without selling shares.

Because it invests in a basket of stocks, the ETF doesn't cap upside potential. In contrast, covered-call ETFs like the JPMorgan Equity Premium Income ETF (NYSEMKT: JEPI) and the JPMorgan Nasdaq Equity Premium Income ETF (NASDAQ: JEPQ) achieve their high yields by selling calls on the underlying indexes they track (the S&P 500 for the former, and the Nasdaq-100 for the latter).

Over the last decade, the Schwab U.S. Dividend ETF has produced a total return of 222%, compared to 319% for the S&P 500. Despite its high yield, capital gains have historically been a core driver of the Schwab ETF's overall performance rather than dividends. This dynamic starkly contrasts with purely income-focused covered-call ETFs. And in the process, the Schwab U.S. Dividend ETF has been generally less volatile than the S&P 500 -- a good trade-off for investors focused on capital preservation rather than purely on capital appreciation.

A high-yield ETF that can anchor a risk-averse portfolio

The Schwab U.S. Dividend ETF checks all the boxes for a high-yield dividend fund to buy and hold. No single stock accounts for more than 4.5% of the ETF, ensuring that it's well-diversified. And with a mere 0.06% expense ratio (just $6 for every $10,000 invested), returns aren't weighed down by high fees.

The ETF's current yield of 3.3% is more than triple the S&P 500's 1% -- as the modern-day S&P 500 resembles a growth index that's far less focused on dividend yield than it used to be.

Add it all up, and the Schwab U.S. Dividend ETF is a perfect fit for investors looking to participate in the stock market while generating reliable passive income, without capping their upside potential through a covered-call ETF.

Should you buy stock in Schwab U.S. Dividend Equity ETF right now?

Before you buy stock in Schwab U.S. Dividend Equity ETF, consider this:

The Motley Fool Stock Advisor analyst team just identified what they believe are the 10 best stocks for investors to buy now… and Schwab U.S. Dividend Equity ETF wasn’t one of them. The 10 stocks that made the cut could produce monster returns in the coming years.

Consider when Netflix made this list on December 17, 2004... if you invested $1,000 at the time of our recommendation, you’d have $395,679!* Or when Nvidia made this list on April 15, 2005... if you invested $1,000 at the time of our recommendation, you’d have $1,294,805!*

Now, it’s worth noting Stock Advisor’s total average return is 929% β€” a market-crushing outperformance compared to 211% for the S&P 500. Don't miss the latest top 10 list, available with Stock Advisor, and join an investing community built by individual investors for individual investors.

See the 10 stocks Β»

*Stock Advisor returns as of July 14, 2026.

Charles Schwab is an advertising partner of Motley Fool Money. JPMorgan Chase is an advertising partner of Motley Fool Money. Daniel Foelber has positions in JPMorgan Equity Premium Income ETF, JPMorgan Nasdaq Equity Premium Income ETF, and Schwab U.S. Dividend Equity ETF. The Motley Fool has positions in and recommends JPMorgan Chase, Qualcomm, Texas Instruments, and iShares Trust-iShares Semiconductor ETF. The Motley Fool recommends Charles Schwab and recommends the following options: short September 2026 $95 calls on Charles Schwab. The Motley Fool has a disclosure policy.

☐ β˜† βœ‡ The Motley Fool

Coke Is Trading at Its Steepest Premium to Pepsi in Years. History Says This Is What Happens Next.

By: newsfeedback@fool.com (Daniel Foelber) β€”

Key Points

  • Coke and Pepsi are supporting their growing dividends with free cash flow.

  • Pepsi’s gigantic snack business is in the crosshairs of declining demand for packaged foods and snacks.

  • Pepsi’s yield is higher than Coke’s, and it sports a far cheaper valuation.

Every day, people around the world choose between Coke and Pepsi to quench their thirst for soda. Similarly, income investors may find themselves deciding between investing their hard-earned savings in Coca-Cola (NYSE: KO) or PepsiCo (NASDAQ: PEP).

Both stocks have historically fetched premium valuations thanks to their industry leadership, diverse product portfolios, and ultrareliable dividends. But Coca-Cola is crushing Pepsi with a 19.4% year-to-date return, compared with a 4.2% decline in Pepsi stock. And over the past five years, Coke is up 53.2%, while Pepsi is down 8.1%.

Where to invest $1,000 right now? Our analyst team just revealed what they believe are the 10 best stocks to buy right now, when you join Stock Advisor. See the stocks Β»

Coke's 10-year median price-to-earnings (P/E) ratio is 27.7 -- only slightly higher than Pepsi's 10-year median P/E of 26. But today, Coke's forward P/E is 25.3 while Pepsi's has slumped to just 16 -- the widest disparity in years.

Here's why investors are bubbling about Coke stock, why Pepsi's fizz has fallen flat, and which blue chip dividend stock is the better buy now.

Stacks of chocolate chip cookies in order of ascending height, illustrating the compounding effects of investing in dividend stocks.

Image source: Getty Images.

Pepsi's North American struggles continue

Pepsi stock was tumbling on July 9 despite decent quarterly results. Investor concerns about declining consumer demand for salty snacks and sugary drinks, as well as inflationary pressures from higher oil prices, may be overshadowing the positives from the quarter.

Pepsi's ownership of Frito-Lay and Quaker Oats, along with its diversified portfolio of beverage brands, gives it a global presence in snacks and nonalcoholic beverages. Pepsi's international segment continues to perform well, with all segments (across product categories and geography) delivering net revenue growth in Pepsi's latest quarter. But Pepsi's North America convenience foods revenue declined, partially driven by lower net pricing, while beverages grew revenue largely thanks to acquisitions made in 2025. When excluding the impact of those acquisitions, Pepsi Beverages North America grew organic revenue by only 1% and saw a 4% decline in beverage volume.

Coke's edge over Pepsi

Pepsi has a lot of moving parts, whereas Coke simply focuses on what it does best: soda, juice, water, sparkling water, tea, coffee, and energy drinks. The beverage category has generally held up better than packaged foods during the slowdown. And Coke's network of bottling partners gives it incredibly high margins.

Coke sells syrups and concentrates to its bottling partners, which mix, bottle, package, and distribute Coca-Cola products. Since Coca-Cola doesn't own or control most of its bottling partners, they effectively function as franchisees in the broader Coca-Cola system, whereas Pepsi's supply chain doesn't have the same operating leverage as Coke. And although it is more diversified in terms of the number of products and categories, Pepsi is heavily affected by shifting consumer preferences. So while Pepsi is well positioned to handle a change in consumer taste for a specific type of snack, the competitive advantage of having so many different products means little if the prevailing trend is an overall decline in snack demand.

KO Chart

KO data by YCharts

Coke has been crushing Pepsi because it's growing its revenue and earnings more rapidly, its margins are far higher, and investors are willing to pay a higher price for Coke stock relative to its earnings than for Pepsi.

Coke and Pepsi can afford their growing dividends

Coke is guiding for only 4% to 5% organic revenue growth for the full year 2026. But its margins remain high, and earnings continue to grow faster than revenue. It also plans to generate $12.2 billion in 2026 free cash flow (FCF), which is plenty to cover its dividend.

By comparison, Pepsi is forecasting 2% to 4% fiscal 2026 revenue growth. It plans to convert 80% of earnings into FCF. Analyst consensus estimates have Pepsi earning $8.64 per share in fiscal 2026, which would be $6.91 in FCF based on the 80% conversion -- plenty to cover Pepsi's run rate annualized dividend of $5.92.

So while Coke is certainly performing better, it's not running laps around Pepsi to the point where it should trade at a significant premium. It's also worth noting that both companies have strong track records of increasing dividends. Coke has boosted its payout for 64 consecutive years, compared with 54 years for Pepsi. That gives both companies a seat at the table of Dividend Kings, which are companies with at least 50 consecutive years of dividend increases.

As mentioned, Coke and Pepsi have historically traded at similar valuations. And they have also generated similar earnings and dividend growth rates. But Pepsi's drastic underperformance relative to Coke has pushed Pepsi's dividend yield significantly above Coke's. So not only is Pepsi trading at its deepest discount relative to Coke in years, but the difference in their dividend yields is also at a 10-year high.

PEP Dividend Yield Chart

PEP Dividend Yield data by YCharts

Pepsi's road to recovery

Historically, when Coke or Pepsi has gotten too expensive, their stock prices have cooled off, giving earnings time to catch up. Or when they're undervalued, the stock price may grow faster than earnings, which is exactly what has happened to Coke in recent years -- bringing its valuation close to its historical average.

Pepsi could enjoy the same recovery if it can regain investor confidence in its turnaround. Pepsi has made efforts to diversify its product portfolio to address wellness trends by introducing healthier versions of its top brands, as well as through major acquisitions focused on healthier products and mini-meals. But even with those efforts, there's no denying that the vast majority of Pepsi's success depends on salty snacks and sugary drinks.

Last September, activist investor Elliott Investment Management took a $4 billion stake in Pepsi, representing roughly 2% ownership of the company. Elliott argued that margin erosion and poor execution across North America have led to Pepsi falling short of its potential. And that reorganizing the business, product portfolio, supply chain, bottler network, and management team could lead to accelerated revenue, earnings growth, and margins. Pepsi received the news well. In December, with Elliott's help, Pepsi announced new strategic objectives to improve the overall business.

Pepsi has progressed on some parts of that plan -- including adjustments to its food and beverage supply chains to lower costs in North American warehouses and fleet delivery. But ultimately, Pepsi will remain in prove it mode until its margins and earnings growth can return to the levels where investors are willing to give it a premium valuation.

Two excellent dividend stocks to buy now

Coke and Pepsi are both great buys now, but for different reasons.

Coke is executing better than Pepsi and is better positioned to endure a prolonged shift in consumer preferences toward wellness options. But Coke is far from cheap, whereas Pepsi's valuation reflects investor uncertainty.

Investors who believe in Pepsi's turnaround are getting an incredible opportunity to buy the value stock while it's in the bargain bin. However, it's understandable if some investors want to wait and see whether Pepsi shows measurable progress toward its turnaround before backing up the truck and loading pallets of Pepsi stock into their portfolios.

Should you buy stock in Coca-Cola right now?

Before you buy stock in Coca-Cola, consider this:

The Motley Fool Stock Advisor analyst team just identified what they believe are the 10 best stocks for investors to buy now… and Coca-Cola wasn’t one of them. The 10 stocks that made the cut could produce monster returns in the coming years.

Consider when Netflix made this list on December 17, 2004... if you invested $1,000 at the time of our recommendation, you’d have $395,679!* Or when Nvidia made this list on April 15, 2005... if you invested $1,000 at the time of our recommendation, you’d have $1,294,805!*

Now, it’s worth noting Stock Advisor’s total average return is 929% β€” a market-crushing outperformance compared to 211% for the S&P 500. Don't miss the latest top 10 list, available with Stock Advisor, and join an investing community built by individual investors for individual investors.

See the 10 stocks Β»

*Stock Advisor returns as of July 13, 2026.

Daniel Foelber has no position in any of the stocks mentioned. The Motley Fool has no position in any of the stocks mentioned. The Motley Fool has a disclosure policy.

☐ β˜† βœ‡ The Motley Fool

SK Hynix Joins the Nasdaq. But This Nasdaq-100 Semiconductor Stock Could Be an Even Better Buy for the Second Half of 2026.

By: newsfeedback@fool.com (Daniel Foelber) β€”

Key Points

  • The memory chip shortage is one of the biggest bottlenecks for artificial intelligence (AI).

  • SK Hynix plays a major role in the memory chip market.

  • Memory stocks have room to run, but ASML is the better buy for folks with a long-term investing time horizon.

As of market close on July 9, the seven best-performing S&P 500 (SNPINDEX: ^GSPC) stocks year to date are Sandisk, Dell Technologies, Micron Technology, Western Digital, Seagate Technology Holdings, Intel, and Marvell Technology. All of these companies are directly involved with or benefiting from the boom in memory chips for artificial intelligence (AI) workloads in data centers and consumer electronics.

Demand for memory chips and energy are the two greatest bottlenecks impacting the AI industry right now. High bandwidth memory (HBM) and dynamic random-access memory (DRAM) chips function as a working memory for handling massive AI training and inference data sets. And AI NAND (flash) supports longer-term, large-scale data storage and use.

Where to invest $1,000 right now? Our analyst team just revealed what they believe are the 10 best stocks to buy right now, when you join Stock Advisor. See the stocks Β»

SK Hynix (NASDAQ: SKHY) (NASDAQ: SKHYV) is a full-stack AI memory provider. It is expanding its HBM capabilities to improve AI chip performance. Demand for SK Hynix memory chips is far outpacing supply, creating a multi-year runway for future growth that has propelled the company to a $1 trillion valuation.

On Friday, July 10, SK Hynix listed on the Nasdaq after launching a U.S. share sale. SK Hynix is up 241.5% year to date as of market close on July 9. If it were in the S&P 500, it would be the fourth-best-performing stock, ahead of Western Digital and right behind its competitor Micron.

SK Hynix will never join the S&P 500 because it's a South Korean company, just as Taiwan Semiconductor Manufacturing isn't in the S&P 500. However, it will likely be fast-tracked into the Nasdaq-100 over the coming weeks, similar to how Space Exploration Technologies (NASDAQ: SPCX) went public on June 12 and was added to the Nasdaq-100 on July 7. The Nasdaq-100 is the 100 largest non-financial companies by market cap listed on the Nasdaq exchange.

SK Hynix is chock-full of potential. But ASML (NASDAQ: ASML) is an even better Nasdaq-100 stock for investors looking for a fundamental AI stock to buy and hold for at least five years.

Pink, purple, and blue light reflecting off silicon wafers.

Image source: Getty Images.

ASML is in a league of its own

Netherlands-based ASML is the most valuable company in Europe. And although it's not in the S&P 500 because it isn't based in the U.S., it is one of the top 15 largest holdings in the Nasdaq-100.

ASML doesn't design or manufacture chips. Rather, it produces highly advanced machines needed to perform the lithography step in the semiconductor manufacturing process. Lithography is arguably the most complex and important step in the chip production process because it involves printing designs onto silicon.

ASML has a virtual monopoly on extreme ultraviolet (EUV) machines that use reflective lenses to bounce light in a vacuum, rather than refracting it. The EUV technology produces an incredibly short 13.5-nanometer (nm) wavelength, compared to around 193 nm for deep ultraviolet (DUV) machines.

ASML's high-numerical-aperture (High-NA) EUV machines have an even higher resolution for producing next-generation AI chips at scale. Shorter wavelengths enable chip manufacturers to print smaller, denser features on critical microchip layers in a single pass. To achieve that same level of precision, DUV machines use a process called multi-patterning, which involves several steps and takes longer. So even though EUV machines are incredibly expensive, they can be higher-performance and more cost-effective over a longer useful life.

You can think of DUV machines like manually hitting a nail with a hammer, and EUV machines as having a nail gun. If you're hanging a painting up, a hammer is just fine. But if you're building a house, you'd want the nail gun. EUV machines are overpowered for general chip manufacturing that doesn't require small transistors and wires. But they play an integral role in AI chip manufacturing. There are multiple companies besides ASML that make DUV machines. But ASML is the one that cracked the code on EUV machines, giving chip designers the nail gun needed to evolve manufacturing from nomadic bands to a booming civilization.

As AI adoption grows, fabs that are taking AI chip orders will need to upgrade their equipment to ASML's more advanced EUV machines. And newer fabs will likely incorporate EUV machines as standard equipment. Just last month, Elon Musk addressed ASML employees during a conversation with ASML CEO Christophe Fouquet about the proposed Terafab joint venture between Tesla (NASDAQ: TSLA), SpaceX, and SpaceX-owned xAI.

Terafab would be the largest chip manufacturing facility -- tasked with producing AI chips for SpaceX's orbital data centers. Since Terafab would be handling AI chip workloads, it would need ASML's most advanced machines. And given ASML's multi-year backlog, Musk was essentially giving ASML the green light to accelerate production, since big orders could be coming down the road.

All roads lead to ASML

Semiconductor equipment manufacturers like Applied Materials (NASDAQ: AMAT) and Lam Research (NASDAQ: LRCX) compete in other aspects of chip-making, such as deposition and etching. But no company comes close to challenging ASML in EUV lithography.

Best of all, ASML's lithography machines are needed to produce all kinds of AI chips, including logic chips such as graphics processing units (GPUs), central processing units, and custom-built AI chips like Alphabet's Tensor Processing Units and HBM, DRAM, and NAND memory chips like those made by SK Hynix.

Each quarter, ASML breaks down net system sales (equipment orders excluding servicing its installed base) by logic and memory. In the first quarter of 2026, memory jumped to 51% compared to 42% in the first quarter of 2025, while logic declined from 58% to 49%. The beauty of ASML's business model is that it wins as long as AI chip demand is growing. It is relatively indifferent whether custom AI chips, like those made by Alphabet, eat into GPU market share. Or if Intel takes market share from Taiwan Semiconductor, SK Hynix gains an edge over Micron, etc. ASML has already benefited from the insatiable demand for AI compute, and it is now also benefiting from the boom in memory chip demand.

In sum, buying SK Hynix is a pure-play bet on memory chip demand continuing to outpace supply and on SK Hynix holding its own against fierce competition. Buying ASML is a catch-all way to bet on increased AI chip innovation and the need for higher production, and in turn, more ASML machines in chip fabs.

ASML is worth the premium price

ASML's position in the AI supply chain is well known. The stock is up 125% over the last year and trades at a premium valuation, with a forward price-to-earnings ratio of 49.5, compared with 49.2 for Applied Materials and 43.5 for Lam Research.

ASML may need its earnings growth to catch up to its valuation to justify a higher run-up. But for investors with a long-term time horizon, it stands out as arguably the best semiconductor stock to buy and hold because next-generation AI logic and memory chips depend on ASML's systems to bring their designs to life.

Should you buy stock in ASML right now?

Before you buy stock in ASML, consider this:

The Motley Fool Stock Advisor analyst team just identified what they believe are the 10 best stocks for investors to buy now… and ASML wasn’t one of them. The 10 stocks that made the cut could produce monster returns in the coming years.

Consider when Netflix made this list on December 17, 2004... if you invested $1,000 at the time of our recommendation, you’d have $395,679!* Or when Nvidia made this list on April 15, 2005... if you invested $1,000 at the time of our recommendation, you’d have $1,294,805!*

Now, it’s worth noting Stock Advisor’s total average return is 929% β€” a market-crushing outperformance compared to 211% for the S&P 500. Don't miss the latest top 10 list, available with Stock Advisor, and join an investing community built by individual investors for individual investors.

See the 10 stocks Β»

*Stock Advisor returns as of July 12, 2026.

Daniel Foelber has positions in ASML. The Motley Fool has positions in and recommends ASML, Alphabet, Applied Materials, Intel, Lam Research, Marvell Technology, Micron Technology, Taiwan Semiconductor Manufacturing, Tesla, and Western Digital. The Motley Fool has a disclosure policy.
☐ β˜† βœ‡ The Motley Fool

Coca-Cola Is Crushing the S&P 500 and Nasdaq-100. But There's an Even Better Reason to Buy the Stock in July.

By: newsfeedback@fool.com (Daniel Foelber) β€”

Key Points

As of market close on July 8, the Nasdaq-100, which consists of the 100 largest non-financial companies listed on the Nasdaq stock exchange, is up a rip-roaring 16% in 2026, while the S&P 500 is up 9% year to date (YTD).

Massive gains from chip stocks Intel, Advanced Micro Devices, Marvell Technology, Micron Technology, and Sandisk, as well as semiconductor equipment manufacturers Applied Materials and Lam Research, are driving the indexes to new highs. So it may surprise investors to learn that Coca-Cola (NYSE: KO) is outperforming the Nasdaq-100 and S&P 500 with a 19% YTD return.

Where to invest $1,000 right now? Our analyst team just revealed what they believe are the 10 best stocks to buy right now, when you join Stock Advisor. See the stocks Β»

Coke hit a new all-time high on July 7, and some investors may feel there's plenty of room to run from here. However, the best reason to buy the dividend stock in July isn't its momentum, but rather what Coke delivers for investors even during times of uncertainty.

Coca-Cola logo with soda bottles in the background.

Image source: The Motley Fool.

As reliable as they come

Coke is producing exceptional results despite inflationary and consumer spending pressures on the consumer staples sector. In the first quarter of 2026, Coke grew net revenue by 12% thanks to higher volumes and prices. It also reported an impressive 35% operating margin -- a testament to its elite supply chain, marketing, and network of bottling partners that mix, package, and distribute finished products to stores and restaurants.

For the full year, Coke expects organic revenue growth of 4% to 5% and earnings per share (EPS) growth of 8% to 9%, up from $3 in 2025 EPS. The company also expects to generate a staggering $12.2 billion in free cash flow (FCF).

In February, Coke reaffirmed its spot on the list of Dividend Kings -- an elite group of companies that have raised their annual payouts for at least 50 straight years -- by raising its quarterly dividend from $0.51 to $0.53 per share, marking its 64th consecutive annual dividend increase. Q1 2026 was the first quarter to feature the higher dividend, which cost Coke $2.28 billion, for a run rate of $9.12 billion per year.

Coke's size and 2.6% yield give it one of the highest dividend yields among S&P 500 companies. But based on its 2026 FCF projection, Coke should still have over $3 billion left over in FCF, even when accounting for its dividend expenses.

Anchor your portfolio with a rock-solid dividend stock

Coke isn't the kind of showstopping stock that can blow expectations out of the water with an unprecedented surge in revenue or earnings growth. Rather, it embodies steady compounding with a portfolio of global brands that extends far beyond trademark Coca-Cola.

Coke's competitive advantages are on full display in the present operating environment. Coke has maintained its pricing power and sales volumes during a period when so many of its peers are seeing declines. It continues to rake in the FCF to support a steady and growing dividend, with a yield that far exceeds the S&P 500's 1.1% yield.

Even when factoring in its epic year-to-date run-up, Coke still fetches a reasonable 26 price-to-earnings (P/E) ratio and a 26 forward P/E ratio. Coke's 10-year median P/E is 28 -- as it has historically commanded a premium valuation because of its high-quality industry leadership.

There's no shortage of stocks that yield more than Coke or trade at lower multiples. But you can count on one hand the number of blue chip dividend stocks that hold a candle to Coke's reliability, which is why the stock remains a solid buy in July despite hovering around an all-time high.

Should you buy stock in Coca-Cola right now?

Before you buy stock in Coca-Cola, consider this:

The Motley Fool Stock Advisor analyst team just identified what they believe are the 10 best stocks for investors to buy now… and Coca-Cola wasn’t one of them. The 10 stocks that made the cut could produce monster returns in the coming years.

Consider when Netflix made this list on December 17, 2004... if you invested $1,000 at the time of our recommendation, you’d have $395,679!* Or when Nvidia made this list on April 15, 2005... if you invested $1,000 at the time of our recommendation, you’d have $1,294,805!*

Now, it’s worth noting Stock Advisor’s total average return is 929% β€” a market-crushing outperformance compared to 211% for the S&P 500. Don't miss the latest top 10 list, available with Stock Advisor, and join an investing community built by individual investors for individual investors.

See the 10 stocks Β»

*Stock Advisor returns as of July 11, 2026.

Daniel Foelber has no position in any of the stocks mentioned. The Motley Fool has positions in and recommends Advanced Micro Devices, Applied Materials, Intel, Lam Research, Marvell Technology, and Micron Technology. The Motley Fool has a disclosure policy.

☐ β˜† βœ‡ The Motley Fool

Could Coca-Cola Issue a Stock Split If It Hits $100 Per Share?

By: newsfeedback@fool.com (Daniel Foelber) β€”

Key Points

  • Coca-Cola is hovering around an all-time high.

  • Its last two stock splits occurred when its stock price was around $80 per share.

  • If Coke issued a stock split, its weighting in the Dow Jones Industrial Average would decrease.

It's been a great year for Coca-Cola (NYSE: KO) investors. As of market close on July 9, the stock is up 18.2% year-to-date (YTD) -- outperforming the Nasdaq-100 and S&P 500 (SNPINDEX: ^GSPC), while its peer, PepsiCo, is down 4% YTD.

Coke reached a new all-time intraday high of $85.68 on July 7. With the stock up over 50% in the last five years, some investors may be wondering if Coke is well on its way to surpassing $100 a share and issuing a stock split.

Where to invest $1,000 right now? Our analyst team just revealed what they believe are the 10 best stocks to buy right now, when you join Stock Advisor. See the stocks Β»

Here's what's driving Coke to new highs, if a stock split could be in the cards in 2026, and if the blue chip dividend stock is a buy now.

A U.S. $1 coin being cut in half over a stock certificate, illustrating the impact of stock splits.

Image source: Getty Images.

Coke is successfully navigating an industrywide slowdown

While Coke's full-year 2026 organic revenue guidance of 4% to 5% may not sound like much, it's exceptional relative to Coke's peers.

Higher oil prices in the first half of 2026 added even more inflationary pressure on already strained consumers. What's more, consumer preferences are changing as health and wellness trends impact snacking and soda demand. Competition from private-label brands is yet another challenge for name-brand companies.

KO Chart

KO data by YCharts

Yet despite all of these factors, Coke continues to maintain sky-high margins, steadily grow revenue, and generate gobs of free cash flow, providing a clear runway for dividend growth to extend its 64-year streak of dividend increases.

Earnings growth must bridge the gap to $100 per share

Coke's stock price has been rising due to a combination of earnings growth and a valuation expansion. As investor confidence in Coke has improved, its stock price has risen faster than earnings, bringing its valuation closer to its long-term average.

KO PE Ratio Chart

KO PE Ratio data by YCharts

Coke can still reach $100 per share, but it may depend more on earnings growth going forward than on an expanding multiple. Still, it's worth noting that Coke is already above its split-adjusted price from its last split.

In late July 2012, Coke issued a 2-for-1 stock split, taking its stock price from around $80 to $40 and doubling the share count. Similarly, Coke issued a 2-for-1 stock split at around $82 per share ($20.50 split-adjusted) in May 1996. At $82.62 per share at the time of this writing, Coke is hovering right around the magic number that has signaled past stock splits. But a lot has changed since Coke's last stock split.

A stock split could trigger Coke's deletion from the Dow

Most modern-day S&P 500 company stock splits occur when a share price is in the mid to high triple digits or even over $1,000 per share. Coke is nowhere close to that range. More importantly, the median price of the average stock in the Dow Jones Industrial Average (DJINDICES: ^DJI) is far higher than it used to be.

Coke has been in the Dow since 1987. Back then, consumer goods, industrial, materials, and utility stocks dominated the index.

Today, the Dow is much more tech-focused. Just last month, Alphabet replaced Verizon Communications in the Dow. In a press release, S&P Dow Jones Indices specifically cited Verizon's lower share price as a reason for its removal from the index, noting that Verizon accounted for just 1/2 of 1% of the index. If the index were equally weighted, each component would account for 3.3%, underscoring just how little Verizon moved the needle. But because the Dow is price-weighted, a stock's price, rather than its market cap, determines its weight in the index. So stock splits heavily impact the index weights.

With Verizon out of the Dow, Coke is now the second-lowest-weighted component behind Nike (NYSE: NKE) -- with Coke making up just 0.9% of the index. And with Nike's turnaround progressing far slower than expected, it is at serious risk of being kicked out of the Dow and replaced by a stock like Meta Platforms.

The Dow was around 13,000 when Coke last split its stock in July 2012. Since then, Coke has more than doubled, but the index has quadrupled. With Coke underperforming the Dow since its last split and being one of the lowest-weighted companies, it remains highly unlikely it will issue a stock split, even though It is hovering near a price level seen before its previous two splits.

A foundational blue chip dividend stock to buy now

While a stock split would make it easier for investors to buy a full share of Coca-Cola, they don't need to let speculation about a split dictate their investment decisions. In fact, research by The Motley Fool shows that stock splits have yielded mixed results.

Split or no split, Coca-Cola stands out as one of the most reliable dividend-paying companies for investors to build a portfolio around. What the company lacks in breakneck earnings growth, it makes up for with dependability. Coke can continue supporting divined raises with cash even during industrywide downturns. Its 2.5% yield is right around the average for consumer staples stocks, but Coke's payout is of far higher quality than the average.

Add it all up, and Coke is a solid buy for investors who prioritize dividend quality and passive income.

Should you buy stock in Coca-Cola right now?

Before you buy stock in Coca-Cola, consider this:

The Motley Fool Stock Advisor analyst team just identified what they believe are the 10 best stocks for investors to buy now… and Coca-Cola wasn’t one of them. The 10 stocks that made the cut could produce monster returns in the coming years.

Consider when Netflix made this list on December 17, 2004... if you invested $1,000 at the time of our recommendation, you’d have $407,651!* Or when Nvidia made this list on April 15, 2005... if you invested $1,000 at the time of our recommendation, you’d have $1,252,823!*

Now, it’s worth noting Stock Advisor’s total average return is 922% β€” a market-crushing outperformance compared to 208% for the S&P 500. Don't miss the latest top 10 list, available with Stock Advisor, and join an investing community built by individual investors for individual investors.

See the 10 stocks Β»

*Stock Advisor returns as of July 10, 2026.

Daniel Foelber has positions in Nike. The Motley Fool has positions in and recommends Alphabet, Meta Platforms, Nike, and S&P Global. The Motley Fool recommends Verizon Communications. The Motley Fool has a disclosure policy.

☐ β˜† βœ‡ The Motley Fool

This 4.5%-Yielding Dividend Stock Is Beating the S&P 500 and the Nasdaq. 3 Reasons That Can Continue in the Second Half of 2026

By: newsfeedback@fool.com (Daniel Foelber) β€”

Key Points

  • Kimberly-Clark’s portfolio of leading brands is about to get a whole lot bigger after its Kenvue acquisition.

  • The deal is expected to close before the end of the year.

  • The stock’s valuation is well below its historical average.

As of market close on July 7, the S&P 500 (SNPINDEX: ^GSPC) and Nasdaq Composite (NASDAQINDEX: ^IXIC) are up 9.6% and 11.1% year to date (YTD), respectively, and hovering around all-time highs. The tech sector -- which makes up 38% of the index -- is largely responsible for the strong gains because it is up 24.5% YTD.

However, some noteworthy value stocks are doing even better than the tech-heavy S&P 500. Kimberly-Clark (NASDAQ: KMB) is up 13.7% YTD, and that's without even factoring in two $1.28 per share dividend payments. Earlier this year, Kimberly-Clark raised its dividend for the 54th consecutive year, retaining its spot on the list of Dividend Kings, which have at least 50 consecutive years of dividend increases.

Missed Nvidia in 2009? This Rare Signal Is Flashing Again. In 2009, a "Double Down" signal flashed for a little-known chipmaker called Nvidia. For the first time in years, that same "Total Conviction" signal is flashing for a company 1/100th the size of Nvidia. Continue Β»

Here's why Kimberly-Clark remains a great dividend stock to buy for the second half of the year.

Stacks of coins arranged in increasingly taller towers on a wooden platform next to a dollar sign.

Image source: Getty Images.

1. Kimberly-Clark is recession-resistant

Kimberly-Clark has a portfolio of leading household and personal care brands, many of which are paper-based. Its crown jewel is Huggies, which is the No. 2 diaper brand in the world behind Pampers. Other notable brands include Kleenex, Kotex, Scott, and Cottonelle.

Demand for these products tends to be consistent across economic cycles, though Kimberly-Clark's margins have been under pressure due to rising costs and inflationary pressures on consumer spending. In Kimberly-Clark's first-quarter 2026 earnings call, it forecasted $150 million to $170 million in additional costs if oil remained around $100 per barrel. Oil prices have come down significantly since that late April earnings call, but the months when oil was elevated will affect its full-year margins.

However, Kimberly-Clark is implementing productivity initiatives, new pricing with suppliers, and hedging programs to improve margins. Kimberly-Clark's chief financial officer, Nelson Urdaneta, said the following on the Q1 2026 earnings call:

I'd also remind everyone that we've got a solid track record over the last four years of recovering any input cost inflation and actually expanding margins. If you look at 2023 through 2025, we expanded both gross margins and operating profit margins beyond the levels pre-pandemic. So we're confident in our ability to cover all these input costs over time.

Kimberly-Clark isn't immune to consumer spending trends or macroeconomic factors, but it has done a good job adjusting to the new normal of cost inflation.

2. A major acquisition is right around the corner

In November 2025, Kimberly-Clark announced the acquisition of Kenvue (NYSE: KVUE). The consumer health company spun off from Johnson & Johnson in August 2023 and owns many noteworthy brands, including Aveeno, Neutrogena, Tylenol, Listerine, Johnson's, and BAND-AID.

Since then, Kimberly-Clark and Kenvue shareholders have overwhelmingly approved the acquisition, and Kimberly-Clark has moved forward with key organizational and leadership decisions.

The deal will diversify Kimberly-Clark's revenue streams and enhance its resilience in a recession. Kimberly-Clark expects the transaction to close before the end of the year.

3. Kimberly-Clark is dirt cheap

You may think that Kimberly-Clark would command a premium valuation, given that its stock price is outpacing the S&P 500 and Nasdaq in 2026. However, Kimberly-Clark fell 23% last year and is down 18.1% over the last decade.

Kimberly-Clark now trades at just 15.2 times analyst consensus 2026 earnings estimates of $7.54 per share. Its 10-year median price-to-earnings ratio is 21.9.

A top high-yield dividend stock to buy now

Investors who believe the Kenvue acquisition is the right move are getting a chance to buy Kimberly-Clark at a dirt cheap valuation. Kimberly-Clark expects the combined company to deliver $2.1 billion in annual run rate synergies by the second year following the acquisition, unlocking operating leverage and boosting margins.

In the meantime, investors can count on Kimberly-Clark's high-yield dividend. Although a high yield can sometimes indicate that a dividend is becoming unsustainable, Kimberly-Clark's earnings and free cash flow still exceed its payout.

With an established and recession-resistant portfolio of brands, Kimberly-Clark stands out as an attractive value stock for investors looking for an alternative to high-flying growth stocks. Unlike hyperscaler cloud computing companies, Kimberly-Clark isn't spending a ton of capital expenditures on big ideas that it needs to pay off. Rather, it is a stable stalwart that has rewarded income investors for decades.

Therefore, Kimberly-Clark can continue to outperform the S&P 500 and Nasdaq because its earnings growth expectations are already low. So even decent results would likely be received well by investors. However, Kimberly-Clark isn't without its risks.

If the Kenvue acquisition doesn't go as smoothly as planned or fails to unlock the cost savings Kimberly-Clark hopes for, it could make its dividend less affordable, which could strain its balance sheet. The combined company must also prove it can extract value from a larger portfolio of brands, which comes with a slew of execution challenges from a new leadership team.

Therefore, some investors may want to wait for the dust to settle after the Kenvue acquisition before buying the stock. Investors who don't mind the uncertainty can scoop up shares at an attractive valuation.

Should you buy stock in Kimberly-Clark right now?

Before you buy stock in Kimberly-Clark, consider this:

The Motley Fool Stock Advisor analyst team just identified what they believe are the 10 best stocks for investors to buy now… and Kimberly-Clark wasn’t one of them. The 10 stocks that made the cut could produce monster returns in the coming years.

Consider when Netflix made this list on December 17, 2004... if you invested $1,000 at the time of our recommendation, you’d have $409,970!* Or when Nvidia made this list on April 15, 2005... if you invested $1,000 at the time of our recommendation, you’d have $1,200,223!*

Now, it’s worth noting Stock Advisor’s total average return is 916% β€” a market-crushing outperformance compared to 210% for the S&P 500. Don't miss the latest top 10 list, available with Stock Advisor, and join an investing community built by individual investors for individual investors.

See the 10 stocks Β»

*Stock Advisor returns as of July 8, 2026.

Daniel Foelber has positions in Kenvue and Kimberly-Clark. The Motley Fool recommends Johnson & Johnson and Kenvue. The Motley Fool has a disclosure policy.

☐ β˜† βœ‡ The Motley Fool

SpaceX Officially Joined the Nasdaq-100 and Received a $300 Price Target From Wall Street. Here's Why the Stock Is Falling Anyway.

By: newsfeedback@fool.com (Daniel Foelber) β€”

Key Points

  • SpaceX will make up a larger share of the Nasdaq-100 once more shares are available for public trading.

  • SpaceX is chock-full of potential, with no shortage of bold ideas and few formidable competitors.

  • Fundamentals need to catch up with investor enthusiasm for the stock to be a good long-term investment.

On July 7, Space Exploration Technologies (NASDAQ: SPCX) joined the Nasdaq-100 -- which is the 100 largest non-financial companies by market cap listed on the Nasdaq stock exchange. It also received a $300 price target from Morgan Stanley, one of the Wall Street banks that underwrote SpaceX's initial public offering (IPO).

Being a part of a major index is more than just name recognition. Exchange-traded funds (ETFs) benchmarked to the Nasdaq-100, such as the Invesco QQQ Trust (NASDAQ: QQQ), will begin buying shares of SpaceX. The more indexes a company can be a part of, the more demand is unlocked from ETF inflows -- the crown jewel being the S&P 500 (SNPINDEX: ^GSPC), because the largest ETFs in the world are linked to it.

Where to invest $1,000 right now? Our analyst team just revealed what they believe are the 10 best stocks to buy right now, when you join Stock Advisor. See the stocks Β»

Here's why SpaceX was added to the Nasdaq-100 so quickly, and why the growth stock is falling anyway.

An investor scratches their head while looking at a downward-sloping stock market chart.

Image source: Getty Images.

SpaceX will soon be a top holding in the Nasdaq-100

The Nasdaq's new fast-track rules are meant to expedite the inclusion of megacap companies that recently had IPOs. If a company is at least as valuable as the 40th-largest Nasdaq listing, which is a market cap of around $121 billion, it can now be added to the Nasdaq-100 after its 15th trading day. SpaceX has a market cap of around $2 trillion and is the world's seventh-most valuable company -- so it clears the size hurdle with ease.

SpaceX went public on June 12, but markets were closed on Juneteenth (June 19) and July 3. So, it wasn't added to the Nasdaq-100 until over three weeks after its IPO. However, SpaceX's weight in the Nasdaq-100 isn't its market cap. Rather, it is based on a multiple of the float, which is the number of shares available for trading by the public. SpaceX's float is around just 5% of its market cap. But the float could increase rapidly in the coming months.

The vast majority of SpaceX stock is held by insiders who bought in when the company was private -- including institutional investors from previous funding rounds, employees, and founders. SpaceX plans to gradually unlock early-release-eligible shares through a tiered system over the next 180 days, with 20% of shares available for trading two days after the release of its earnings for the quarter ended June 30, and up to 30% if SpaceX's stock price is at least $175.50 per share.

More key unlocking events will occur throughout the summer and fall. And eventually, 100% of the early-release shares will be available for trading by Dec. 9 -- which is 180 days after the IPO date.

Granted, not all insiders will sell their shares and make them available for trading on public markets. Elon Musk and other significant investors have agreed to hold shares for at least 366 days after May 20, the date of SpaceX's Form S-1 filing with the Securities and Exchange Commission. And many early founders still hold large positions in major tech companies, such as Musk in Tesla or Jeff Bezos in Amazon.

Before the recently implemented fast-track process for larger IPOs, the Nasdaq-100 required a free float of at least 10%, meaning at least 10% of the company's shares are publicly tradable. SpaceX should cross that level even if a fraction of early-release-eligible shares are sold and made available on the Nasdaq in the coming months. If I had to guess, I'd expect SpaceX's weighting in the Nasdaq-100 to mirror its market cap by mid-August at the latest.

The market is always evolving

Once SpaceX is weighted by market cap, it will be a top-10 holding in the Nasdaq-100 and account for around 4% of the index. And as more blockbuster IPOs like Anthropic and OpenAI are fast-tracked into the index and reach the float requirements, they, too, could become key holdings. The rapid restructuring of the Nasdaq-100 has undoubtedly piqued the interest of index and ETF investors, especially those who regularly put their hard-earned savings to work in products benchmarked to the indexes.

A common mistake investors will make is assuming that an index is diversified just because it contains hundreds or thousands of stocks. When in reality, the Nasdaq-100 and S&P 500 have become concentrated in a handful of names. And that concentration could increase as megacap IPOs are added.

To stay even-keeled no matter what the market is doing, it's important to heed Peter Lynch's advice about knowing what you own and why you own it. That exercise is straightforward with individual stocks, where an investment thesis can anchor a key holding. But even for ETFs, it's worth recognizing some of the major themes and companies that will drive gains (or losses).

By design, the major indexes can undergo drastic transformations as the economy evolves. A couple of decades ago, major oil companies, industrial conglomerates, and consumer goods companies dominated the largest S&P 500 and Dow Jones Industrial Average (DJINDICES: ^DJI) companies. But the tech sector now makes up a staggering 38% of the S&P 500. And Alphabet just replaced Verizon Communications in the Dow -- meaning that seven of the 30 Dow components have changed seats in the last six years.

SpaceX will continue making waves on public markets

SpaceX's growing share of the indexes and lofty price targets from Wall Street banks have more to do with market dynamics than SpaceX's investment thesis. The recent sell-off in the stock is likely due to fading enthusiasm as investors focus more on SpaceX's fundamentals -- which are shaky given its valuation is in the stratosphere.

For the stock to be a good long-term buy for new investors, SpaceX needs to make progress on its bold plans to launch constellations of orbital artificial intelligence compute satellites and build the world's largest chip manufacturing plant in Texas in partnership with Tesla. Until that happens, SpaceX is best kept on a watch list. And investors who want to avoid the stock entirely may want to double-check that the ETFs they hold don't begin buying SpaceX, especially as its float increases in the coming months.

Should you buy stock in Space Exploration Technologies right now?

Before you buy stock in Space Exploration Technologies, consider this:

The Motley Fool Stock Advisor analyst team just identified what they believe are the 10 best stocks for investors to buy now… and Space Exploration Technologies wasn’t one of them. The 10 stocks that made the cut could produce monster returns in the coming years.

Consider when Netflix made this list on December 17, 2004... if you invested $1,000 at the time of our recommendation, you’d have $409,970!* Or when Nvidia made this list on April 15, 2005... if you invested $1,000 at the time of our recommendation, you’d have $1,200,223!*

Now, it’s worth noting Stock Advisor’s total average return is 916% β€” a market-crushing outperformance compared to 210% for the S&P 500. Don't miss the latest top 10 list, available with Stock Advisor, and join an investing community built by individual investors for individual investors.

See the 10 stocks Β»

*Stock Advisor returns as of July 8, 2026.

Daniel Foelber has no position in any of the stocks mentioned. The Motley Fool has positions in and recommends Alphabet, Amazon, and Tesla. The Motley Fool recommends Verizon Communications. The Motley Fool has a disclosure policy.

☐ β˜† βœ‡ The Motley Fool

Meet the Dividend King Stock That's Up 20% in 2026. Here's Why It Can Continue Outperforming the S&P 500 and Nasdaq-100 in the Second Half.

By: newsfeedback@fool.com (Daniel Foelber) β€”

Key Points

  • Colgate-Palmolive doesn’t depend on the U.S. market to drive sales growth.

  • The company’s margins are strong, although they have ticked down in recent years.

  • Colgate-Palmolive is expensive for all the right reasons.

As of market close on July 3, the S&P 500 (SNPINDEX: ^GSPC) and the Nasdaq-100 are up 9.3% and 16.2%, respectively, year to date (YTD). This is well ahead of their historical average annual gains. The tech sector, especially semiconductor stocks, has been the driver of broader market returns. But that doesn't mean all value stocks are underperforming the major indexes.

Colgate-Palmolive (NYSE: CL) is up 20.4% YTD. And it's also an ultra-reliable dividend stock that has paid uninterrupted dividends since 1895 and has increased its payout for 63 consecutive years. That streak earns Colgate-Palmolive a spot on the list of Dividend Kings, which are companies that have paid and increased their dividends for at least 50 consecutive years.

Missed Nvidia in 2009? This Rare Signal Is Flashing Again. In 2009, a "Double Down" signal flashed for a little-known chipmaker called Nvidia. For the first time in years, that same "Total Conviction" signal is flashing for a company 1/100th the size of Nvidia. Continue Β»

Here's why Colgate-Palmolive remains a top buy now even after its recent run-up.

Rolled U.S. $1 bills in order of ascending height, illustrating the ability to compound dividend income by investing in Dividend King stocks.

Image source: Getty Images.

Colgate-Palmolive is at the top of its game

Colgate-Palmolive has been a standout in the household and personal products industry. The company is guiding for 2026 net sales growth of 2% to 6% and organic sales growth of 1% to 4% at a time when many of its peers are experiencing sales declines. And even with margins under pressure, Colgate-Palmolive remains one of the most profitable companies in its industry. By comparison, Unilever, Kenvue, Church & Dwight, Clorox, Kimberly-Clark, and Estee Lauder all have operating margins under 20%.

CL Revenue (TTM) Chart

CL Revenue (TTM) data by YCharts

The industry has been dealing with inflationary pressures and consumer resistance to price increases. But Colgate-Palmolive has done a masterful job of navigating these challenges through its elite brand portfolio, highly efficient supply chain and operations, and geographic diversification.

In addition to its flagship Colgate and Palmolive brands, the company owns Softsoap, Irish Spring, Tom's of Maine, and Speed Stick, among others. One of Colgate-Palmolive's top brands, Hill's Pet Nutrition, made up 23% of total 2025 sales.

Without factoring in Hill's, Europe, Middle East, and Africa (EMEA), Latin America, and Asia Pacific sales are more than triple those of North America, which has helped make Colgate-Palmolive resistant to U.S.-specific inflationary pressures. In the first quarter of 2026, North America was the only region that reported declining net and organic sales, while Latin America and EMEA posted double-digit growth and total company net sales rose 8.4% year over year.

A dividend you can count on

Colgate-Palmolive is far from cheap -- trading at 25 times forward earnings -- because the stock price has been rising faster than the company's earnings growth. But Colgate-Palmolive deserves its premium valuation because its results are solid despite a difficult operating environment. This resilience is particularly appealing to risk-averse folks seeking a stable passive income stream to help supplement retirement income. If inflationary pressures ease and consumer spending improves, a rising tide will lift the broader household and personal products industry. But Colgate-Palmolive isn't dependent on those factors to drive sales growth.

Colgate-Palmolive yields 2.2%, which is good but not quite high-yield territory. Many of its peers offer higher yields because they distribute the vast majority of their cash flow to shareholders through dividends, whereas Colgate-Palmolive's dividend is highly affordable. Its trailing-12-month free cash flow per share is at an all-time high of $4.66, well over double its $2.06 per-share annualized dividend.

So while Colgate-Palmolive could easily afford to pay a higher dividend, the company prefers a balanced approach of using cash to reinvest in the business, paying a steadily growing (and manageable) dividend, and buying back stock. Colgate-Palmolive has reduced its share count by 10% over the last decade, which has helped make the stock a better value.

Investing in a market leader

Colgate-Palmolive's geographic diversification and portfolio of leading brands across pet nutrition and oral, personal, and home care make it highly recession resistant. The company continues to deliver solid growth through volume and price increases, while many of its peers face a difficult trade-off: either cutting prices to drive volume or keeping prices high at the expense of lower sales volumes.

All told, Colgate-Palmolive stands out as one of the most reliable dividend-paying stocks on the market. It's a top buy for the second half of the year for investors who don't mind paying a premium price for a quality company.

Should you buy stock in Colgate-Palmolive right now?

Before you buy stock in Colgate-Palmolive, consider this:

The Motley Fool Stock Advisor analyst team just identified what they believe are the 10 best stocks for investors to buy now… and Colgate-Palmolive wasn’t one of them. The 10 stocks that made the cut could produce monster returns in the coming years.

Consider when Netflix made this list on December 17, 2004... if you invested $1,000 at the time of our recommendation, you’d have $418,761!* Or when Nvidia made this list on April 15, 2005... if you invested $1,000 at the time of our recommendation, you’d have $1,195,804!*

Now, it’s worth noting Stock Advisor’s total average return is 918% β€” a market-crushing outperformance compared to 208% for the S&P 500. Don't miss the latest top 10 list, available with Stock Advisor, and join an investing community built by individual investors for individual investors.

See the 10 stocks Β»

*Stock Advisor returns as of July 7, 2026.

Daniel Foelber has positions in EstΓ©e Lauder Companies, Kenvue, and Kimberly Clark. The Motley Fool has positions in and recommends Colgate-Palmolive. The Motley Fool recommends Kenvue and Unilever. The Motley Fool has a disclosure policy.

☐ β˜† βœ‡ The Motley Fool

It Took Tesla 10 Years to Perform Its First Stock Split. Here's Why a SpaceX Stock Split Could Come Much Sooner.

By: newsfeedback@fool.com (Daniel Foelber) β€”

Key Points

  • Tesla went public at a much lower valuation and market cap than SpaceX.

  • When SpaceX's stock price rises by 0.25%, it adds more to its market cap than Tesla's entire market cap at its IPO.

  • Its ambitious plans carry big risks, but if they pay off, the company could be worth far more in a few years than it is today.

Space Exploration Technologies (NASDAQ: SPCX) and Tesla (NASDAQ: TSLA) are often compared because Elon Musk is the founder, CEO, and largest individual shareholder of both companies. And now that SpaceX is public, some investors are trying to decide which stock is the better buy. They may also be wondering whether one hypothetical that has been getting widely discussed -- a SpaceX-Tesla merger -- makes sense.

Considering that in the short time that is has been public, SpaceX briefly soared as high as 50% above the $150 per share price at which it opened its first day of trading, some investors may even be wondering whether a SpaceX stock split is in the cards for the relatively near future or if it is more likely to wait a decade to conduct its first split like Tesla did. Here's what could lead to a SpaceX stock split, and if the growth stock is a buy now.

Missed Nvidia in 2009? This Rare Signal Is Flashing Again. In 2009, a "Double Down" signal flashed for a little-known chipmaker called Nvidia. For the first time in years, that same "Total Conviction" signal is flashing for a company 1/100th the size of Nvidia. Continue Β»

A U.S. $1 coin being cut in half over a stock certificate, illustrating the impact of stock splits.

Image source: Getty Images.

A primer on stock splits

Stock splits do nothing to directly increase the value of a business. They simply divide the ownership pie into more parts. A split makes it easier for small retail investors to buy full shares of a company, although many brokers and employee stock plans offer fractional shares. Stock splits also make options contracts more accessible, since those are sold in 100-share increments.

That said, there can be a psychological effect. Seeing a stock go from $20 to $21 a share can feel underwhelming compared with a jump from $2,000 to $2,100 per share, even though both are 5% gains. What's more, a stock split is generally viewed as a tangible vote of confidence from management: Such events generally happen only after the share price has risen significantly, and they indicate that company leadership expects those gains to continue.

But research by The Motley Fool shows that the results for stocks in the periods after they split are mixed, so it's better to pick stocks to buy based on fundamentals instead of looking for splits.

The makings of a SpaceX stock split

Tesla went public in June 2010 at a non-split-adjusted price of $17 per share.In August 2020, Tesla announced its first-ever stock split -- a 5-for-1 stock split, to be exact, that gave four additional shares for each then-held share. It conducted a 3-for-1 split in 2022. That means Tesla's split-adjusted IPO price is just $1.13 per share -- a mind-blowing 33,503% gain for investors who bought at the IPO price and held.

At the time of its first split, Tesla was approaching $2,500 per share, and it was under $900 at the time of its second. But Tesla was a small-cap company at the time of its IPO, whereas SpaceX was the biggest IPO in history and is currently one of seven companies with market caps over $2 trillion.

What's more, SpaceX's IPO price was $135 per share.

In sum, it took Tesla a decade to engage in a stock split after it had gone from a small-cap to a large-cap company. SpaceX might only have to go up a few times over before considering a stock split.

It's worth noting that there's no standard price level for stock splits, but the vast majority of S&P 500 companies trade at under $1,000 per share. However, splits at lower share prices aren't unheard of. Apple was around $500 a share when it engaged in a 4-for-1 stock split in 2020. CrowdStrike is performing a 4-for-1 stock split on July 2, and it closed on June 26 at $701.09 per share.

SpaceX was trading at $153.23 per share at the time of this writing; if it increases in value by at least fourfold (which would put its market cap just over $10 trillion), I would not be surprised if it considers a stock split.

On a percentage basis, that would be a far smaller increase than Tesla had before its first split, but it certainly would be an unprecedented amount of market cap creation.

SpaceX needs its biggest bet to pay off

SpaceX's potential road to $10 trillion will depend heavily on how successful it is at building and launching millions of AI data center satellites into orbit. The plan is to launch the first test satellites as early as 2027. From there, Elon Musk wants to increase the computing power of SpaceX's AI satellite constellation by an order of magnitude per year, which is 10 times -- meaning going from 1 gigawatt (GW) in 2027 to 10 GW in 2028, to 100 GW in 2029, to 1,000 GW (1 terawatt) by the end of 2030 -- assuming that the Terafab plant SpaceX is constructing in partnership with Tesla and Intel can produce the chips that its plan requires in sufficient quantity.

There are plenty of obstacles standing in SpaceX's way. For starters, these satellites will be much larger, both in mass and surface area, than Starlink's broadband and mobile satellites, so they will be much heavier and cost more to launch. What's more, placing them in the sun-synchronous orbit Musk has proposed would cause light pollution and create all kinds of headaches for astronomers. SpaceX is building a massive factory in Texas called Gigasat to make these satellites, which could encounter production challenges. Those are only some of a long list of technical and logistical hurdles that will need to be cleared.

And finally, if those issues are overcome, SpaceX will need to prove there is a customer base willing to pay top dollar for this orbital computing capacity to justify the costs. Or, put another way, SpaceX will need to demonstrate that there are measurable cost savings to be had from using orbital data centers rather than Earth-based data centers. If they pan out, those benefits would most likely be related to the fact that they will be powered by solar energy and use large radiator panels to expel the heat the servers generate as infrared radiation, rather than relying on water-based heat sinks or liquid cooling systems.

If SpaceX somehow pulls all of this off, it will become the most important AI infrastructure company in the world and help address one of the biggest challenges in AI -- the energy bottleneck. It could provide the jumping-off point -- and more importantly, the cash flow -- for SpaceX to pursue other endeavors in space technology and interplanetary travel.

Under that outcome, with the combined value of SpaceX-owned xAI and X (formerly Twitter), SpaceX would absolutely deserve a market cap north of $10 trillion, be the world's most valuable company, and could reach the point where its stock price warranted a split. If it launches 1 million AI computing satellites in less than five years, it could engage in a stock split a lot sooner in its publicly traded life than Tesla did.

However, SpaceX reported a net loss in 2025, and there's no telling what challenges could throw a wrench in its ambitious plans. Investors may be better off taking a wait-and-see approach to SpaceX, monitoring its progress toward its goals rather than buying the stock based solely on the company's vision.

Should you buy stock in Space Exploration Technologies right now?

Before you buy stock in Space Exploration Technologies, consider this:

The Motley Fool Stock Advisor analyst team just identified what they believe are the 10 best stocks for investors to buy now… and Space Exploration Technologies wasn’t one of them. The 10 stocks that made the cut could produce monster returns in the coming years.

Consider when Netflix made this list on December 17, 2004... if you invested $1,000 at the time of our recommendation, you’d have $397,890!* Or when Nvidia made this list on April 15, 2005... if you invested $1,000 at the time of our recommendation, you’d have $1,196,664!*

Now, it’s worth noting Stock Advisor’s total average return is 902% β€” a market-crushing outperformance compared to 207% for the S&P 500. Don't miss the latest top 10 list, available with Stock Advisor, and join an investing community built by individual investors for individual investors.

See the 10 stocks Β»

*Stock Advisor returns as of July 1, 2026.

Daniel Foelber has no position in any of the stocks mentioned. The Motley Fool has positions in and recommends Apple, CrowdStrike, and Tesla. The Motley Fool has a disclosure policy.

☐ β˜† βœ‡ The Motley Fool

Alphabet Just Replaced Verizon in the Dow. Could Nike Be the Next Dow Stock to Be Deleted?

By: newsfeedback@fool.com (Daniel Foelber) β€”

Key Points

  • Nike is now the lowest-priced stock in the Dow Jones Industrial Average.

  • Nike has performed terribly since being added to the index in 2013.

  • A stock with a far lower dividend yield could replace Nike.

Just as I predicted, Honeywell International's aerospace spinoff on June 29 was the catalyst for Alphabet to join the Dow Jones Industrial Average (DJINDICES: ^DJI).

With Alphabet replacing Verizon Communications, Nike (NYSE: NKE) is now by far the lowest-priced Dow stock. Here's why that matters, and why it could spell trouble for Nike's seat in the Dow.

Missed Nvidia in 2009? This Rare Signal Is Flashing Again. In 2009, a "Double Down" signal flashed for a little-known chipmaker called Nvidia. For the first time in years, that same "Total Conviction" signal is flashing for a company 1/100th the size of Nvidia. Continue Β»

An investor puts their hand on their chin and looks at a computer screen in a tense manner.

Image source: Getty Images.

Nike is in the same boat as Verizon

In its June 23 press release, S&P Dow Jones indexes specifically called attention to Verizon's lower share price as the reason for its removal, stating that it made up less than one-half of one percentage point. "The Dow Jones Industrial Average is a price-weighted index, and thus, persistently lower-priced stocks have an immaterial impact on the index," read the press release.

Nike also makes up just 0.5% of the Dow. The stock is hovering around a 12-year low. And even when factoring in dividends, Nike has given shareholders a total return (capital gains plus dividends) of just 39.6% in its time as a Dow stock.

^DJI Chart

^DJI data by YCharts

As the chart shows, Nike outperformed the Dow until recently.

Nike's turnaround has been anything but smooth

Nike's turnaround has taken far longer than expected. The company overestimated the staying power of pandemic-driven consumer demand, which is also when Nike stock hit an all-time high. Nike aggressively shifted to a direct-to-consumer (DTC) model through Nike Direct and Nike Digital, reducing its business with wholesalers in the process. But that backfired when wholesale relationships proved more valuable than Nike had anticipated, as its DTC model wasn't growing nearly as quickly as expected. Throw in strained consumer spending, inflationary pressures, and tariffs, and it's easy to see why Nike has continued to tread water.

Nike has shown signs of recovery and gained momentum after its new CEO, Elliott Hill, took over in October 2024. But in Nike's latest earnings call in March, Hill said the turnaround is taking longer than he would have liked, and that spring 2027 will be the first time Nike realizes the fruits of its reorganization efforts. However, he remains optimistic that Nike's efforts will pay off in the long run.

Nike remains a footwear and apparel powerhouse. And to its credit, it has paid and raised its dividend for 24 consecutive years and is one of the higher-yielding Dow stocks at 4%. But even if Nike doubled, it would still be the lowest-priced stock in the Dow. And with the turnaround far from over, it wouldn't be surprising if Nike was booted from the Dow.

However, there have been recent cases of Dow stocks that were deleted and went on to crush the stocks that replaced them. Intel has outperformed Nvidia by a wide margin since it was replaced in November 2024. Similarly, RTX has crushed Honeywell. Meanwhile, ExxonMobil has run laps around Salesforce.

So even if Nike gets removed from the Dow, patient investors who still believe in its brand power and turnaround potential may want to buy and hold the high-yield dividend stock.

The stock that could replace Nike

When S&P Dow Jones swaps out a Dow stock, it's typically for another stock in the same sector or with industry overlap. However, that's not always the case, as Salesforce replaced ExxonMobil. And Alphabet's replacement of Verizon and Amazon's replacement of Walgreens Boots Alliance are technically sector replacements in communications and consumer discretionary, respectively, although Alphabet and Amazon are both tech powerhouses in their own right.

With Nvidia now in the Dow, I don't think Broadcom or Micron Technology would replace Nike. Tesla has a shot, although if it merged with Space Exploration Technologies, that would complicate things.

My best guess is that if Nike is kicked from the Dow, the most logical replacement is Meta Platforms (NASDAQ: META). Since the Dow already has considerable exposure to consumer discretionary and consumer staples, it could make sense to replace Nike with a stock from a different sector. Meta and Alphabet overlap in that they both have massive advertising businesses. But Meta is in a league of its own with social media. And it began paying a dividend in 2024, which helps its blue-chip case if it builds on that payout.

Should you buy stock in Nike right now?

Before you buy stock in Nike, consider this:

The Motley Fool Stock Advisor analyst team just identified what they believe are the 10 best stocks for investors to buy now… and Nike wasn’t one of them. The 10 stocks that made the cut could produce monster returns in the coming years.

Consider when Netflix made this list on December 17, 2004... if you invested $1,000 at the time of our recommendation, you’d have $398,052!* Or when Nvidia made this list on April 15, 2005... if you invested $1,000 at the time of our recommendation, you’d have $1,181,688!*

Now, it’s worth noting Stock Advisor’s total average return is 892% β€” a market-crushing outperformance compared to 205% for the S&P 500. Don't miss the latest top 10 list, available with Stock Advisor, and join an investing community built by individual investors for individual investors.

See the 10 stocks Β»

*Stock Advisor returns as of June 30, 2026.

Daniel Foelber has positions in Nike and Nvidia. The Motley Fool has positions in and recommends Alphabet, Amazon, Broadcom, Honeywell International, Intel, Meta Platforms, Micron Technology, Nike, Nvidia, RTX, S&P Global, Salesforce, and Tesla. The Motley Fool recommends Verizon Communications. The Motley Fool has a disclosure policy.

❌