FreshRSS

🔒
❌ About FreshRSS
There are new articles available, click to refresh the page.
☐ ☆ ✇ CoinGape

How High Can Zcash Price Go?

By: Frank bevah

Zcash price climbed 20% within 24 hours, reaching $1,210.67 while the broader cryptocurrency market remained largely unchanged. The privacy-focused coin briefly touched $1,225 after buyers accelerated their shift toward alternative cryptocurrencies. Rising volume, institutional demand, and short liquidations supported the advance. ZEC price has gained about 550% from its yearly low and nearly 4,000% from

The post How High Can Zcash Price Go? appeared first on CoinGape.

☐ ☆ ✇ Crypto Insiders

Van de Poppe: 'Waarom ik nu $25.000 in deze cryptomunt steek'

By: Kevin Schijven
Michaël van de Poppe zet flink in op één altcoin. De Nederlandse crypto-analist heeft ongeveer 25.000 dollar in NEAR zitten, waarmee het momenteel zijn grootste altcoinpositie is. Dat doet hij terwijl zijn bredere portefeuille nog tienduizenden dollars in de min staat. Toch verwacht Van de Poppe juist nu een omslag en denkt hij dat NEAR daar sterk van kan profiteren. Ontvang net als duizenden Nederlanders cryptonieuws direct op je telefoon door de gratis Crypto Insiders app.

In het kort

  • Michaël van de Poppe heeft ongeveer 25.000 dollar in NEAR geïnvesteerd.
  • Hij verwacht binnen één tot twee maanden een mogelijke stijging richting 4 tot 5 dollar.
  • De analist heeft in totaal ongeveer 200.000 dollar in altcoins gestoken en staat daarop nog 80.000 tot 90.000 dollar in de min.

Waarom Van de Poppe juist NEAR koopt

Van de Poppe ziet een groot verschil tussen de koers van NEAR en de ontwikkeling van het netwerk. Zo liggen de opbrengsten van het netwerk volgens hem inmiddels hoger dan bij de vorige grote koerspiek, terwijl de prijs van NEAR daar nog ruim onder staat. Hij ziet daardoor ruimte voor de koers om verder te herstellen. Ook technisch ziet hij signalen die hem positief stemmen. NEAR laat volgens hem vergelijkbare patronen zien als Arbitrum, dat deze week in korte tijd hard is gestegen.

Analist mikt op 4 tot 5 dollar

Van de Poppe verwacht dat NEAR eerst de recente top rond 3 dollar kan bereiken. Voor de komende één tot twee maanden houdt hij vervolgens rekening met een stijging richting 4 tot 5 dollar. Hij wil daarbij niet simpelweg blijven vasthouden. Rond 3 dollar is hij van plan al een deel van zijn positie te verkopen. Stijgt NEAR verder, dan wil hij opnieuw winst nemen en geld vrijmaken voor andere kansen. Dat past bij zijn bredere strategie. Altcoinrally’s duren volgens Van de Poppe vaak maar drie tot zes maanden. Hij wil daarom tijdens sterke stijgingen winst nemen en later opnieuw instappen als de markt corrigeert.

Van de Poppe verwacht nieuwe altcoinrally

Achter zijn investering zit een bredere verwachting dat de cryptomarkt aan een nieuwe stijgende fase is begonnen. Kleine dalingen van bitcoin worden volgens hem snel opgekocht, terwijl steeds meer beleggers weer risico durven nemen. Een forse terugval sluit hij overigens niet volledig uit. Bitcoin zou volgens hem in een negatief scenario nog richting 60.000 dollar kunnen zakken. Toch verwacht hij dat eventuele kleinere correcties snel kopers aantrekken en dat ook altcoins daarvan kunnen profiteren. Van de Poppe heeft de afgelopen twee jaar naar eigen zeggen ongeveer 200.000 dollar in altcoins gestoken en staat daarmee nog zo'n 80.000 tot 90.000 dollar in de min. NEAR is momenteel zijn grootste positie en volgens hem ook de munt waarin hij het meeste vertrouwen heeft. Bekijk hieronder de volledige video-analyse van Michaël van de Poppe voor alle grafieken en zijn volledige onderbouwing. https://www.youtube.com/watch?v=4IDGi-O8SNg

Michael van de Poppe tijdens livestream

Foto: youtube.com/cryptomichnl

☐ ☆ ✇ Crypto Insiders

XRP naar $60? Analist ziet uitbraak 10 jaar in de maak

By: Kevin Schijven
Een koers van 60 dollar voor XRP klinkt op het eerste gezicht wellicht absurd. Toch komt de bekende crypto-analist Ali Martinez precies daarop uit. Hij ziet een enorm patroon dat al sinds 2017 wordt gevormd en dat volgens hem uiteindelijk voor een spectaculaire uitbraak kan zorgen. In deze Grafiek van de week kijken we wat er achter die voorspelling zit en wat er eerst moet gebeuren voordat zo'n scenario überhaupt in beeld komt. Van breaking news tot opvallende koersbewegingen: 27.000 Nederlanders volgen ons op Instagram.

In het kort

  • Ali Martinez ziet op de maandgrafiek van XRP een patroon dat sinds 2017 wordt gevormd.
  • Een maandafsluiting boven 3,66 dollar zou volgens hem een grote uitbraak bevestigen.
  • Het technische koersdoel van zijn patroon ligt rond 60 dollar.

XRP zit al bijna tien jaar in hetzelfde patroon

Martinez wijst op een zogenoemde 'ascending triangle', of oplopende driehoek, op de maandgrafiek van XRP. Daarbij komen de bodems steeds hoger te liggen, terwijl de koers aan de bovenkant telkens tegen ongeveer dezelfde grens aanloopt. Die grens ligt volgens Martinez rond 3,66 dollar, ongeveer gelijk aan de recordkoers van XRP. De lijnen op zijn grafiek gaan terug tot 2017. Het patroon wordt dus al bijna tien jaar gevormd. Technisch analisten zien zo'n oplopende driehoek vaak als een positief signaal. De steeds hogere bodems laten zien dat kopers bereid zijn om op hogere prijzen in te stappen. Een uitbraak naar boven is daarmee echter nog niet gegarandeerd.

Eerst moet XRP boven 3,66 dollar sluiten

Voor Martinez draait het daarom vooral om 3,66 dollar. Alleen even boven die grens uitstijgen is volgens hem niet genoeg. XRP moet een volledige maand daarboven afsluiten om de uitbraak te bevestigen. De koers ligt voorlopig nog een flink stuk hoger. XRP handelt momenteel rond 1,40 dollar en zou dus eerst ruim moeten verdubbelen. Op kortere termijn kijkt Martinez naar lagere niveaus. Crypto Insiders schreef vrijdag nog dat de analist bij een nieuwe stijging eerst een koers rond 2 dollar in beeld ziet komen.

Hoe realistisch is 60 dollar?

Breekt XRP uiteindelijk wel uit het bijna tien jaar oude patroon, dan komt Martinez uit op een technisch koersdoel rond 60 dollar. Vanaf een koers van ongeveer 1,40 dollar zou daarvoor een stijging van ruim 4.000 procent nodig zijn. De bijbehorende marktwaarde laat zien hoe ambitieus dat doel is. Er zijn momenteel ongeveer 62,7 miljard XRP in omloop. Bij een koers van 60 dollar zou XRP daardoor een marktwaarde van ongeveer 3,8 biljoen dollar krijgen. Ter vergelijking: de volledige cryptomarkt is momenteel ongeveer 2,8 biljoen dollar waard en bitcoin ongeveer 1,6 biljoen dollar. XRP zou bij 60 dollar, met de huidige hoeveelheid munten in omloop, dus groter zijn dan de hele cryptomarkt van vandaag en ruim twee keer zo groot als bitcoin nu is. Dat maakt 60 dollar niet onmogelijk als de cryptomarkt in de toekomst veel groter wordt, maar laat wel zien hoe extreem het koersdoel is.

Een analist voert technische analyse uit op een scherm met een koers van een crypto of aandeel

Foto: Zakharchuk/Shutterstock.com

☐ ☆ ✇ CoinGape

Pi Network Price Eyes $0.1 Level After New Developer Capabilities and Documentation Launch

By: Frank bevah

Pi Network hovered above $0.094 on Sunday, keeping the $0.10 target within reach after ecosystem updates. Bitcoin price traded at $79,829, Ethereum was trading at $2,494, and XRP price was trading at $1.41. The crypto market was at an estimated value of 2.71 trillion, which indicates the demand in digital assets. The Senate faces a

The post Pi Network Price Eyes $0.1 Level After New Developer Capabilities and Documentation Launch appeared first on CoinGape.

☐ ☆ ✇ CryptoPotato

Bitcoin’s 4-Year Cycle Could Be Changing: Willy Woo Reveals What Could Replace It

By: Jordan Lyanchev

Given the nature of its blockchain, bitcoin was long considered to move around within a broader four-year cycle prompted by the halving, which takes place in general every four years. However, the pattern has been rejected in the past year or so, and popular on-chain analyst Willy Woo took the same approach in his latest opinion on the matter.

He suggested that BTC may be transitioning toward a six-to-eight-year cycle, increasingly influenced by the same debt and liquidity conditions that drive traditional financial markets.

From Halving to Liquidity?

Woo’s reasoning begins with the cryptocurrency’s diminishing supply shock. Following the latest halving in April 2024, new BTC issuance dropped to approximately 0.8% of the existing supply per year. The next event, scheduled to take place in early 2028, will reduce that figure to roughly 0.4%.

As newly mined supply becomes increasingly insignificant relative to the existing market, Woo argued that the halving’s ability to dictate BTC’s broader price cycle weakens. Instead, the asset may begin moving more closely with TradFi’s six-to-eight-year short-term debt cycle.

The halving framework worked remarkably well for much of bitcoin’s history. Now, though, the market structure has changed dramatically, perhaps mostly from the US spot Bitcoin ETFs. Current data shows that these financial products hold close to 1.3 million BTC, which is over 6% of the circulating supply. Public companies with at least 1,000 BTC currently own over a million units.

Together, ETFs and those corporate treasuries controlled almost 12% of circulating BTC – vastly more than miners now create annually.

Others who have supported the narrative that the four-year cycle is dead include Arthur Hayes, who claimed in 2025 that traders focus too heavily on it, and Fidelity Digital Assets. In a report from last year, the analysts questioned whether BTC’s maturing market could produce more gradual rallies and corrections rather than the violent boom-and-bust cycles of the past.

Not Everyone Is Convinced

Galaxy Research examined the same question in June this year, but concluded something different – BTC’s four-year cycle remains visible in the data. The researchers noted that bitcoin again peaked in October 2025, roughly 18 months after the April 2024 halving – precisely within the historical window.

The difference is that each cycle is becoming less extreme. Bitcoin’s previous bear markets produced drawdowns of approximately 85%, 84%, and 77%, while the decline to the July 1 low was considerably milder at just over 53%.

The post Bitcoin’s 4-Year Cycle Could Be Changing: Willy Woo Reveals What Could Replace It appeared first on CryptoPotato.

☐ ☆ ✇ The Motley Fool

September Is Historically the Worst Month for Stocks. A Pattern From 2000 Says This Could Happen Next.

By: newsfeedback@fool.com (Steven Porrello)

Key Points

September has a bit of a bad rep on Wall Street. The ninth month of the year has historically delivered negative or weaker returns with such consistency that it has even been dubbed "The September Effect."

It's a market anomaly -- an unusual pattern -- but this year it is compounded with real market uncertainty. Among investor concerns: sticky inflation, rising energy prices, hawkish signals from bankers, high yields on U.S. Treasury bonds, a trade war between the U.S. and Canada, an actual war between U.S. and Iran, plus ballooning national debt and continued fears over an AI bubble.

Missed Nvidia in 2009? This Rare Signal Is Flashing Again. In 2009, a "Double Down" signal flashed for a little-known chipmaker called Nvidia. For the first time in years, that same "Total Conviction" signal is flashing for a company 1/100th the size of Nvidia. Continue »

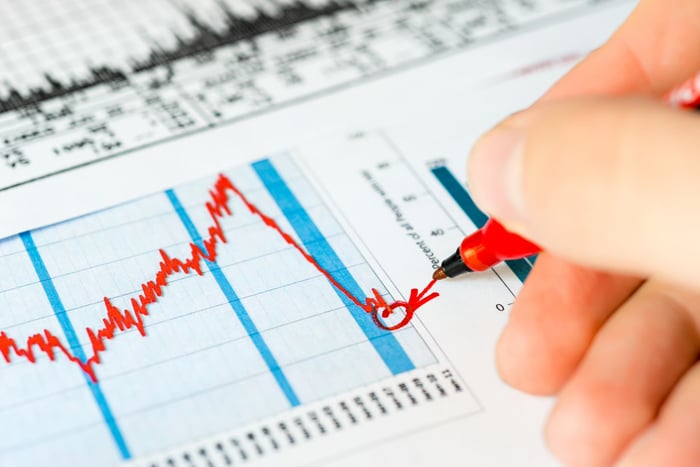
A person with a red pen draws a circle with an arrow at the bottom of a downward trending red line.

Image source: Getty images.

These are, to be fair, just the negatives, and a complete picture would have to add the positives, such as soaring profits for S&P 500 (SNPINDEX: ^GSPC) companies, steady growth in the U.S. economy, and a stock market that is broadening beyond a few megacap leaders.

There is, however, one persistent concern that goes beyond September's historically weak performance. One of the market's most reliable valuation metrics has been flashing a warning light for months. And, if history is any guide, Wall Street won't like what's coming next.

History might be repeating

To be sure, there's no metric that can tell us what's coming next, no metric, for instance, that can predict a crash or correction. But there is one that is pretty good at comparing today's market with predecessors to measure its valuation. That metric would be the CAPE -- and right now, it's in historically high territory.

S&P 500 Shiller CAPE Ratio Chart

Data by YCharts.

The CAPE, also known as the Shiller P/E, averages the S&P 500's last decade of inflation-adjusted earnings. It smooths over one-time events, like recessions or profit surges, to give a clearer picture of how expensive stocks are. Higher CAPEs typically signal that the market could be overvalued, while lower ones mean the opposite.

When you look at the chart, you'll notice three figures. There's the average, which, over 155 years, sits at about 18. Then, there's the highest CAPE ever recorded, 44, which came during the dot-com era. Then there's today's CAPE, roughly 41.

A period with a higher-than-average CAPE reading has historically preceded a period with weaker long-term returns. In extreme cases, the former precedes major market declines, corrections, and outright crashes. The two aren't causally related -- a high CAPE reading doesn't cause a market crash -- but the reading does tell us that stocks look historically expensive and are therefore more vulnerable to whatever triggers the next sell-off.

If history repeats itself, today's bull market could end the same way as the dot-com era's. But history doesn't always repeat -- more accurately it rhymes -- and there's no way of asserting with any certainty that today's market is destined for the same catastrophic ending that popped the dot-com bubble. Even if the market did experience a period of weaker returns, many of today's companies could continue growing their earnings and rewarding investors who stuck with them through the turbulence.

What should investors do?

The important thing is not to overreact. Panicking, trying to time the market, or selling great companies indiscriminately could do more damage than a downturn itself.

In fact, the best thing to do right now is to stay invested in companies you believe in no matter what happens in the larger market. That's easier said than done. Instincts take over when heavy losses are piling up and bad headlines are coming in from every side. You might even think yourself foolish for staying invested -- but history has often rewarded investors willing to look a little foolish in that sense.

Should you buy stock in S&P 500 Index right now?

Before you buy stock in S&P 500 Index, consider this:

The Motley Fool Stock Advisor analyst team just identified what they believe are the 10 best stocks for investors to buy now… and S&P 500 Index wasn’t one of them. The 10 stocks that made the cut could produce monster returns in the coming years.

Consider when Netflix made this list on December 17, 2004... if you invested $1,000 at the time of our recommendation, you’d have $421,997!* Or when Nvidia made this list on April 15, 2005... if you invested $1,000 at the time of our recommendation, you’d have $1,413,876!*

Now, it’s worth noting Stock Advisor’s total average return is 978% — a market-crushing outperformance compared to 213% for the S&P 500. Don't miss the latest top 10 list, available with Stock Advisor, and join an investing community built by individual investors for individual investors.

See the 10 stocks »

*Stock Advisor returns as of September 6, 2026.

Steven Porrello has no position in any of the stocks mentioned. The Motley Fool has no position in any of the stocks mentioned. The Motley Fool has a disclosure policy.

☐ ☆ ✇ The Motley Fool

Why SoundHound AI Stock Rocketed 16.8% Higher in August

By: newsfeedback@fool.com (Scott Levine)

Key Points

After dipping 5.3% lower in July, shares of SoundHound AI (NASDAQ: SOUN) stock jumped higher last month after the artificial intelligence (AI) company' reported strong Q2 2026 financial results.

According to data provided by S&P Global Market Intelligence, SoundHound AI stock rose 16.8% in August.

Missed Nvidia in 2009? This Rare Signal Is Flashing Again. In 2009, a "Double Down" signal flashed for a little-known chipmaker called Nvidia. For the first time in years, that same "Total Conviction" signal is flashing for a company 1/100th the size of Nvidia. Continue »

investor touches digital AI icons.

Image source: Getty Images.

$61.9 million in Q2 2026 revenue sounded good to SoundHound AI investors

Surpassing the $52.4 million that analysts had anticipated, SoundHound AI reported second-quarter 2026 revenue of $61.9 million, a 45% year-over-year increase. At the bottom of the income statement, the company also exceeded expectations. While analysts estimated SoundHound AI would report an adjusted loss per share of $0.05, the company posted a slimmer $0.02 adjusted loss per share.

Although SoundHound AI is still incurring a net loss, the company is making progress toward profitability. In Q2 2026, it expanded its gross profit margin to 45.1% from 39% during the same period last year.

In the press release addressing the financial results, SoundHound AI interim CFO and co-founder James Hom lauded the success of the company's recently launched OASYS, an AI system that enables customers to build and deploy conversational AI agents to accomplish several tasks, such as handling transactions, tasks, and workflows on behalf of customers and employees, stating, "We are excited by the strong interest we are already seeing with OASYS, which is a testament to the category-defining technology we continue to deliver to the market. Our investment in innovation, combined with our cost discipline, is key as we drive our business toward achieving profitable growth."

In addition to the recent quarter, investors celebrated the company's updated 2026 revenue guidance, which ranges from $230 million to $260 million. Should the company achieve the midpoint of this forecast, it will represent year-over-year sales growth of 45%.

While the market celebrated the company's financial results, some analysts took a more bearish stance on the AI stock -- a factor that contributed to shares giving back some of the gains they had made immediately after the company's Q2 results announcement. Piper Sandler analyst James Fish, for example, cut the price target on SoundHound to $7 from $8, maintaining a neutral rating. Similarly, Gil Luria, a DA Davidson analyst, reduced the firm's price target to $10 from $12.

SoundHound AI stock is hanging on the discount rack

Falling 5.9% so far in September, SoundHound AI stock has given back some of the gains that it logged in August. Couple this with the fact that shares of the AI stock are trading at 13.9 times sales -- a discount to their five-year average P/S multiple of 17.2 --, and it looks like now's a good time to start a position.

Should you buy stock in SoundHound AI right now?

Before you buy stock in SoundHound AI, consider this:

The Motley Fool Stock Advisor analyst team just identified what they believe are the 10 best stocks for investors to buy now… and SoundHound AI wasn’t one of them. The 10 stocks that made the cut could produce monster returns in the coming years.

Consider when Netflix made this list on December 17, 2004... if you invested $1,000 at the time of our recommendation, you’d have $421,997!* Or when Nvidia made this list on April 15, 2005... if you invested $1,000 at the time of our recommendation, you’d have $1,413,876!*

Now, it’s worth noting Stock Advisor’s total average return is 978% — a market-crushing outperformance compared to 213% for the S&P 500. Don't miss the latest top 10 list, available with Stock Advisor, and join an investing community built by individual investors for individual investors.

See the 10 stocks »

*Stock Advisor returns as of September 6, 2026.

Scott Levine has no position in any of the stocks mentioned. The Motley Fool has positions in and recommends SoundHound AI. The Motley Fool has a disclosure policy.

☐ ☆ ✇ CryptoPotato

8 in a Row: Ripple (XRP) ETFs Record Another Green Week but Warning Signs Return

By: Jordan Lyanchev

For the eighth consecutive week, the spot XRP ETFs ended in the green, attracting almost $19 million. Although this sounds impressive, the actual number was significantly lower than last week’s figure.

Moreover, Friday ended as a no-inflow day for the first time in about three weeks, reigniting an old dilemma about actual demand.

XRP ETFs Still in the Green

The last full week of August was the best for the XRP ETFs in 2026. They gained over $110 million, making it the most impressive one since early December 2025. The first slowdown during the previous business week was felt on August 31, when investors poured in a more modest $5.64 million.

The double-digit net inflows returned on September 1 with $14.38 million, but the trend changed on Wednesday when withdrawals were dominant with $7.20 million taken out. This was the first red day for the Ripple ETFs since August 5.

$6.14 million entered the funds on Thursday, but Friday was a no-show day with SoSoValue data showing flows of $0.00. The good news is that the cumulative total net inflows hit another all-time high of $1.68 billion.

The worrying part of the weekly performance is actually twofold. First, it was Wednesday’s net outflows, which broke a near-one-month streak. Second, it was Friday’s no-reportable flows, which raised concerns that had been forgotten in the past few weeks.

Before the market-wide revival experienced after August 19, the spot XRP ETFs had seven such days out of 11 trading days in August. Nevertheless, the broader weekly performance was still bullish with almost $19 million in net inflows. The streak of consecutive green weeks is up to eight.

Spot XRP ETF Inflows. Source: SoSoValue

XRP Defends $1.40

Despite the massive inflows of over $110 million during the previous business week, the underlying asset had failed to capitalize and had fallen below the key support at $1.40 last weekend. It dipped further to $1.33 during the new week, but finally found support and surged to $1.45 on Friday.

It was stopped there and pushed south to $1.41 as of press time, which means that it remains above the key support at $1.40. Analysts remain highly bullish on its recent performance, claiming that its bull phase has finally begun. Moreover, Ali Martinez and EGRAG CRYPTO outlined some mind-blowing price targets for the culmination of the bull market, of up to $60.

We break them down in more detail in this article, and review the actual obstacles XRP would have to face on its way to these levels.

The post 8 in a Row: Ripple (XRP) ETFs Record Another Green Week but Warning Signs Return appeared first on CryptoPotato.

☐ ☆ ✇ The Motley Fool

1 Cryptocurrency Up 29% in 3 Weeks to Buy Before It Soars Another 515% by 2029

By: newsfeedback@fool.com (Adam Levy)

Key Points

  • Recent developments at the U.S. Treasury have pushed this cryptocurrency higher.

  • Increased regulatory clarity could pave the way for broader institutional ownership.

  • Analysts at Bernstein expect the cryptocurrency to double by next year, and it could climb more than six-fold by 2029.

Most investors know the cryptocurrency market can move quickly. A 5% or 10% move in a token's price in a few hours isn't uncommon. So, Bitcoin's (CRYPTO: BTC) 29% rise in just a few weeks, including a 21% climb in three days between Aug. 19 and Aug. 22, isn't too out of the ordinary. The leading cryptocurrency trades nearly 41% above its July low as of this writing.

The current momentum in Bitcoin is driven by a couple of key factors that could push its price significantly higher from here. In fact, one analyst thinks the cryptocurrency could reach $500,000 by 2029, representing upside of more than 500% from here.

Missed Nvidia in 2009? This Rare Signal Is Flashing Again. In 2009, a "Double Down" signal flashed for a little-known chipmaker called Nvidia. For the first time in years, that same "Total Conviction" signal is flashing for a company 1/100th the size of Nvidia. Continue »

Here's what investors need to know.

A coin with a circuit printed on it.

Image source: Getty Images.

A 40-year trend is ending, and Bitcoin will benefit

Bitcoin is often called digital gold. Its limited supply and status as a store of value independent from any central bank make it very gold-like. However, it doesn't always trade like gold, which is much less volatile than Bitcoin.

However, Bitcoin has seen its price behave very much like gold during two important occasions in the recent past, as pointed out by Bitwise's head of research André Dragosch in a recent memo. First, Bitcoin moved in line with gold during the 2020 COVID-19 crisis amid multiple rounds of fiscal and monetary stimulus from the Fed and U.S. government. More recently, the two have moved in line with one another as Secretary of the Treasury Scott Bessent signaled the Treasury's plans to increase buybacks of long-term bonds.

Bessent's intervention is a move to tamp down long-term interest rates, which have climbed to their highest level in 19 years. A team of analysts at Bernstein doesn't think interest rates will come down anytime soon, regardless of government intervention. The analysts note that interventions like Bessent's treat the symptom rather than the problem: ongoing government deficits.

The 40-year trend in lower interest rates may be over. With higher interest rates in place, stores of value like Bitcoin may become more expensive.

Importantly, higher long-term interest rates are a challenge worldwide. The United Kingdom, France, Germany, Australia, and Japan are also seeing long-term government bond rates rise. As government debt rises and interest rates compound the challenge, there's a growing likelihood that global currencies will decline in value. As a result, hard assets like gold or Bitcoin will see their prices rise, even if their "value" stays the same.

New regulations could give Bitcoin a boost

There's a growing effort by the U.S. government to regulate cryptocurrencies. The Genius Act, enacted a year ago, established clear rules for how stablecoins are formed and the treasury requirements for maintaining them. The Clarity Act is currently in Congress and would formally classify Bitcoin as a commodity, which falls under the Commodity Futures Trading Commission's (CFTC) jurisdiction.

Unfortunately, the Clarity Act is unlikely to pass without some changes. Lawmakers cite conflicts of interest with President Donald Trump's cryptocurrency holdings and meme coin business. However, it's very likely that additional regulatory clarity will come in the next few years. That will pave the way for broader institutional adoption.

That's important because institutional investors looking to hedge against rising government debt and higher interest rates are a much larger force than the current capital held in Bitcoin. For reference, there's currently $31.2 trillion held in gold. Bitcoin's market cap of $1.6 trillion, and the broader $2.7 trillion market cap of all cryptocurrencies, are relative drops in the bucket.

How much higher can Bitcoin climb?

The analysts at Bernstein believe currency debasement could push the price of Bitcoin substantially higher over the next few years. They see it reaching a new all-time high by next year, topping $150,000 by mid-2027.

The analysts expect Bitcoin to maintain its historical four-year cycle, which could push the price to $300,000 by the end of 2029 in their base case. In their bull case, however, the price could climb to $500,000, aided by positive regulatory developments and macroeconomic tailwinds.

The analysts expect another four-year cycle to follow after prices peak in 2029. The old highs could become the new lows, just as we saw earlier this year when Bitcoin found a floor around $60,000. That means right now could be an excellent opportunity to buy into Bitcoin's momentum, as fundamental drivers can push the price higher.

Should you buy stock in Bitcoin right now?

Before you buy stock in Bitcoin, consider this:

The Motley Fool Stock Advisor analyst team just identified what they believe are the 10 best stocks for investors to buy now… and Bitcoin wasn’t one of them. The 10 stocks that made the cut could produce monster returns in the coming years.

Consider when Netflix made this list on December 17, 2004... if you invested $1,000 at the time of our recommendation, you’d have $421,997!* Or when Nvidia made this list on April 15, 2005... if you invested $1,000 at the time of our recommendation, you’d have $1,413,876!*

Now, it’s worth noting Stock Advisor’s total average return is 978% — a market-crushing outperformance compared to 213% for the S&P 500. Don't miss the latest top 10 list, available with Stock Advisor, and join an investing community built by individual investors for individual investors.

See the 10 stocks »

*Stock Advisor returns as of September 6, 2026.

Adam Levy has positions in Bitcoin. The Motley Fool has positions in and recommends Bitcoin. The Motley Fool has a disclosure policy.

☐ ☆ ✇ The Motley Fool

Buying Archer Aviation Today Could Set You Up for Life

By: newsfeedback@fool.com (Steven Porrello)

Key Points

  • Archer Aviation is an eVTOL developer with defense and commercial ambitions.

  • The company is currently making its way through a tough regulatory process, yet significant revenue could be around the corner.

  • The stock is speculative, but offers investors immense upside.

Imagine a city free from rush-hour traffic -- not a city that literally doesn't have cars (like, say, Venice), but one that has aerial forms of transportation, like flying cars.

That picture in your head is something that could become real in the next decade. The term for it is "urban air mobility." It won't look like The Jetsons or Back to the Future II -- that is, present-day cars that can hover and propel. Rather, urban air mobility will give us electric vertical takeoff and landing (eVTOL) aircraft, basically a combo of drone and helicopter. They will be quieter than helicopters, with a quick velocity that can reduce an hour of traffic to a 10-minute aerial hop.

Missed Nvidia in 2009? This Rare Signal Is Flashing Again. In 2009, a "Double Down" signal flashed for a little-known chipmaker called Nvidia. For the first time in years, that same "Total Conviction" signal is flashing for a company 1/100th the size of Nvidia. Continue »

The total addressable market of urban air mobility could become a trillion-dollar market, which opens an opportunity to invest in its start-ups. One of those start-ups is Archer Aviation (NYSE: ACHR) -- and it very much has the potential to set investors up for life.

Archer stock is still taxiing on the tarmac

Archer is one of the frontrunners in the eVTOL market. It is currently working on certifying its flagship aircraft, Midnight, which could potentially taxi passengers within urban hubs and to and from airports.

Two Archer aircraft on the tarmac.

Image source: Archer Avation.

The bull case for Archer rests on its pushing Midnight successfully to the end of the FAA's regulatory timeline. The company has completed three of the necessary four phases -- it closed phase 3 in April 2026 -- and while it hasn't given a date for when it could hypothetically finish the fourth, it will likely take one to two years.

That said, Archer has been transforming its business profile, from an air taxi company to one with ambitions in defense and broader commercial aviation.

To that end, Archer has recently agreed to acquire three businesses from Boeing (NYSE: BA): Wisk, Insitu, and SkyGrid. Together, these three give Archer more exposure to autonomous eVTOL craft (Wisk), military drones (Insitu), and air traffic management (SkyGrid). Better still, one of these businesses, Insitu, is profitable, with over $200 million in annual revenue generated. For Archer, which brought in about $5 million last quarter, that additional $200 million could be significant to its growing costs.

Speaking of which, quarterly losses for Archer have been widening. That isn't surprising for a company that is spending heavily on certification and expansion, but it does raise the stakes for management's execution. It also raises the possibility that Archer will draw from equity financing, thereby diluting existing shareholders.

Plenty of blue sky ahead

The way to life-changing wealth for Archer investors is, doubtless, an FAA-certified Midnight. From there, Archer will have to scale production to make a fleet of air taxis, with enough aircraft to service major cities in the U.S. This will not happen overnight, and it could be many years before Archer is even generating revenue from its eVTOLs.

Archer is a speculative stock, which is a nice way of saying it lacks a strong business. It has dreams, plans, and big ideas, but no eVTOL or profits. By the same token, if it did have those latter two, the stock would not offer the same high-reward potential that it does today. That's a risk investors will have to accept if they want a shot at the upside.

Should you buy stock in Archer Aviation right now?

Before you buy stock in Archer Aviation, consider this:

The Motley Fool Stock Advisor analyst team just identified what they believe are the 10 best stocks for investors to buy now… and Archer Aviation wasn’t one of them. The 10 stocks that made the cut could produce monster returns in the coming years.

Consider when Netflix made this list on December 17, 2004... if you invested $1,000 at the time of our recommendation, you’d have $421,997!* Or when Nvidia made this list on April 15, 2005... if you invested $1,000 at the time of our recommendation, you’d have $1,413,876!*

Now, it’s worth noting Stock Advisor’s total average return is 978% — a market-crushing outperformance compared to 213% for the S&P 500. Don't miss the latest top 10 list, available with Stock Advisor, and join an investing community built by individual investors for individual investors.

See the 10 stocks »

*Stock Advisor returns as of September 6, 2026.

Steven Porrello has positions in Archer Aviation. The Motley Fool has positions in and recommends Boeing. The Motley Fool has a disclosure policy.

☐ ☆ ✇ CryptoPotato

Bitcoin ETFs Rake In Nearly $1 Billion as Ethereum Funds Keep the Streak Alive

By: Jordan Lyanchev

The spot exchange-traded funds tracking the largest cryptocurrency attracted almost $1 billion in the past week, despite the $236 million in net outflows registered on September 1.

The Ethereum ETFs were also well in the green. They have marked more inflows than outflows for eight out of the past nine weeks.

BTC ETFs See Another $1B in Inflows

The previous business week ended with a $201.81 million net outflow from the spot BTC ETFs, but the overall performance was quite impressive. The inflows in the other four days offset all the losses on Friday, and the week ended with a net gain of $924.48 million. Thus, the funds built on the previous week’s major inflows of $1.92 billion.

August finished with net inflows of $216.70 million, followed by $236.46 million in net outflows on September 1. Investors shifted their stance in the following three days by attracting $101.15 million on Wednesday and $174.60 million on Friday. Thursday was particularly spectacular, as the funds gained $730.87 million, the highest amount since January.

Thus, the total number for the week was $986.85 million, bringing the cumulative net inflows to $55.62 billion. Recall that this number had plummeted to $51.79 billion in mid-August.

BlackRock’s IBIT remains the undisputed leader in the ETF space, with cumulative net assets exceeding $62.6 billion. Fidelity’s FBTC follows suit with $14.07 million, and Grayscale’s larger fund, GBTC, is next with $10.36 billion.

Spot Bitcoin ETFs Net Flows. Source: SoSoValue

ETH ETFs in Green, Too

Given their size, the spot Ethereum ETFs have performed even better over the past several weeks. As mentioned above, they have had only one red week since early July, and even that was quite modest, with just $2.26 million in net inflows back in mid-August.

The financial vehicles gained $824.42 million during the week that ended on August 28, and another $218.41 million in the first week of September. Thursday was once again the most notable day in terms of net inflows, with $141.39 million entering the funds. Another $87.68 million went in on Monday, $10.95 million on Tuesday, and $26.46 million on Friday. The only red day was Wednesday with $48.08 million.

The cumulative total net inflows have skyrocketed from $10.89 billion in early July to $13.19 billion on September 4.

Spot Ethereum ETF Flows. Source: SoSoValue


The post Bitcoin ETFs Rake In Nearly $1 Billion as Ethereum Funds Keep the Streak Alive appeared first on CryptoPotato.

☐ ☆ ✇ Crypto Insiders

Stokoude Bitcoin-wallets ontwaken: €100 wordt €2,7 miljoen

By: Kevin Schijven
Een bitcoin-wallet die bijna vijftien jaar volledig stil lag, is plotseling weer in beweging gekomen. De 40 bitcoin in de wallet waren in 2011 samen nog ongeveer 120 dollar waard. Inmiddels vertegenwoordigen dezelfde munten een waarde van ruim 3 miljoen dollar. En het is niet de enige stokoude wallet die deze week ontwaakt. Alleen belangrijk cryptonieuws. Volg Crypto Insiders gratis via WhatsApp.

In het kort

  • Een wallet uit 2011 heeft na bijna vijftien jaar 40 bitcoin verplaatst.
  • De munten waren destijds ongeveer 120 dollar waard en nu ruim 3 miljoen dollar.
  • In enkele dagen kwamen vier oude wallets in beweging met samen bijna 16 miljoen dollar aan bitcoin.

Bitcoin van 120 dollar wordt miljoenen waard

De wallet ontving de 40 bitcoin in november 2011, toen één bitcoin ongeveer 3 dollar kostte. Daarna bleven de munten bijna vijftien jaar onaangeraakt. Op 3 september kwamen ze volgens gegevens van Galaxy Research plotseling weer in beweging. Dezelfde 40 bitcoin waren toen ongeveer 3,09 miljoen dollar waard, omgerekend zo'n 2,7 miljoen euro. Dat komt neer op een waardestijging van meer dan 2,5 miljoen procent.

Vier stokoude wallets komen tot leven

Het gaat niet om één losse beweging. Tussen 29 augustus en 4 september werden vier bitcoin-wallets actief die al meer dan tien jaar nauwelijks of helemaal niet waren gebruikt. Samen verplaatsten ze 202,84 bitcoin, op dat moment ongeveer 15,7 miljoen dollar waard. De grootste wallet bevatte 146,06 bitcoin en was sinds november 2013 stil. Daarnaast kwamen nog twee wallets uit 2011 in beweging met respectievelijk 10 en 6,78 bitcoin.

Bitcoin naar Coinbase verstuurd

Dit soort bewegingen worden door de markt nauwlettend gevolgd, omdat oude munten mogelijk worden verkocht zodra ze weer in beweging komen. Vooral een transactie naar een cryptobeurs kan daarop wijzen. Dat gebeurde bij één van de vier wallets. De 6,78 bitcoin werden volgens Galaxy Research naar cryptobeurs Coinbase gestuurd. Dat vergroot de kans dat de eigenaar van plan is de munten te verkopen, al is niet bekend of dat daadwerkelijk is gebeurd. Het is bovendien al de tweede golf in korte tijd. Crypto Insiders schreef vorige week al over zes andere oude wallets die in tien dagen samen ruim 40 miljoen dollar aan bitcoin verplaatsten.

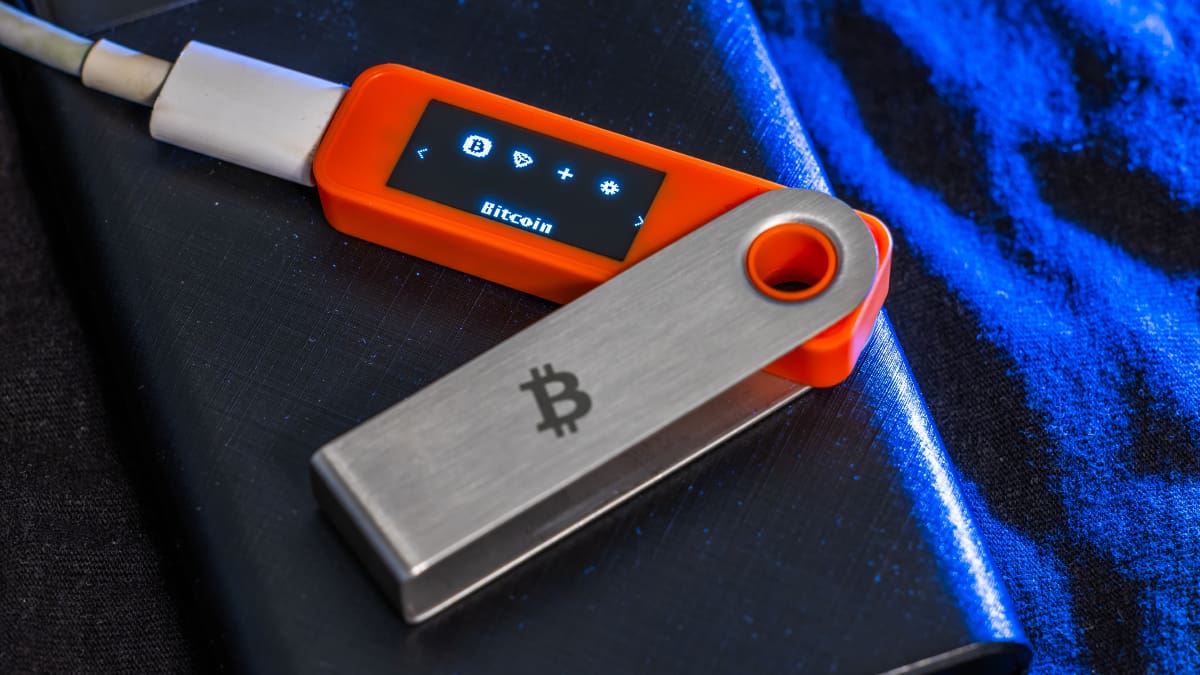
Foto van een Bitcoin wallet

Foto: lucky_pics/Shutterstock

☐ ☆ ✇ CryptoPotato

ZEC Just Hit $1,200: What You Need to Know About Its Meteoric 370% Surge in 3 Months

By: Jordan Lyanchev

It was just three months ago that FUD around Zcash (ZEC) was running rampant, and a vulnerability in its Orchard privacy pool turned the tables and raised some uncomfortable questions.

The situation has taken a major turn, as the protocol patched the issue, and its privacy nature made it arguably the top performer in the large-cap altcoin space in the past three months.

The Meteoric Rise

Recall that the issue was first disclosed by Zcash founder Zooko Wilcox and members of Shielded Labs, who explained that a hacker could have used this weakness to make endless fake ZEC in Orchard, Zcash’s protected transaction area, without getting caught right away. Although by the time they made this public, the vulnerability was fixed, it still pushed some prominent names, such as Arthur Hayes, to dispose of their holdings, citing further potential issues.

The impact on the native token was felt immediately. The asset traded at $650 before the issue became public and tumbled by 60% within a day or so to $260 as FUD was being spread left and right.

That’s when the trend reversed for the privacy coin as it managed to stabilize at around $500, where it spent the next couple of months. The most significant leg up began with the August 19 market-wide breakout that drove it to $900. While the rest of the market stalled following the initial gains, ZEC kept climbing and briefly exceeded $1,200 earlier today for the first time in almost 10 years.

This means that the token has skyrocketed by 370% since the early June low. Its market cap now is above $20 billion, making it bigger than HYPE and DOGE.

ZEC/USD. Source: TradingView

Data from CoinGlass shows that ZEC’s spectacular surge over the past 24 hours has resulted in $46 million in short liquidations, the highest among all cryptocurrencies.

The Drivers and What’s Next

Shortly after the mid-August rally began, Grayscale debuted its Zcash ETF (on August 25), which has already raked in $34.4 million in net inflows.

“The bigger question isn’t whether Zcash can keep going up. It’s whether the ETF era is creating a new pathway for capital to rotate into crypto assets that were previously overlooked. ZEC may be an early test of that thesis,” commented The Wolf of All Streets.

Meanwhile, Ted Pillows noted that a major whale DCA-ed into ZEC between 2022 and 2024, accumulating 22,840 ZEC for about $1.1 million. The position had grown to $23 million by today, when they transferred the entire amount to Binance, potentially to cash in.

Crypto Patel weighed in on ZEC’s price potential, indicating that it has created a “Beautiful Cup & Handle Pattern” on the weekly scale. He added that the asset has broken the Neckline/Resistance of this pattern, which could materialize in another massive surge to $2,200.

As Per $ZEC Chart, you can see a Beautiful Cup & Handle Pattern formed on the Weekly Timeframe.@Zcash has already broken the Neckline/Resistance of this pattern, and if the pattern follows the 100% target, the target could be around $2,200.

No doubt, Cup & Handle is a strong… pic.twitter.com/Eys4EivIHQ

— Crypto Patel (@CryptoPatel) September 6, 2026

The post ZEC Just Hit $1,200: What You Need to Know About Its Meteoric 370% Surge in 3 Months appeared first on CryptoPotato.

☐ ☆ ✇ CoinGape

When Will Bitcoin Price Cross $85k Again?

By: Frank bevah

Bitcoin price traded near $79,972 after gaining 0.43% over 24 hours, keeping the $85,000 test within reach. The crypto market was up 0.98%, with its capitalization at 2.72 trillion and the demand bolstering risk appetite. Solana led major altcoins, rising 4.07% to $106.57, while Ethereum advanced 2.02% to $2,502.82. XRP price climbed 1.23% to $1.42,

The post When Will Bitcoin Price Cross $85k Again? appeared first on CoinGape.

☐ ☆ ✇ CryptoPotato

CLARITY Act Gets a Major Boost, But Another Setback Threatens Its 2026 Passage

By: Jordan Lyanchev

The CLARITY Act received a potentially important boost ahead of its first Senate floor test, which was supposed to take place on September 15, but another scheduling setback is further threatening its chances of becoming law this year.

On the plus side, the National Sheriffs’ Association (NSA) has changed its tune on the landmark crypto market structure bill from opposition to neutral after previously raising concerns that it could make it more difficult for authorities to combat illicit finance involving digital assets.

NSA Turns Neutral

In the filing to the US Senate, the agency said that it believes the appropriate course is to step back and allow the legislative process to continue given the legislation’s complexity and the issues still being negotiated. This change matters because law enforcement concerns had become a major hurdle for some Senate Democrats whose votes could determine whether the bill advances.

Although the NSA’s move doesn’t mean that it now supports the legislation, its shift from opposition to neutrality removes a source of pressure on senators considering voting to advance it. Essentially, it removes another potential obstacle to attracting the Democratic support the bill needs when it reaches the Senate floor later this month.

Recall that the Senate Majority Leader John Thune filed a cloture vote motion to proceed with H.R. 3633 in early August so that the Senate can vote on the bill once recess ends.

The vote requires 60 senators and will not pass the CLARITY Act itself. Instead, success would limit debate on the motion to proceed and move the bill toward formal Senate consideration. Republicans hold 53 seats, meaning that Democratic or independent support will be necessary if the conference votes together.

Another Setback

House Republican leaders canceled voting sessions during the weeks of September 21 and 28, removing eight legislative days from the calendar, and the House is now scheduled to leave Washington on September 17, which is just two days after the Senate’s first procedural vote.

The new calendar leaves no time for the Senate negotiations to begin and conclude before lawmakers turn their attention to the November midterms. That makes a post-election lame-duck session an increasingly realistic path for the legislation if it clears the Senate.

Galaxy Research already reduced its estimated probability that the CLARITY Act will become law in 2026 from 50% to 30% after the Senate failed to vote on it before the August recess. Prediction markets are even less optimistic, with passage odds currently below 20%.

The post CLARITY Act Gets a Major Boost, But Another Setback Threatens Its 2026 Passage appeared first on CryptoPotato.

☐ ☆ ✇ Crypto Insiders

XRP verovert American football-wereld in miljoendeal van Ripple

By: Kevin Schijven
XRP krijgt een prominente plek in de Amerikaanse sportwereld. Sinds dit weekend staat het logo van de cryptomunt van Ripple op het veld van de Florida Gators, het Americanfootballteam van de Universiteit van Florida. De universiteit ontvangt volgens Amerikaanse media jaarlijks miljoenen dollars voor de samenwerking. Duizenden crypto-investeerders krijgen ons nieuws als eerste via WhatsApp. Gratis aanmelden.

In het kort

  • Het XRP-logo staat sinds dit weekend op het speelveld van de Florida Gators.
  • De Universiteit van Florida ontvangt volgens persbureau AP ongeveer 5 miljoen dollar per jaar.
  • Ripple sloot eerder deze zomer al een grote sportdeal met de University of Kansas.

XRP-logo verschijnt op veld in Florida

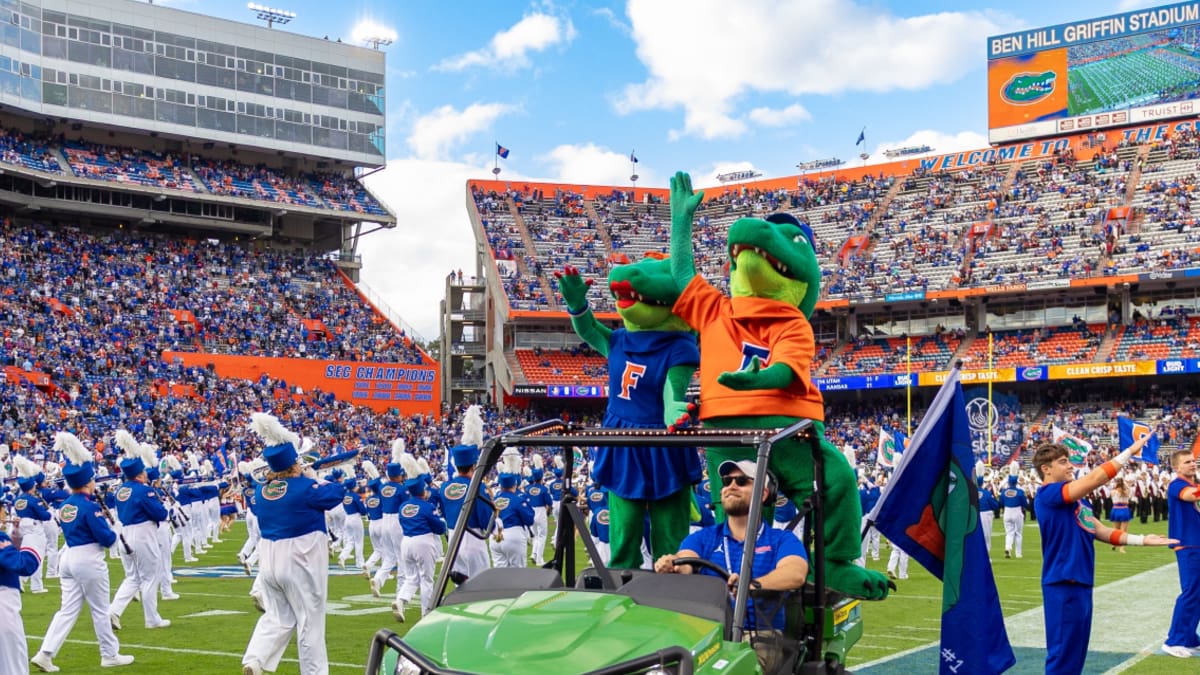
De University of Florida maakte de samenwerking kort voor het weekend bekend. Het XRP-logo is vanaf dit seizoen te zien op het speelveld van het Ben Hill Griffin Stadium, waar het Americanfootballteam Florida Gators zijn thuiswedstrijden speelt. Het logo verscheen gisteren voor het eerst tijdens de wedstrijd tegen Florida Atlantic. XRP krijgt daarnaast aandacht via digitale kanalen en reclame rond evenementen van de universiteit. Ripple en Florida maken zelf niet bekend hoeveel geld met de deal gemoeid is. Volgens persbureau AP ontvangt de universiteit ongeveer 5 miljoen dollar per jaar.

Ripple breidt sportcampagne verder uit

Florida is niet de eerste Amerikaanse universiteit waarmee Ripple dit jaar een grote samenwerking sluit. In juli maakte ook de University of Kansas een meerjarige deal bekend. Daar verschijnt het XRP-logo op de shirts van alle sportteams van de universiteit. Volgens Kansas was dat de eerste keer dat een cryptomunt op de shirts van een groot Amerikaans universiteitssportprogramma verscheen. Met Florida krijgt XRP nu ook een vaste plek op het speelveld tijdens wedstrijden. De samenwerking gaat bovendien verder dan alleen reclame. Ripple gaat ook financiële en technologische educatie ondersteunen voor studenten en sporters van de universiteit, waaronder lessen over digitale activa.

Ripple brengt XRP naar groter publiek

Met de nieuwe sportdeals probeert Ripple vooral de naam XRP ook buiten de cryptowereld onder de aandacht te brengen. Bij Florida draait het vooralsnog puur om sponsoring en educatie. Er is niet aangekondigd dat de universiteit XRP bijvoorbeeld voor betalingen gaat gebruiken. Vrijdag schreef Crypto Insiders nog over een forse koersstijging van XRP en een nieuwe proef op de XRP Ledger.

Foto van Ben Hill Griffin Stadium

Foto: D'Avril Grant/Shutterstock

☐ ☆ ✇ The Motley Fool

NuScale Stock Is Down 83% -- Bargain or Trap? The Honest Answer Will Surprise You.

By: newsfeedback@fool.com (Steven Porrello)

Key Points

  • NuScale stock has fallen sharply on a spate of negative news.

  • The company lacks a firm first sale, has lost a big long-term shareholder, and is burning cash.

  • The stock is a high-risk, high-reward play on the future of power, and it might not be the right investment for every investor.

NuScale Power's (NYSE: SMR) stock has plummeted, to say the least. Put differently, NuScale investors who bought shares at its 52-week high of $57 have seen their investment drop about 83%. That's enough to make anyone, whatever their risk tolerance, lose their patience.

NuScale now trades at a sub-$10 price, yet it still carries a roughly $4 billion market cap. That puts this small modular reactor (SMR) developer in the mid-cap range, even though its business, unproven and unprofitable, looks more like an early-stage start-up than a mid-sized company.

Missed Nvidia in 2009? This Rare Signal Is Flashing Again. In 2009, a "Double Down" signal flashed for a little-known chipmaker called Nvidia. For the first time in years, that same "Total Conviction" signal is flashing for a company 1/100th the size of Nvidia. Continue »

I would not, therefore, call NuScale a bargain; nor, however, would I call it a trap.

SMR plant with modules against a blue background.

Image source: Getty Images.

I would call NuScale a beaten-down nuclear stock, one that was formerly riding highs on a purely emotional wave of exuberant speculation, and is now trading closer to its actual value -- perhaps still even above its actual value -- due to a torrent of negative news and investor impatience.

That negative news includes:

  • Having almost no revenue (about $75,000 last quarter).
  • The loss of its longtime shareholder, Fluor.
  • The lack of a firm first sale.
  • A massive $750 million share sale that could further dilute shareholders.

Add to that a $506 million milestone payment to its partner, ENTRA1 Energy, for setting up a potential deployment of NuScale's SMRs with Tennessee Valley Authority (TVA), and it's surprising this stock still trades in the mid-cap range.

True, a lot of negative news has already been priced in, which could create an outsize reaction should any positive news emerge. But if investors are looking at NuScale in the long term, an uncomfortable amount of uncertainty continues to obscure any proper perspective on its true value.

At the end of the day, NuScale is a high-risk, high-reward play on nuclear energy. If you're at all averse to that risk, a nuclear energy exchange-traded fund (ETF) could help you capitalize on the same trend with broader exposure.

Should you buy stock in NuScale Power right now?

Before you buy stock in NuScale Power, consider this:

The Motley Fool Stock Advisor analyst team just identified what they believe are the 10 best stocks for investors to buy now… and NuScale Power wasn’t one of them. The 10 stocks that made the cut could produce monster returns in the coming years.

Consider when Netflix made this list on December 17, 2004... if you invested $1,000 at the time of our recommendation, you’d have $421,997!* Or when Nvidia made this list on April 15, 2005... if you invested $1,000 at the time of our recommendation, you’d have $1,413,876!*

Now, it’s worth noting Stock Advisor’s total average return is 978% — a market-crushing outperformance compared to 213% for the S&P 500. Don't miss the latest top 10 list, available with Stock Advisor, and join an investing community built by individual investors for individual investors.

See the 10 stocks »

*Stock Advisor returns as of September 6, 2026.

Steven Porrello has no position in any of the stocks mentioned. The Motley Fool recommends NuScale Power. The Motley Fool has a disclosure policy.

☐ ☆ ✇ CoinGape

XRP Price as CLARITY Act Faces Another Senate Delay

By: Frank bevah

XRP price traded near $1.42 on Sunday, gaining 0.71% as cryptocurrency markets steadied after a volatile week. Bitcoin price hovered at around $79,973, and Ethereum was at $2,499 as the market awaits the FOMC meeting on September 15-16th. Nevertheless, XRP remained vulnerable to Washington politics with another Senate postponement of the CLARITY Act. The legislation

The post XRP Price as CLARITY Act Faces Another Senate Delay appeared first on CoinGape.

☐ ☆ ✇ Crypto Insiders

Berlijn betaalt geen Bitcoin losgeld: staatsgeheimen nu op straat

By: Kevin Schijven
Een enorme cyberaanval op de overheid van Berlijn krijgt een steeds ernstiger staartje. Hackers stalen miljoenen bestanden en eisten vervolgens 30 bitcoin om de gegevens niet vrij te geven. Berlijn weigerde te betalen. Nu de buit op het darkweb is gepubliceerd, blijkt hoe gevoelig sommige informatie is. Het belangrijkste cryptonieuws direct op je telefoon? Ontvang onze updates gratis via WhatsApp.

In het kort

  • Hackers stalen 1,44 miljoen bestanden van de overheid van Berlijn.
  • Ze eisten 30 bitcoin, omgerekend ongeveer 2 miljoen euro.
  • De gelekte informatie gaat mogelijk ook over belangrijke infrastructuur en defensie.

Hackers eisen 30 bitcoin van Berlijn

De hackers kregen tussen 7 en 12 augustus ongemerkt toegang tot delen van het computernetwerk van de Berlijnse overheid. Daarbij werden 1,44 miljoen bestanden buitgemaakt, samen goed voor ongeveer 5,8 terabyte aan gegevens. De groep achter de aanval, Rhysida, zette de gestolen gegevens vervolgens op het darkweb in een veiling. Het minimumbod bedroeg 30 bitcoin, toen ongeveer 2 miljoen euro waard. Berlijn weigerde te betalen. Nadat het ultimatum op 4 september afliep, publiceerde Rhysida de volledige dataset op het darkweb.

Zeer gevoelige informatie buitgemaakt

Nu de enorme hoeveelheid bestanden wordt doorgespit, wordt steeds duidelijker wat er is gelekt. Daar zitten persoonsgegevens van overheidsmedewerkers tussen, maar mogelijk ook veel gevoeligere informatie. Volgens Duitse media zijn bestanden gevonden over onder meer waterwerken, energievoorzieningen, gevangenissen en defensiebedrijven. Ook gegevens over het Duitse leger zouden zijn gelekt. Der Spiegel trof bovendien meer dan 550 bestanden aan over de uitbreiding van het Duitse kanseliersgebouw. De Duitse autoriteiten onderzoeken nog welke informatie precies is buitgemaakt en hoe groot de veiligheidsrisico's zijn.

Autoriteiten waarschuwen voor misbruik

Het Duitse cybersecuritybureau BSI waarschuwt dat informatie over belangrijke infrastructuur in verkeerde handen kan worden misbruikt. Gelekte persoonsgegevens kunnen daarnaast worden ingezet voor identiteitsfraude en zeer gerichte phishingaanvallen. Berlijn heeft daarom een extra coördinatieteam opgericht dat de bestanden beoordeelt en getroffen mensen en organisaties moet informeren. Ook in de cryptowereld spelen de risico's van gestolen persoonsgegevens. Eerder deze week bleek nog dat gegevens van ruim 80.000 klanten van bitcoinwallet Trezor waren gelekt. Ook daar werd gewaarschuwd voor gerichte oplichting.

Stadhuis Berlijn In de nacht

Foto: ColorMaker/Shutterstock

☐ ☆ ✇ CryptoPotato

Arbitrum (ARB) Rockets by 42% Daily, Bitcoin (BTC) Fights for $80K: Weekend Watch

By: Jordan Lyanchev

As with most previous weekends, this one is also quite sluggish for bitcoin, which continues to fight for $80,000 without making any major moves.

The same cannot be said for some altcoins, though. ZEC, for example, has skyrocketed by 17% daily, while ARB has stolen the show with a massive 42% surge.

BTC Fights for $80K

The primary cryptocurrency closed August (on Monday) in the green for the first time in a bear market, surging by over 25% for the month. This came even after its early Monday retracement from $79,000 to $77,000 as the US and Iran resumed the strikes against each other.

Bitcoin rebounded to $79,000 rather quickly, but it was rejected on Tuesday and driven south to under $76,500 by Wednesday. That’s when the bulls returned in full force, initiating a major leg up that drove the asset to $82,400. This became BTC’s highest price tag since mid-May.

However, the strong US jobs report from Friday led to a major decline, as bitcoin slipped by three grand as the odds for the Fed to hike the rates skyrocketed. Nevertheless, BTC managed to rebound from the drop to $78,600 and jumped to around $80,000, where it spent most of the weekend, even though the amount of bearish news that should push it south has risen significantly in the past week.

Its market capitalization is back at $1.6 trillion on CMC, while its dominance over the alts has declined slightly to 59.1%.

BTCUSD September 6. Source: TradingView

ZEC, ARB on a Roll

Ethereum has neared $2,500 again after a 1.75% increase daily. BNB, which touched $770 yesterday, is below $760 now, while XRP has defended the $1.40 support. SOL is well above $100 once again, and similar gains are evident from the likes of HYPE, DOGE, RAIN, XMR, LINK, and ADA.

Uniswap’s UNI has jumped to $7 after a 10% increase, while ZEC is close to $1,200 for the first time in almost a decade following a major 17% jump. Arbitrum’s native token has stolen the show, surging by 42% to over $0.19.

The total crypto market cap remains at just over $2.7 trillion on CMC after a 0.8% increase since yesterday.

Cryptocurrency Market Overview September 6. Source: QuantifyCrypto


The post Arbitrum (ARB) Rockets by 42% Daily, Bitcoin (BTC) Fights for $80K: Weekend Watch appeared first on CryptoPotato.

☐ ☆ ✇ Crypto Insiders

Zcash maakt spectaculaire comeback en stormt de top 10 binnen

By: Kevin Schijven
Zcash maakt een opvallend comeback en keert na jaren weer terug naar de top 10 van grootste cryptomunten ter wereld. De zogenoemde privacymunt schoot vannacht opnieuw hard omhoog en staat volgens CoinGecko inmiddels op plek negen. Van breaking news tot opvallende koersbewegingen: 27.000 Nederlanders volgen ons op Instagram.

In het kort

  • Zcash stijgt vandaag ongeveer 16 procent en klimt naar plek negen.
  • Bijna 40 miljoen dollar aan shortposities werd in twaalf uur geliquideerd.
  • In een jaar tijd is de Zcash-koers bijna 2.700 procent gestegen.

Zcash breekt opnieuw uit

Zcash is de afgelopen 24 uur opnieuw met bijna 17 procent gestegen. De koers staat bovendien 38,5 procent hoger dan een week geleden, 132 procent hoger dan een maand geleden en maar liefst 2.695 procent hoger dan een jaar geleden. De stijging kwam vannacht in twee duidelijke sprongen. Eerst brak Zcash door de oude top rond 1.050 dollar, die vrijdag nog voor weerstand zorgde. Daarna sprong de koers door naar ongeveer 1.175 dollar. Op het moment van schrijven stijgt de koers zelfs verder naar 1.199 dollar, de hoogste prijs sinds 2017. Rond 1.200 dollar wordt echter opnieuw weerstand verwacht.

Short squeeze geeft rally extra vaart

De rally kreeg in augustus al een belangrijke impuls door de komst van een Amerikaans beursfonds voor Zcash. In aanloop naar de lancering steeg ZEC in enkele dagen van minder dan 600 dollar tot boven de 800 dollar. Op 25 augustus ging het Zcash-fonds van Grayscale daadwerkelijk naar de beurs. De stijging wordt sindsdien extra versterkt door handelaren die op een koersdaling inzetten. Toen Zcash vrijdag door 1.000 dollar brak, werd al voor ongeveer 34,5 miljoen dollar aan shortposities geliquideerd. Vannacht gebeurde dat opnieuw. Volgens CoinGlass werd in twaalf uur voor 38,92 miljoen dollar aan Zcash-posities geliquideerd. Maar liefst 37,33 miljoen dollar daarvan waren shorts. De liquidaties bereikten tussen 06.00 en 07.00 uur hun piek, tegelijk met de grootste koerssprong van de nacht.

Cryptomunt keert terug naar de top

Zcash is een zogeheten privacy coin. Bij veel cryptomunten kan iedereen transacties op de blockchain bekijken. Zcash geeft gebruikers juist de mogelijkheid om gegevens zoals de verzender, ontvanger en het bedrag af te schermen. Juist die privacyfunctie zorgt ook voor problemen in Europa. Zcash is op veel Europese handelsplatforms niet meer beschikbaar, omdat toezichthouders strengere eisen stellen aan dit soort munten. Het bereiken van de negende plek maakt de huidige rally extra bijzonder. Zcash behoorde in 2017 nog tot de grootste cryptomunten op markt, maar verdween daarna jarenlang uit de top. Nu staat de munt met een marktwaarde van bijna 20 miljard dollar weer tussen de tien grootste cryptomunten ter wereld.

Social-artikel Roan - man groene grafiek

☐ ☆ ✇ The Motley Fool

Stock Market Investors Just Got a Warning From the Federal Reserve. History Says This Will Happen Next.

By: newsfeedback@fool.com (Trevor Jennewine)

Key Points

  • The Federal Reserve recently warned investors that the S&P 500's equity risk premium was near its lowest level since the dot-com bubble.

  • The S&P 500's low equity risk premium means Treasury bonds are more attractive on a relative basis than they have been in decades.

  • Three Fed officials wanted to raise interest rates in July, and new rate-hiking cycles have often coincided with stock market corrections.

The S&P 500 (SNPINDEX: ^GSPC) and Nasdaq Composite (NASDAQINDEX: ^IXIC) have added 13% and 14%, respectively, this year. The driving force behind those gains has been strong corporate earnings growth, particularly among technology companies.

However, the Federal Open Market Committee recently published the minutes from its July meeting, and they included a warning for investors: The S&P 500's equity risk premium is near its lowest level since the dot-com bubble, which means Treasury bonds are more attractive on a relative basis than they have been for decades.

Missed Nvidia in 2009? This Rare Signal Is Flashing Again. In 2009, a "Double Down" signal flashed for a little-known chipmaker called Nvidia. For the first time in years, that same "Total Conviction" signal is flashing for a company 1/100th the size of Nvidia. Continue »

History says that could sink the stock market.

A downward-trending red arrow overlaid on U.S. currency styled to look like a grid.

Image source: Getty Images.

The Federal Reserve warns that the stock market's equity risk premium is near historic lows

Equity risk premiums measure the extra return investors anticipate for purchasing stocks rather than risk-free assets, such as U.S. Treasury bonds. The Federal Reserve calculates the S&P 500's equity risk premium by subtracting the real 10-year Treasury yield from the index's forward earnings yield.

To elaborate, the real 10-year Treasury yield is the nominal yield minus the forecast inflation rate, so it measures the expected increase in purchasing power. And the forward earnings yield is the inverse of the forward price-to-earnings ratio, so it measures forecast earnings (as a percentage) per dollar invested.

Minutes from the Federal Open Market Committee's (FOMC) July meeting state:

The staff judged that asset valuation pressures were elevated. Equity valuations remained high despite some moderation from year-end, supported by AI enthusiasm and strong corporate profits. The equity premium was at a level that has only been lower in recent history during the dot-com bubble.

What does that mean? The Federal Reserve is warning investors that stocks are expensive when compared to real 10-year Treasury yields. Specifically, the excess return investors can expect from owning stocks rather than risk-free Treasury bonds is lower today than it has been since the dot-com bubble.

Additionally, the S&P 500 has maintained an equity risk premium below 2.5% for five straight months. That last happened in May 2002, and the S&P 500 declined 16% over the subsequent year.

Several Federal Reserve officials wanted to raise interest rates at the July meeting

In July, the Personal Consumption Expenditure (PCE) price index, the Fed's preferred inflation gauge, increased 3.7% from the previous year. Inflation now hovers at levels last seen in early 2023, and the FOMC attributed that to three things: President Donald Trump's tariffs, elevated energy prices tied to the Iran war, and demand for artificial intelligence.

The FOMC held interest rates steady at the July meeting even though PCE inflation has now topped the Fed's 2% target for 65 months. However, three officials voted for a quarter-point rate hike, up from zero in June, which itself was a change from April, when one FOMC member actually voted for a quarter-point rate cut.

An increasingly hawkish Fed, coupled with stubborn inflation, has the market convinced that rate hikes are inevitable. CME Group's FedWatch tool, which calculates the probability of future interest rates using pricing data from futures contracts, shows the most likely outcome is a quarter-point hike in September 2026 followed by another quarter-point hike in January 2027.

If the Fed raises rates, it will be the first hike in a new tightening cycle. The stock market has often suffered corrections under those circumstances. In the last 30 years, the S&P 500 and Nasdaq Composite have fallen by an average of 10% and 12%, respectively, at some point during the three-month period following the first rate hike in a new tightening cycle.

However, there is a silver lining for patient investors. The stock market has eventually recouped its losses from every past correction, which means every single one has been a buying opportunity.

Should you buy stock in S&P 500 Index right now?

Before you buy stock in S&P 500 Index, consider this:

The Motley Fool Stock Advisor analyst team just identified what they believe are the 10 best stocks for investors to buy now… and S&P 500 Index wasn’t one of them. The 10 stocks that made the cut could produce monster returns in the coming years.

Consider when Netflix made this list on December 17, 2004... if you invested $1,000 at the time of our recommendation, you’d have $421,997!* Or when Nvidia made this list on April 15, 2005... if you invested $1,000 at the time of our recommendation, you’d have $1,413,876!*

Now, it’s worth noting Stock Advisor’s total average return is 978% — a market-crushing outperformance compared to 213% for the S&P 500. Don't miss the latest top 10 list, available with Stock Advisor, and join an investing community built by individual investors for individual investors.

See the 10 stocks »

*Stock Advisor returns as of September 6, 2026.

Trevor Jennewine has no position in any of the stocks mentioned. The Motley Fool has positions in and recommends CME Group. The Motley Fool has a disclosure policy.

☐ ☆ ✇ The Motley Fool

The 2027 Social Security COLA Is Coming Into Focus: How Inflationary Trump-Era Policies Could Push Social Security Benefits Higher Next Year

By: newsfeedback@fool.com (Adam Levy)

Key Points

We're just a few weeks away from learning one of the most important numbers that will affect the finances of more than 71 million Americans in 2027. The annual Social Security cost-of-living adjustment, or COLA, for next year will be determined on Oct. 14 this year.

The COLA is designed to offset the impact of inflation on monthly Social Security benefits, ensuring that retirees and people with disabilities have enough to help make ends meet. President Donald Trump has enacted several policies that have affected Social Security, but several inflationary policy decisions made since he took office in early 2025 could have a notable impact on the 2027 COLA. In fact, next year's COLA could be one of the highest during the past 15 years.

Missed Nvidia in 2009? This Rare Signal Is Flashing Again. In 2009, a "Double Down" signal flashed for a little-known chipmaker called Nvidia. For the first time in years, that same "Total Conviction" signal is flashing for a company 1/100th the size of Nvidia. Continue »

Here's what it means for Social Security beneficiaries.

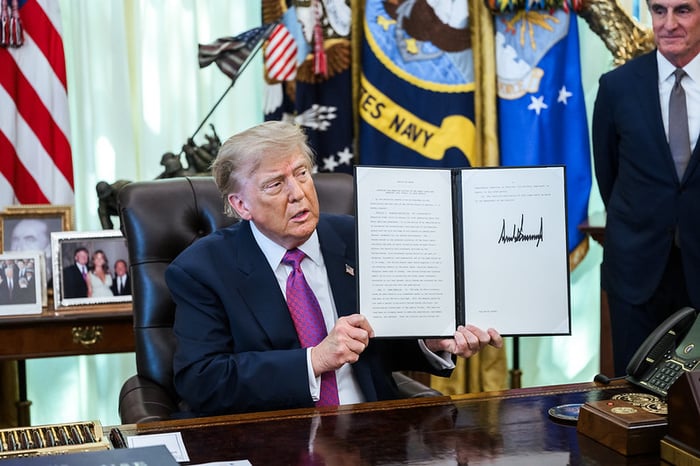
President Trump in the Oval Office holding up an executive order.

Image source: Official White House. Photo by Molly Riley.

Trump's policies added to inflation

The annual COLA is based on a measure of inflation known as the CPI-W. The CPI-W tracks a basket of goods that represent the average spending of an urban wage earner or clerical worker in the U.S. It's slightly different than the more commonly reported CPI-U, which is meant to cover a broader group of all urban consumers.

The Social Security Administration uses the average year-over-year increase in the CPI-W reading during the third quarter of each year to determine the COLA for the following year. That means it won't determine the exact COLA until the September reading is released on Oct. 14.

We currently have only one of the three data points needed to determine the COLA, and the next one will arrive on Sept. 11. So far, Trump's policies have had a noticeable impact on inflation this year, which could lead to a substantial COLA.

The first policy driving inflation higher is the president's tariffs. Although the administration's initial wave of tariffs took effect more than a year ago, they're still pushing up prices. That's despite the Supreme Court striking down those tariffs as illegal. Many businesses waited to pass on the increased costs to consumers, but now that they have, they're not rolling back prices.

Trump has continued to find new ways to impose tariffs on many goods, and he recently imposed steep tariffs on Canadian imports. Those tariffs took effect in August and could affect prices and inflation measures in September.

The second major policy decision affecting inflation is the unresolved Iran war, launched by Trump at the end of February. The attacks led Iran to restrict navigation through the Strait of Hormuz, cutting off global oil supply as well as key chemicals and materials shipped through the strait. That increased prices across the board, as energy is a necessary input for almost everything in the economy.

The U.S. and Iran have recently escalated the conflict, a trend already reflected in oil futures and gas prices. That could lead to a higher-than-anticipated inflation reading in September.

The 2027 COLA could be another big one

There are several expert projections for next year's COLA to consider. But as we get more data, the range of possible outcomes is narrowing.

The Federal Reserve Bank of Cleveland provides a forecast of inflation for the current month (and the previous month if it hasn't yet been reported). While it focuses on the CPI-U, the CPI-W reading typically moves in line with the broader reading. Its current forecast calls for inflation to climb 3.4% in both August and September. If that proves accurate, the 2027 COLA will likely be 3.4%.

That projection is in line with analyst Mary Johnson's expectations after digesting July inflation numbers. She had previously projected 3.7% in July but just 1.2% at the start of the year.

The AARP projects the COLA could come in at 3.5%, suggesting faster price increases in August and September than in July. And the Senior Citizens League estimates the 2027 COLA could be 3.6%. That's up from its January projection of 2.6%.

Even if the COLA comes in at the low end of those projections, it's set to be the fourth-highest annual increase since 2010. At the high end, it will tie for third. Only 2022 and 2023, when the country experienced a burst of intense inflation, would be higher.

But as anyone who's dealing with higher prices today knows, a big COLA isn't all it's cracked up to be. Social Security beneficiaries have to deal with accelerating inflation today before they receive the commensurate benefits boost next year. That can add a lot of financial strain. Beneficiaries should hope for policies that lead to slow, stable inflation, something we haven't seen in years.

The $23,760 Social Security bonus most retirees completely overlook

If you're like most Americans, you're a few years (or more) behind on your retirement savings. But a handful of little-known "Social Security secrets" could help ensure a boost in your retirement income.

One easy trick could pay you as much as $23,760 more... each year! Once you learn how to maximize your Social Security benefits, we think you could retire confidently with the peace of mind we're all after. Join Stock Advisor to learn more about these strategies.

View the "Social Security secrets" »

The Motley Fool has a disclosure policy.

☐ ☆ ✇ The Motley Fool

If a Stock Market Crash Is Coming, History Says Investors Who Make This Simple Move Will Win

By: newsfeedback@fool.com (Trevor Jennewine)

Key Points

  • The S&P 500 and Nasdaq Composite have recorded double-digit gains in 2026, but the stock market faces headwinds related to inflation and midterms.

  • Following the first rate hike in a tightening cycle, the S&P 500 and Nasdaq have usually fallen into stock market correction territory at some point in the next three months.

  • Since 2010, following the first close in correction territory, the S&P 500 and Nasdaq have gained an average of 18% and 21%, respectively, in the next year.

Year to date, the broad-based S&P 500 (SNPINDEX:^GSPC) has advanced 13%, and the technology-heavy Nasdaq Composite (NASDAQINDEX:^IXIC) has added 14%. But the next stock market downturn is only a matter of time.

In the near term, elevated oil prices tied to the Iran conflict, potential interest rate hikes, soaring bond yields, and midterm elections are sources of uncertainty that could drag stocks lower (or even cause a market crash). But history says investors will profit from the next correction if they make one simple move.

Missed Nvidia in 2009? This Rare Signal Is Flashing Again. In 2009, a "Double Down" signal flashed for a little-known chipmaker called Nvidia. For the first time in years, that same "Total Conviction" signal is flashing for a company 1/100th the size of Nvidia. Continue »

Here are the important details.

Red financial trading chart with falling prices and sell signals

Image source: Getty Images.

Why the stock market is vulnerable to a downturn

The U.S. stock market is vulnerable to a drawdown (perhaps even a crash) for several reasons. First, President Trump's tariffs and high energy prices tied to the Iran war have caused inflation to accelerate. At the same time, the Federal Reserve has become increasingly hawkish. Three FOMC members voted for rate hikes at the July meeting, up from zero at the June meeting.

So what? If the Fed raises interest rates, it would mark the first rate hike in a new tightening cycle, and the major stock market indexes have frequently suffered corrections under those conditions. In the last 30 years, following the first hike in a cycle, the S&P 500 and Nasdaq Composite declined by an average of 11% and 14%, respectively, at some point during the next year.

Second, a combination of factors -- expectations for higher interest rates, an abundance of corporate bonds issued by artificial intelligence companies, and concerns about national debt -- have led investors to sell Treasury bonds, driving yields higher. The 30-year Treasury bond has paid more than 5% for 44 straight trading sessions, the longest stint since 2007.

So what? Treasury bonds look increasingly attractive relative to equities as payouts increase, and the longer yields remain elevated, the more likely investors are to move money from stocks to bonds. The last time 30-year Treasury bonds yielded over 5% for 44 straight trading sessions, the S&P 500 and Nasdaq Composite fell 17% and 14%, respectively, over the next year.

Third, the president's party tends to lose congressional seats during midterm elections, which creates policy uncertainty that weighs on the stock market. Since 1950, the S&P 500 has declined by an average of 18% at some point during midterm election years, and those loses typically materialized in the third quarter, according to Carson Investment Research.

History says investors who buy the dip during a stock market correction will profit

The S&P 500 suffered six market corrections in the last decade, and two of them eventually became bear markets. However, following the index's first close in correction territory (i.e., the day it first closed 10% below its high), the S&P 500 returned an average of 18% over the next year and it added 40% over the next two years.

Similarly, the Nasdaq Composite suffered nine market corrections in the last decade, and four of them eventually became bear markets. However, following the index's first close in correction territory, the Nasdaq returned an average of 21% over the next year and it added 39% over the next two years.

The one thing investors should not do is attempt to time the market by selling stocks with the intention of buying them back at some point in the future. Legendary fund manager Peter Lynch once warned, "Far more money has been lost by investors in preparing for corrections, or anticipating corrections, than has been lost in corrections themselves."

Here's the big picture: Stock market declines are inevitable, but the S&P 500 and Nasdaq Composite have eventually recouped their losses from every past drawdown. In that sense, every past decline has been a good opportunity for investors to buy shares of index funds that track the S&P 500 or Nasdaq. Anyone who followed that advice in the past turned a profit, and there is no reason to expect a different outcome in the future.

Should you buy stock in S&P 500 Index right now?

Before you buy stock in S&P 500 Index, consider this:

The Motley Fool Stock Advisor analyst team just identified what they believe are the 10 best stocks for investors to buy now… and S&P 500 Index wasn’t one of them. The 10 stocks that made the cut could produce monster returns in the coming years.

Consider when Netflix made this list on December 17, 2004... if you invested $1,000 at the time of our recommendation, you’d have $421,997!* Or when Nvidia made this list on April 15, 2005... if you invested $1,000 at the time of our recommendation, you’d have $1,413,876!*

Now, it’s worth noting Stock Advisor’s total average return is 978% — a market-crushing outperformance compared to 213% for the S&P 500. Don't miss the latest top 10 list, available with Stock Advisor, and join an investing community built by individual investors for individual investors.

See the 10 stocks »

*Stock Advisor returns as of September 6, 2026.

Trevor Jennewine has no position in any of the stocks mentioned. The Motley Fool has no position in any of the stocks mentioned. The Motley Fool has a disclosure policy.

☐ ☆ ✇ CryptoPotato

Bitcoin at $80K Is Stronger Than It Looks: BTC Is Surviving a Perfect Storm of Bearish News

By: Jordan Lyanchev

Bitcoin tried and failed on several occasions to decisively break above the crucial $80,000 level, but perhaps the more important question is why it hasn’t dumped much further.

After all, the macro landscape is anything but bullish given the renewed attacks between the US and Iran, the hawkish Fed, and the surprisingly strong jobs data.

BTC Should Be Hurting

The latest geopolitical developments arrived this weekend as the two warring parties exchanged fresh attacks after Iran’s Revolutionary Guard launched ballistic missiles against two US Navy vessels. The US subsequently struck three Iranian crude oil carriers, while the Middle Eastern country also targeted tankers and US-linked vessels in waters around the Strait of Hormuz.

The escalation matters far beyond geopolitics as Brent crude climbed toward $100 per barrel again amid renewed concerns about energy supplies. Higher oil prices can directly feed into inflation, making the Federal Reserve’s decision next week even harder.

The US central bank has become another issue for BTC. Chair Kevin Warsh adopted a distinctly more hawkish tone at Jackson Hole last week, emphasizing that inflation remains too high and that the Fed could still have “work to do.”

The odds for a September rate hike jumped after the speech and went even higher after Friday’s jobs report. It showed that the US economy added 162,000 jobs in August, almost triple expectations of 56,000, while unemployment remained unchanged at 4.1%.

Although that’s good news for the economy, risk assets do not benefit as the hope for easier monetary policy fades given the higher inflation.

September rate hike odds jumped to 65% at their peak. The two-year Treasury yield reached its highest level since January 2025, the greenback strengthened, and stocks came under pressure.

Bitcoin dropped by $3,000 initially, but rebounded swiftly.

Absorbing Bad News

All of the above creates an atmosphere highly unfavorable for risk-on assets like BTC. Yet it remains at $80,000 even during the weekend when the attacks in the Middle East resumed, and it’s up roughly 25% over the past month.

Part of the explanation for why the cryptocurrency has performed so well comes from the ETF performance. The funds continue to attract significant amounts, with Thursday being a prime example. Over $730 million entered the ETFs, the highest single-day level since January.

What’s even more impressive is that gold has lost a significant portion of its gains charted after the mid-August rally, while BTC holds strong. However, this doesn’t guarantee that BTC cannot fall. In fact, there are two major threats in the next 10 days or so.

First, it’s the CPI, which arrives on September 11. A hotter-than-expected inflation reading, especially after the rise in oil prices, could push expectations for a rate hike even further.

Then it’s the conclusion of the FOMC meeting on September 16. An increase in the rates combined with hawkish guidance from Warsh could finally push BTC through key support levels, as discussed yesterday.

The post Bitcoin at $80K Is Stronger Than It Looks: BTC Is Surviving a Perfect Storm of Bearish News appeared first on CryptoPotato.

☐ ☆ ✇ Crypto Insiders

Rabobank speelt dubbelspel en zet in op 2 paarden in crypto-strijd

By: Kevin Schijven
Rabobank kondigde deze week aan dat het mee helpt aan een nieuwe cryptomunt die gekoppeld wordt aan de dollar. Tegelijk maakt de Nederlandse bank deel uit van Qivalis, een groep banken dat een vergelijkbare munt in euro’s ontwikkelt. Dat lijkt tegenstrijdig. Rabobank steunt daarmee zowel een Europees antwoord op de dominantie van de dollar als een nieuw project dat juist met de dollar begint. De bank zit daarmee aan beide kanten van een strijd om welk digitaal geld straks door banken en bedrijven wordt gebruikt. Ontvang net als duizenden Nederlanders cryptonieuws direct op je telefoon door de gratis Crypto Insiders app.

In het kort

  • Rabobank doet mee aan twee afzonderlijke plannen voor nieuwe digitale munten in dollars en euro’s.
  • De euromunt van Qivalis moet Europa juist minder afhankelijk maken van digitale dollars.
  • Rabobank is daardoor betrokken bij twee projecten die met elkaar kunnen concurreren.

Rabobank kiest voor euro én dollar

Rabobank richt samen met twintig andere financiële instellingen een bedrijf op dat zogenoemde stablecoins gaat uitgeven. Een stablecoin is een cryptomunt die ongeveer dezelfde waarde probeert te houden als bijvoorbeeld de dollar of euro. Een munt gekoppeld aan de dollar hoort dus rond één dollar waard te blijven. Daarvoor worden reserves aangehouden. De nieuwe groep begint eerst met een dollar-stablecoin. Later wil het bedrijf ook aparte munten uitbrengen die gekoppeld zijn aan andere grote valuta, waaronder de euro. Dat meldt Rabobank zelf. Rabobank maakt echter sinds mei ook deel uit van Qivalis. Crypto Insiders schreef toen al over de toetreding van Rabobank en ABN AMRO. Inmiddels zijn 37 financiële instellingen uit vijftien Europese landen aangesloten, waaronder ING.

Euromunt moet tegenwicht bieden aan dollar

Qivalis richt zich juist op de euro. Volgens het bankenconsortium is slechts 0,2 procent van alle stablecoins die wereldwijd in omloop zijn gekoppeld aan de euro. De markt wordt dus vrijwel volledig gedomineerd door digitale munten in dollars. Met zijn eigen euromunt wil Qivalis die afhankelijkheid verkleinen. Rabobank zegt zelf dat Qivalis kan helpen om de positie van de euro in het digitale financiële systeem te versterken. Tegelijk helpt Rabobank dus een andere groep bij het uitbrengen van juist een nieuwe dollar-stablecoin.

Concurreert Rabobank met zichzelf?

Waarschijnlijk niet rechtstreeks. Qivalis en het nieuwe internationale initiatief zijn twee aparte bedrijven en Rabobank geeft de munten niet zelf uit. Toch kan de dubbele rol van de bank tot botsende belangen leiden. Volgens Reuters zijn de twee groepen namelijk concurrenten. Wat goed is voor het ene project, kan daardoor uiteindelijk nadelig zijn voor het andere. Qivalis wil juist de dominantie van de dollar-stablecoins tegen gaan met zijn euro-antwoord terwijl Rabobank ook mee helpt aan een dollar-stablecoin. Hoe Rabobank daarmee om wil gaan, heeft de bank niet toegelicht. Mogelijk wil het slechts zijn kansen spreiden. Qivalis wil zijn euromunt in de tweede helft van 2026 lanceren en wacht nog op goedkeuring van De Nederlandsche Bank. De andere groep wil in 2027 beginnen met zijn dollar-stablecoin.

Rabobank

Foto: PixelBiss/Shutterstock

☐ ☆ ✇ CryptoPotato

Bitcoin’s Link to Gold Hits a 6-Year High as Tech Correlation Fades: Why It Matters

By: Jordan Lyanchev

The correlation between the leading cryptocurrency and the largest financial asset, gold, has climbed to its highest level since the 2020 pandemic, while its relationship with the Nasdaq has weakened significantly.

The shift comes as concerns about debt, deficits, and currency debasement return to the spotlight after the latest developments in the US.

Closer to Gold

The change started to occur following the mid-August rally, which was propelled by the US Treasury Department’s announcement that it would at least double the maximum size of liquidity-support buybacks for longer-dated government debt, going from $2 billion to $4 billion per operation.

BTC rocketed from under $65,000 to over $80,000 within days, while the bullion went from $4,350/oz to $4,700/oz before it was rejected.

The analysts at the Kobeissi Letter argued that BTC’s increasing correlation with the precious metal accelerated following the Treasury’s move, with investors increasingly treating both as protection against currency debasement, even though gold has lost a major chunk of its gains.

Grayscale’s Head of Research, Zach Pandl, supported this narrative, noting recently that the bitcoin-gold correlation has climbed from near zero at the beginning of the year to over 50%. At the same time, the Nasdaq relationship has moved in the opposite direction.

US federal debt going past $40 trillion, persistent government deficits still existing, and concerns about the long-term purchasing power of fiat currencies have brought the so-called “debasement trade” back into focus.

Both BTC and gold have limited supply characteristics that can make them attractive under that thesis, despite the cryptocurrency’s infamous volatility.

Further Away From Nasdaq

The other part of the equation could be equally important since BTC’s 90-day correlation with the Nasdaq 100 has fallen from over 60% to around 30%-33%. This is a major change from earlier periods, when the cryptocurrency frequently behaved like a high-beta tech asset, jumping alongside growth stocks when financial conditions eased and vice versa.

The August rally was a striking example of the opposite, with BTC gaining over 20% in days, while US equities struggled. As previously reported, bitcoin had underperformed the S&P 500 on roughly two-thirds of trading days over the preceding three months before it suddenly reversed that trend.

This divergence suggests investors are increasingly valuing bitcoin for its scarcity and monetary properties rather than simply treating it as a speculative risk asset.

However, this substantial trend change does not mean that the relationship with equities has fully flipped. The Friday reaction to the strong US jobs report hinted at a higher correlation between the two as both asset classes slipped.

The post Bitcoin’s Link to Gold Hits a 6-Year High as Tech Correlation Fades: Why It Matters appeared first on CryptoPotato.

☐ ☆ ✇ CryptoPotato

Fed Rate Hike Could Hit XRP Hard: ChatGPT Reveals How Low Ripple’s Price Could Go

By: Jordan Lyanchev

The monetary landscape in the United States changed in the past week or so, first after the hawkish stance taken by the current Federal Reserve Chairman, Kevin Warsh, and then following last Friday’s strong US jobs report.

As such, the expectations have changed, with investors and experts pricing in a potential rate hike for the next FOMC meeting scheduled to take place on September 15-16. After answering how this could impact BTC, we turned our focus to XRP, whose case was described as “arguably more interesting than bitcoin’s,” by ChatGPT.

What Happens to XRP Then?

With the current odds on prediction markets at well over 50% for a rate hike in September, the warning signs for risk-on assets are fully flashing. This was felt on Friday briefly after the jobs report, with BTC dropping by $3,000 and XRP slumping from $1.45 to under $1.40, where it found support.

ChatGPT estimated that the cross-border token is likely to react “more violently to a Fed hike” even though it has two cushions: strong ETF demand and the CLARITY Act process. The initial reaction to a 25 bps increase on September 16 would be a 4%-8% decline, the AI predicted. From the current levels, this would materialize in a dip below $1.30.

The situation could worsen in the following days and weeks, with $1.20 emerging as the first major support to be tested. If Warsh takes an even more hawkish approach in his post-FOMC meeting speech, XRP could “fall further toward $1.05-$1.15.”

One of the cushions mentioned above, the CLARITY Act, has not made any real progress lately. It was delayed once again in early August, and its September vote, scheduled for just a day before the conclusion of the FOMC meeting, is no longer guaranteed after the latest developments. As such, XRP could be primed for even more painful performance in case of a rate hike.

The Dark Horse

ChatGPT believes that the spot XRP ETFs could be the silver lining for the underlying asset, as they have remained relatively solid even during market distress, and their performance has picked up after the August rally. The cross-border token could quickly bounce after the initial shock if the Fed signals no immediate second hike and the ETF demand is still intact.

If that’s the case, $1.50-$1.60 will come into focus as this level has halted many of XRP’s previous breakout attempts. However, if the Fed surprises the market and raises rates by 50 bps, while Warsh goes fully hawkish, the altcoin’s future could quickly deteriorate, with another leg down to and even below $1.00, ChatGPT warned.

The post Fed Rate Hike Could Hit XRP Hard: ChatGPT Reveals How Low Ripple’s Price Could Go appeared first on CryptoPotato.

☐ ☆ ✇ The Motley Fool

This eVTOL Stock Could Set Early Investors Up for Life

By: newsfeedback@fool.com (Steven Porrello)

Key Points

  • Archer Aviation acquired three businesses from Boeing, one of which is developing autonomous eVTOLs.

  • If Archer builds a fleet of pilotless eVTOLs, it would cut a major expense: the pilot.

  • Archer lacks FAA-type certification for its eVTOL, but if it can succeed with a pilotless eVTOL, the economics could be highly advantageous.

Confession: I've been wrong about Archer Aviation (NYSE: ACHR). Not totally wrong, but wrong enough to make me rethink the stock. In truth, I've been analyzing the stock too narrow-mindedly, with too much focus on its air taxi business and not enough on the other developments taking shape around it.

Two of those developments are in defense and autonomous technology. And I think they will make Archer one of the most formidable eVTOL businesses on the market.

Missed Nvidia in 2009? This Rare Signal Is Flashing Again. In 2009, a "Double Down" signal flashed for a little-known chipmaker called Nvidia. For the first time in years, that same "Total Conviction" signal is flashing for a company 1/100th the size of Nvidia. Continue »

Archer's latest move could reduce future costs by a quarter

By now, you probably know what Archer is, or what it's trying to build. It's a frontrunner in the nascent electric vertical takeoff and landing (eVTOL) industry. Long term, it wants to operate an air taxi service, a kind of Uber (NYSE: UBER) in the skies, a transportation network to taxi people through the air to vertiports in major cities.

The urban mobility market, which includes eVTOL services, is expected to grow into a multitrillion-dollar market over the next several decades. That has also been one of the primary reasons to invest in companies like Archer, whose $4 billion-ish market cap could grow exponentially if this industry attracts the heavy demand expected of it.

Air taxi services will always be Archer's crown jewel, and the company has shown zero interest in backing away from that market. But since it can't actually operate an air taxi business yet, because FAA-type certification is stilling pending, the need for revenue has led it to make some surprising moves, one of which I'll talk about here.

Archer aircraft on the tarmac with a person walking past it and low-lying hills in the background.

Image source: Archer Aviation.

That move was its recent decision to take three businesses from Boeing (NYSE: BA) in exchange for 19.75% of Archer's pre-close share count, plus two warrants for $100 million of stock apiece. All three cross into Archer's business in some way: Wisk designs eVTOLs, SkyGrid's software manages air traffic, and Insitu builds drones. But Insitu seems like the real prize right now. Let me put it this way: It is a profitable business that is generating $200 million in annual revenue. And for Archer -- whose second-quarter revenue was about $5 million -- any profit could stop a multimillion-dollar cash-burning hole that has seemed impossible to fill.

ACHR Cash from Operations (Annual) Chart

Data by YCharts.

Insitu's revenue can help cash flow Archer's business in the short term. But, to return to my prediction, the purchase that could make Archer's business thrive isn't Insitu but Wisk.

Like Archer, Wisk is building eVTOLs. Unlike Archer's eVTOL Midnight, however, Wisk's aircraft is being developed for autonomous -- that is, pilotless -- flight. Obviously, that raises the bar on safety and regulation, which is already high because of the novelty of eVTOLs, but if autonomous technology can be relied upon, it would eliminate one of the most expensive portions of an air taxi flight: paying the pilot.

Indeed, one academic study of eVTOLs, published in 2024, estimated that autonomous operations could cut operating costs by about 27% compared with piloted flights. Granted, that's just an estimate, and Archer's real-world economics could differ significantly, but the point is clear: Pilotless flights could improve Archer's bottom line, perhaps by a significant amount.

Archer, I predict, is aiming for pilotless eVTOL flights, and if it succeeds, it will become one of the most efficient, profitable, and advantaged eVTOL businesses out there. That future, of course, still hinges on FAA certification, but if Archer gets there, today's investors would be getting in before that advantage is recognized.

Should you buy stock in Archer Aviation right now?

Before you buy stock in Archer Aviation, consider this:

The Motley Fool Stock Advisor analyst team just identified what they believe are the 10 best stocks for investors to buy now… and Archer Aviation wasn’t one of them. The 10 stocks that made the cut could produce monster returns in the coming years.

Consider when Netflix made this list on December 17, 2004... if you invested $1,000 at the time of our recommendation, you’d have $421,997!* Or when Nvidia made this list on April 15, 2005... if you invested $1,000 at the time of our recommendation, you’d have $1,413,876!*

Now, it’s worth noting Stock Advisor’s total average return is 978% — a market-crushing outperformance compared to 213% for the S&P 500. Don't miss the latest top 10 list, available with Stock Advisor, and join an investing community built by individual investors for individual investors.

See the 10 stocks »

*Stock Advisor returns as of September 5, 2026.

Steven Porrello has positions in Archer Aviation. The Motley Fool has positions in and recommends Boeing. The Motley Fool recommends Uber Technologies. The Motley Fool has a disclosure policy.

☐ ☆ ✇ CryptoPotato

Dogecoin (DOGE) Suddenly Pumps by Double Digits as Analysts Declare the Start of Altseason

By: Jordan Lyanchev

The largest meme coin by market cap has soared on Saturday evening to $0.094, hitting a two-week high. The move is rather unexpected given the typically calm nature of the weekends.

However, there were certain signs about a potential rally, even though DOGE has slipped from its local high to $0.09 as of press time.

DOGEUSD on TradingView

CryptoPotato outlined yesterday the three major signals that flashed for DOGE, including the TD Sequential. Analysts quickly determined that the OG meme coin is primed for another leg up.

However, that didn’t transpire at first, as the asset was rejected at $0.088 and slipped back down to $0.084 as the entire market bled following the strong US jobs report, which was considered bearish for risk-on assets.

Nevertheless, DOGE exploded on Saturday evening, gaining 12% from its low yesterday to the two-week high at $0.094. Popular analyst CW noted that the meme coin has reached the first major sell wall on its path forward, which is too solid to be broken now. If it falls, though, the next such wall sits all the way up at $0.14.

Fellow analyst Alex Marzell believes DOGE did “exactly what it needed to,” as it rebounded from the Friday lows to reclaim a key resistance.

$DOGE did exactly what it needed to.

Friday’s jobs print dumped it back to the $0.083 base, six flat 4H candles held it, and today one 4H candle ripped $0.0876 to $0.0952 straight back through $0.088.

Old resistance is the new line. Hold $0.088 and I think $0.095 goes next and… pic.twitter.com/y7hW91yCek

— Alex Marzell (@MarzellCrypto) September 5, 2026

Max Crypto also weighed in on DOGE’s impressive move and even suggested that its breakouts have been the “best indicator” for the start of an Altseason.

The post Dogecoin (DOGE) Suddenly Pumps by Double Digits as Analysts Declare the Start of Altseason appeared first on CryptoPotato.

☐ ☆ ✇ CryptoPotato

Bitcoin Holders Just Cashed Out 110,000 BTC in Profits: Is a Bigger Price Drop Coming?

By: Jordan Lyanchev

CryptoQuant data shows that bitcoin investors started realizing major profits after the explosive August rally, disposing of roughly 110,000 BTC in just a few weeks.

Such highly concentrated profit-taking developments have historically been followed by substantial price correction for the underlying asset, the analysts warned. Moreover, several demand indicators have weakened, which could add to the selling pressure.

110K BTC Profit Taken

The major run that began on August 19 at prices of under $65,000 drove the leading cryptocurrency to almost $80,000 in just two days. According to CQ’s latest weekly report, holders realized net profits of 23,000 BTC on that day alone (August 21), which became the largest single-day profit realization this year.

The asset indeed dipped in the following days as it felt almost inevitable after such a gigantic jump, but went on the offensive once again in the following week or so. It rocketed past $82,000 on Friday before it was rejected following the US jobs report, and now sits below $80,000.

The report described the major profit-taking as a classic characteristic of a bullish cooldown, but warned that if they continue at such a rapid pace, the asset’s price could be primed for another correction. Historical occurrences have shown that BTC tends to dump hard after a major rally if investors are not convinced about its potential.

“It is a hallmark of a bullish cooldown: bullish because it happens into strength, cautionary because concentrated realization can cap near-term upside,” reads the report.

Bitcoin Profit Taking. Source: CryptoQuant

Cooling Demand

CryptoQuant outlined another reason why BTC could be primed for a more profound correction, even though it already slipped from $82,400 to $79,600. Its apparent spot demand briefly expanded by 43,000 units, marking its fastest growth pace of the year. However, that metric has lost its momentum and is now back in contraction.

US investors’ demand has weakened as well. The most used metric for this, the Coinbase Premium, measuring the price difference between the asset on the leading US exchange and other trading platforms, has returned to slightly negative territory at -0.05.

The analysts said similar periods of soft US spot demand have capped the cryptocurrency’s rallies three other times this year alone.

Nevertheless, the short-term picture does not necessarily mean that BTC’s run is over and that it will return to a bearish phase. The Bull Score currently stands at 70, which is above the 60 threshold historically associated with sustainable bull markets.

” This keeps the broader picture constructive: Bitcoin remains in the early phase of a new bull market even as short-term momentum cools. The “official” bull market begins once price closes above its 365-day moving average,” they added, outlining that this key MA is located at around $83,000 – the level that stopped BTC in May.

The post Bitcoin Holders Just Cashed Out 110,000 BTC in Profits: Is a Bigger Price Drop Coming? appeared first on CryptoPotato.

☐ ☆ ✇ The Motley Fool

Warren Buffett's Successor Greg Abel Spent $4.5 Billion Buying 1 Stock Last Quarter, and He Spent At Least $3.3 Billion Buying More This Quarter

By: newsfeedback@fool.com (Adam Levy)

Key Points

  • Greg Abel broke two long streaks started by Warren Buffett in the last few years of his tenure as CEO.

  • Much focus has been on Abel's ability to deploy Berkshire's ample capital and equity portfolio.

  • Investors have an opportunity to follow Abel into one of his biggest investments of the last few months.

One of the biggest questions Greg Abel faced after he took over for Warren Buffett as CEO of Berkshire Hathaway (NYSE: BRKA) (NYSE: BRKB) at the start of 2026 was how he would manage the company's massive equity portfolio.

Unlike Buffett, Abel doesn't have a significant background in capital allocation decisions. Abel is known as a strong operations manager, which makes him well-suited for overseeing Berkshire's dozens of owned-and-operated businesses.

Missed Nvidia in 2009? This Rare Signal Is Flashing Again. In 2009, a "Double Down" signal flashed for a little-known chipmaker called Nvidia. For the first time in years, that same "Total Conviction" signal is flashing for a company 1/100th the size of Nvidia. Continue »

But with an equity portfolio value of about $360 billion and roughly equal amounts of investable cash and Treasuries, as of this writing, the liquid portfolio accounts for far more of Berkshire's value than its own operations do. That's why many investors have been watching what Abel will do with the company's portfolio.

Last quarter, Abel made some big moves, including purchasing about $4.5 billion of a single stock. And the company's quarterly filing revealed that he's buying billions more this quarter. Here's what investors need to know.

A person holding a phone with a stock trading app displaying a quote for Berkshire Hathaway.

Image source: Getty Images.

Abel broke two long streaks at Berkshire Hathaway

As Warren Buffett wound down his tenure as CEO, he had created a couple of notable streaks in Berkshire's capital allocation.

The first streak was that he was a net seller of stocks for 13 straight quarters. Abel continued that streak in the first quarter, unless you count the $9.7 billion acquisition of OxyChem as a stock purchase. Total net stock sales in the 14 quarters added up to $194.8 billion.

Abel ended that streak last quarter. He bought a total of $23.5 billion worth of equities while selling just $3.7 billion. The biggest of those stock purchases, by far, was Alphabet (NASDAQ: GOOG) (NASDAQ: GOOGL).

Buffett initiated the Alphabet position in the third quarter of 2025 and noted that he approves of Abel's decision to make it one of Berkshire's largest positions. That includes a $10 billion private placement Abel took in June, in addition to purchasing the stock in the public market.

Alphabet is currently Berkshire's third-largest position, and Abel may be buying more of the stock while the price trades below the level at which he took the private placement. Investors will have to wait for public disclosures to find out for sure.

It's another stock Abel bought in the second quarter that we know for certain he bought more of since the end of June. And that relates to the other notable streak Buffett started. After buying back Berkshire shares for 24 straight quarters, Buffett stopped repurchasing the stock in the third quarter of 2024. That began a streak of six straight quarters without a buyback.

Abel ended that streak in his first quarter as CEO, buying back a few hundred million in shares. He made a massive step-up in buybacks last quarter, with repurchases totaling $4.5 billion. And he's not done yet.

Berkshire's quarterly report shows that the number of shares outstanding fell by about 0.32% from the end of June to the end of July. With a market capitalization hovering above $1.05 trillion, Abel spent more than $3.3 billion buying additional shares of Berkshire Hathaway in July alone. And he could buy more.

Should investors follow Abel?

Warren Buffett has generally advised Berkshire Hathaway shareholders to buy the stock whenever management buys back shares. It's a very simple indicator for investors to follow, and it's trustworthy due to Buffett's stance on share repurchases. He reiterated, on multiple occasions, that all share repurchases must be price-dependent. Management should buy back stock only when it trades below its intrinsic value.

The board updated its repurchase authorization to reflect that stance in 2018, and it remains in place today. Abel is only allowed to repurchase shares when he and Buffett determine that the price is below the conservatively determined intrinsic value. As such, investors can safely assume management believes the stock was undervalued in July. Unfortunately, the stock has traded higher in August and at the start of September.

Nonetheless, the stock looks fairly valued. Its price-to-book ratio is around 1.45, which may be somewhat inflated, given we're just a few weeks away from the end of the third quarter. That's historically a good price to pay for the stock.

Furthermore, Berkshire stock has mostly traded sideways in 2026 while the market has piled into insurance stocks and railroad stocks (two of Berkshire's biggest operations), and its marketable equity portfolio has increased in value. That's despite strong operating results for the insurance underwriting business and improvements in railroad profitability in the first six months of the year. The stock performance may reflect investor sentiment regarding Abel's capabilities as an asset allocator.

While investors shouldn't expect the massive returns Buffett generated from equities over his lifetime, Abel appears capable of deploying capital strategically in new equity investments and returns to shareholders. After the market digests the regime change, the stock should be able to move higher.

Should you buy stock in Berkshire Hathaway right now?

Before you buy stock in Berkshire Hathaway, consider this:

The Motley Fool Stock Advisor analyst team just identified what they believe are the 10 best stocks for investors to buy now… and Berkshire Hathaway wasn’t one of them. The 10 stocks that made the cut could produce monster returns in the coming years.

Consider when Netflix made this list on December 17, 2004... if you invested $1,000 at the time of our recommendation, you’d have $421,997!* Or when Nvidia made this list on April 15, 2005... if you invested $1,000 at the time of our recommendation, you’d have $1,413,876!*

Now, it’s worth noting Stock Advisor’s total average return is 978% — a market-crushing outperformance compared to 213% for the S&P 500. Don't miss the latest top 10 list, available with Stock Advisor, and join an investing community built by individual investors for individual investors.

See the 10 stocks »

*Stock Advisor returns as of September 5, 2026.

Adam Levy has positions in Alphabet. The Motley Fool has positions in and recommends Alphabet and Berkshire Hathaway. The Motley Fool has a disclosure policy.


☐ ☆ ✇ The Motley Fool

Here's Why USA Rare Earth Is a Buy Before Its Next Earnings Report

By: newsfeedback@fool.com (Steven Porrello)

Key Points

USA Rare Earth (NASDAQ: USAR) is quickly becoming one of America's most strategically important mining companies, at least if the economy, technology, and national security count for anything.

Why all the attention? Two words: rare earths. Indeed, rare-earth metals, as their name suggests, are a class of elements that are tough to find in economically useful deposits. They are essential to everything from smartphones and electric vehicles (EVs) to fighter jets and guided missiles, and China controls most of the world's capacity to process them.

Missed Nvidia in 2009? This Rare Signal Is Flashing Again. In 2009, a "Double Down" signal flashed for a little-known chipmaker called Nvidia. For the first time in years, that same "Total Conviction" signal is flashing for a company 1/100th the size of Nvidia. Continue »

USA Rare Earth is one of only a handful of American companies that control a rare-earth deposit on American soil. Its goal is to extract rare-earth elements from a deposit in Texas, process and separate them domestically, and turn them into permanent magnets for American companies out of its factory in Oklahoma.

For some time, this has been at the heart of USA Rare Earth's growth thesis; none of it is new. What is new, however, is its pending acquisition of Serra Verde, which could turn USA Rare Earth from a would-be miner with an uncertain start date into the owner of an operating rare-earth mine. That deal will likely close before its next earnings report -- expected in early November -- and could set the stage for a huge rally.

Here's what investors should know.

Shelves on an open-pit mine.

Image source: Getty Images.

From cash burn to cash flow

For nearly all of its existence, USA Rare Earth has been all map and no territory. True, it owns Round Top Deposit, one of the largest known U.S. sources for heavy rare earths. But Round Top isn't an operational mine, and it won't become one for at least another two years.

With no functioning mine yet, and only about $13 million in trailing-12-month revenue, USA Rare Earth's annual cash burn of roughly $100 million has been a flashing warning light for investors.

USAR Cash and Short Term Investments (Annual) Chart

Data by YCharts

This is where the Serra Verde acquisition could prove to be the best move USA Rare Earth can make. The Brazilian rare-earth mine is expected to generate between $550 million and $650 million in annualized run rate earnings before interest, taxes, depreciation, and amortization (EBITDA) by the end of 2027. Not only would that help offset USA Rare Earth's cash burn, but move it closer to positive cash flow.

Oh, but it gets better. Serra Verde has already secured a buyer for 100% of its Phase 1 production. That buyer is US SIIE, a government-backed special-purpose company established specifically to buy Serra Verde's rare-earth products. The 15-year agreement includes price floors and take-or-pay protections, which are supported by $750 million in U.S. government funding.

In simple terms, Serra Verde now has a customer obligated to buy its output at protected prices. For a mining company, it doesn't get much safer than that, at least on the demand side.

Once the acquisition closes -- shareholders have already approved it -- the protections on Serra Verde would extend to USA Rare Earth. In essence, USA Rare Earth would have an operating mine to help generate cash flow for its other projects, such as its Top Deposit and magnet factories.

At its next earnings report, USA Rare Earth could very likely, I think, announce the closing of this acquisition. Investors who buy USA Rare Earth beforehand may be glad they did.

Should you buy stock in USA Rare Earth right now?

Before you buy stock in USA Rare Earth, consider this:

The Motley Fool Stock Advisor analyst team just identified what they believe are the 10 best stocks for investors to buy now… and USA Rare Earth wasn’t one of them. The 10 stocks that made the cut could produce monster returns in the coming years.

Consider when Netflix made this list on December 17, 2004... if you invested $1,000 at the time of our recommendation, you’d have $421,997!* Or when Nvidia made this list on April 15, 2005... if you invested $1,000 at the time of our recommendation, you’d have $1,413,876!*

Now, it’s worth noting Stock Advisor’s total average return is 978% — a market-crushing outperformance compared to 213% for the S&P 500. Don't miss the latest top 10 list, available with Stock Advisor, and join an investing community built by individual investors for individual investors.

See the 10 stocks »

*Stock Advisor returns as of September 5, 2026.

Steven Porrello has no position in any of the stocks mentioned. The Motley Fool has no position in any of the stocks mentioned. The Motley Fool has a disclosure policy.

☐ ☆ ✇ CryptoPotato

BNB Hits 7-Month High After Major Kalshi Move and Explosive Chain Growth

By: Jordan Lyanchev

Binance Coin is among the top performers in the past 24 hours in the altcoin space, surging by over 6% and further extending its lead above XRP in terms of market cap placement.

This impressive rally on a rather dull Saturday after the Friday market rejection came following some positive news from Kalshi and the overall growth of the BNB Chain.

BNB Pops

The native token of the broader Binance ecosystem traded at $725 yesterday amid the market-wide revival that drove BTC to $82,400. However, the subsequent retracement prompted by the strong US jobs report pushed it south to $710. The asset found solid support there and exploded out of the gate, surging to $770 minutes ago for the first time since early February.

BNBUSD on TradingView

This Saturday’s rally is quite unexpected since most of the market is still in the red following yesterday’s bad news for risk-on assets. As such, the reason for BNB’s defiance is likely coming from outside factors, such as Kalshi’s move to launch perpetual futures contracts for the asset in the US, regulated by the Commodity and Futures Trading Commission.

Leverage is capped at around 4.5x for eligible US traders and comes after the platform added support for other altcoins such as ADA, AAVE, WLD, and VVV. Kalshi also supports BNB Smart Chain (BSC) integrations for managing deposits and withdrawals on international accounts.

BNB Chain Growth

The other probable reason comes from a Grayscale report cited by Wu Blockchain. As explained, BNB Chain is among the most widely used networks for trading tokenized equities.

The paper reveals that the weekly spot volume peaked at almost $3 billion in August, while only 5% of the market is currently deployed in on-chain finance. Robinhood Chain leads the pack, followed by BNB Chain and Solana.

Grayscale explained that further US regulatory clarity could “expand tokenized stocks from global, around-the-clock trading products into productive on-chain financial assets.”

Grayscale: Tokenized Equity Weekly Spot Volume Nears $3B, Only 5% Used in Onchain Finance

Grayscale said tokenized equity trading reached record highs in August, with weekly spot volume peaking near $3 billion, while only about 5% of the market is currently deployed in onchain… pic.twitter.com/ZcVA72DYTX

— Wu Blockchain (@WuBlockchain) September 4, 2026

The post BNB Hits 7-Month High After Major Kalshi Move and Explosive Chain Growth appeared first on CryptoPotato.

☐ ☆ ✇ CryptoPotato

XRP’s Breakout Rally Has Begun, Analysts Say – But Their Targets Will Shock You

By: Jordan Lyanchev

Although it was rejected at $1.70 a couple of weeks ago after its major mid-August surge, Ripple’s cross-border token is still up by 40% from its multi-year lows marked less than a month ago.

This has turned numerous analysts highly bullish. While this sounds quite expected for market observers like EGRAG CRYPTO, Ali Martinez’s recent price target is what got the community going.

XRP to $60!?

Martinez has recently been quite convinced that Ripple’s native token has already bottomed out during this cycle and is on its path to recovery. In a previous post, he noted that XRP’s breakout is confirmed and outlined a more modest target of $1.70. This one came actually after the asset reached that level on August 21-22, following its 70% surge in less than 72 hours.

However, it was violently rejected there and pushed south to under $1.35 last week. Its ability to maintain that level and the subsequent rebound to the current $1.40 gave bulls more hope, and Martinez joined the party.

In a post from earlier today, the analyst told his 166,000 followers that XRP has been “forming a massive ascending triangle on the monthly chart.” If it breaks above and closes north of the key barrier at $3.66, then it would “confirm the breakout and activate a technical target near $60.” Yes, that’s $60 per XRP.

XRP BULL MARKET TARGET: $60

For nearly a decade, $XRP has been forming a massive ascending triangle on the monthly chart.

The $3.66 resistance level is the key barrier. A monthly close above it would confirm the breakout and activate a technical target near $60. pic.twitter.com/RpAnbER9cv

— Ali Charts (@alicharts) September 5, 2026

Now, we are not trying to be the bearer of bad news, but $60!? Even if it takes another 10 years, it would require a near-4,200% surge from current levels. Moreover, its market cap, even if XRP’s supply remains the same, which it won’t, would be at around $4 trillion (yes, with a T). This would make it 2-3 times bigger than BTC’s current market cap, and its valuation would top even giants like Amazon and Microsoft.

Maybe $25?

Similar highly bullish (and a bit far-fetched) predictions typically come from other analysts, such as EGRAG CRYPTO. But even his most recent analysis was more modest than Martinez’s.

Basing his findings on XRP’s previous expansions, in which the asset exploded by up to 2,400%, the analyst outlined some major targets in his September 5 analysis. The highest of which is at $25 if XRP is to mimic the most significant rally from its 2017-2018 bull phase.

The other, slightly less bullish, targets are set between $11 and $15.8. Naturally, all of those sound a bit unrealistic at the moment, even though the market structure has shifted significantly over the past several weeks.

The post XRP’s Breakout Rally Has Begun, Analysts Say – But Their Targets Will Shock You appeared first on CryptoPotato.

☐ ☆ ✇ CryptoPotato

We Asked AI: What Happens to Bitcoin’s Price if the Fed Hikes Rates in 11 Days?

By: Jordan Lyanchev

Following the strong US jobs report from Friday and the hawkish stance taken by Federal Reserve Chair Kevin Warsh the week prior, the odds for a rate hike have grown significantly in just seven days.

Bitcoin’s price reacted to both developments with a minor leg down before it recovered some of the losses. An actual rate increase, though, could have a much more profound effect.

What Happens to BTC

The previous FOMC meeting in July was quite condensed, as it was described as the most unpredictable one in over six years. At the end, though, the Fed refused to change the rates, leaving them at 3.50%-3.75% following a 9-3 vote.

However, the fact that there were 3 policymakers in favor of such a monetary pivot was the first hint at a potential change. The rest came in the past week or so, as Warsh was quite hawkish during his first Jackson Hole speech at the end of August. The blowout US jobs report from yesterday only tilted the odds further, currently being at over 50% for a hike, since it gives the central bank leeway to keep fighting the stubborn inflation through a tighter monetary policy.

Next week’s CPI data will be crucial. The FOMC meeting will take place on September 15-16, and ChatGPT believes BTC’s initial reaction will be a nosedive. However, the AI platform added that it “would not expect another catastrophic bear-market leg.”

Instead, it noted that the key part of bitcoin reaction will be from the fact of whether the hike is “already fully priced in by then, and what Kevin Warsh says about what comes next.”

“At the moment, markets are putting roughly a 60% probability on a September hike after the surprisingly strong August jobs report. BTC is around $79,650 after already falling from above $81,000 as that probability increased.”

Precise Prediction

The popular AI chatbot noted that another 2%-5% decline is expected in ten days after the conclusion of the FOMC meeting if the Fed indeed proceeds with hiking the rates. This means that bitcoin would test the $75,000 support at first.

Another leg down to $72,000 could be in the cards if yields continue climbing by the end of September. Moreover, it could slip below $70,000 for the first time since mid-August if Warsh remains hawkish. Those scenarios are in case the Fed increases the benchmark by 25 bps.

In the more unexpected scenario in which the central bank hikes it by 50 bps, then ChatGPT expects BTC to slump by up to 15% very quickly, going to under $70,000 within a day or so.

“A drop to $68,000 could be instant, with leveraged liquidations potentially producing a temporary wick into the mid-$60Ks,” it warned.

Although all of those predictions sound quite worrisome for BTC, which finally had some fresh air during the mid- to late-August rally, it’s worth noting that the cryptocurrency is known for often moving in the opposite direction of what people expect from it.

The post We Asked AI: What Happens to Bitcoin’s Price if the Fed Hikes Rates in 11 Days? appeared first on CryptoPotato.

☐ ☆ ✇ The Motley Fool

Recent News From Nvidia and SK Hynix Reveals Exactly What the Market Expects for Micron Technology's Future

By: newsfeedback@fool.com (Adam Levy)

Key Points

  • Nvidia increased its supply commitments by $160 billion last quarter, mostly related to memory.

  • SK Hynix said the memory chip supply shortage could last longer than anyone expects.

  • The market's reaction to both items is telling.

Micron Technology (NASDAQ: MU) has seen its revenue and profits soar amid booming demand for AI compute, and it could see its pockets get even fatter over the next few years based on recent news from its fellow AI chipmakers. Both Nvidia (NASDAQ: NVDA), which uses memory chips like Micron's in its GPU systems, and SK Hynix (NASDAQ: SKHY), a rival memory chipmaker, announced news suggesting the memory chip supply shortage could last much longer.

The market's reaction to the recent developments provides a clear indication of what the market expects for Micron going forward. Here's what investors need to know.

Missed Nvidia in 2009? This Rare Signal Is Flashing Again. In 2009, a "Double Down" signal flashed for a little-known chipmaker called Nvidia. For the first time in years, that same "Total Conviction" signal is flashing for a company 1/100th the size of Nvidia. Continue »

An office building with a sign displaying Micron's logo in front.

Image source: Micron Technology.

Nvidia just made a huge commitment to memory chips

Nvidia's second-quarter earnings report included a small detail that could have a huge impact on Micron and the rest of the memory chip industry. The company increased its commitments to suppliers to $279 billion, up from $119 billion in the previous quarter. The $160 billion increase is primarily due to memory procurement, CFO Colette Kress wrote in her prepared statement accompanying the earnings release.

Nvidia likely signed long-term agreements with one or more memory chip suppliers. All three leading chipmakers started signing strategic agreements to guarantee demand well into the future in exchange for locking in prices today. That gives the companies the confidence to build new capacity with a guaranteed buyer at the end of the day. However, it caps how high prices can climb if demand growth continues to outpace supply growth.

Investors have generally seen the long-term agreements as a bullish sign for the memory chipmakers. The guaranteed revenue could reduce the cyclicality that has historically plagued memory chip stocks.

So, the fact that Nvidia made a huge commitment should be a positive signal for Micron stock. Nonetheless, the market didn't seem to react to the news; shares dropped 0.3% the day after Nvidia's earnings release.

SK Hynix's management says the memory shortage can last much longer

At a press conference following the groundbreaking ceremony for SK Hynix's new Indiana manufacturing facility, CEO Kwak Noh-jung said the current memory supply shortage could last through 2030. SK Hynix's Indiana facility isn't set to begin mass production until the second half of 2029, and with a $4 billion price tag, a lot is riding on the continuation of the tight memory chip market.

More importantly, the analyst consensus has been that supply will catch up to demand by 2028 and revenue growth will slow for the memory chipmakers. Micron's most recent guidance was that tight conditions will "persist beyond calendar 2027."

Shares of Micron barely budged on news that SK Hynix's management now expects a favorable market for its products to last through the end of the decade, driven by the unprecedented AI compute build-out.

What the market's reaction says about Micron stock

Despite positive developments or insider commentary on the memory market, Micron stock has barely moved. That suggests the market is already extremely optimistic about Micron Technology's future.

That puts shareholders in a precarious position. Good news will have practically no effect on the stock price, as we saw at the end of August. Micron needs to release news that absolutely blows away expectations to move higher. While it's been done repeatedly over the last year or so, the market's expectations are now sky-high.

On the flip side, any indication that the current earnings cycle won't be as strong as expected or won't last as long as forecast could be devastating for shareholders. The volatile stock could tumble lower on even a hint of bad news because expectations are so high.

Investors may view the stock trading at just 6 times forward earnings as a relatively low-risk opportunity, but that's not the case for a cyclical stock like Micron. There's a lot of uncertainty in those earnings forecasts. A shortfall in earnings relative to expectations could reduce both earnings and the earnings multiple, compounding the downward impact on the stock price.

Of course, exceeding those expectations could have the opposite effect. It's just become increasingly difficult for Micron to do that.

Should you buy stock in Micron Technology right now?

Before you buy stock in Micron Technology, consider this:

The Motley Fool Stock Advisor analyst team just identified what they believe are the 10 best stocks for investors to buy now… and Micron Technology wasn’t one of them. The 10 stocks that made the cut could produce monster returns in the coming years.

Consider when Netflix made this list on December 17, 2004... if you invested $1,000 at the time of our recommendation, you’d have $445,833!* Or when Nvidia made this list on April 15, 2005... if you invested $1,000 at the time of our recommendation, you’d have $1,402,153!*

Now, it’s worth noting Stock Advisor’s total average return is 993% — a market-crushing outperformance compared to 214% for the S&P 500. Don't miss the latest top 10 list, available with Stock Advisor, and join an investing community built by individual investors for individual investors.

See the 10 stocks »

*Stock Advisor returns as of September 5, 2026.

Adam Levy has no position in any of the stocks mentioned. The Motley Fool has positions in and recommends Micron Technology and Nvidia. The Motley Fool has a disclosure policy.

☐ ☆ ✇ The Motley Fool

Insiders and Early Investors Are Selling SpaceX Stock and Index Funds Are Buying It. Which Side Do You Want to Be On?

By: newsfeedback@fool.com (Adam Levy)

Key Points

  • Institutional investors held more than $600 billion worth of SpaceX as of the end of the first quarter.

  • Most of those shares will be available to sell by the end of the year.

  • Index fund managers are acting as forced buyers, but it's not clear they can offset the selling pressure.

Space Exploration Technologies (NASDAQ: SPCX), better known as SpaceX, shattered records with its IPO, issuing almost $86 billion in stock. And while management favored retail investors with its IPO allocations, institutional investors still held a huge amount of the stock as of the end of the quarter. Filings with the SEC revealed 1,941 professional investment managers and corporate investors held more than $600 billion worth of the stock as of June 30.

Many of those shareholders were required to hold their shares through July, but in August, they finally got the opportunity to cash out some of their investments, and they'll have even more opportunities in September and October. Meanwhile, index funds will be buying up shares as more of the stock becomes publicly available.

Missed Nvidia in 2009? This Rare Signal Is Flashing Again. In 2009, a "Double Down" signal flashed for a little-known chipmaker called Nvidia. For the first time in years, that same "Total Conviction" signal is flashing for a company 1/100th the size of Nvidia. Continue »

The competing forces are important for everyone to understand, from individual SpaceX shareholders to index fund investors.

The SpaceX logo overlaid on an image of Earth from space.

Image source: The Motley Fool.

How much SpaceX stock are index funds buying?

When SpaceX filed to go public, many popular stock indexes updated their rules so that the giant space technology company would be included in their indexes shortly after its public market debut. Some of the most popular stock indexes with SpaceX already included are:

  • Nasdaq-100, which can be tracked using the Invesco QQQ Trust (NASDAQ: QQQ)
  • Morningstar US Total Market, which can be tracked using the Vanguard Morningstar Total Stock Market ETF (NYSEMKT: VTI)
  • Russell 1000, which can be tracked using the iShares Russell 1000 ETF (NYSEMKT: IWB)

Notably absent from the list is the S&P 500, which refused to update its inclusion criteria. SpaceX won't be eligible for the popular large-cap index for at least a year after its IPO.

All three of the above indexes began with relatively small weightings for SpaceX. That's because the company only offered about 5% of its entire company to the public with its IPO. The indexes are designed to reflect the publicly available investable universe. The Nasdaq-100 has the highest weighting for SpaceX. Not only does it have the fewest other constituents in the portfolio, but it also triples the float-adjusted market cap, meaning SpaceX could be fully market-cap weighted in the index once 33.4% of its stock is available to the public, which will likely occur before the end of the year.

With the lockup expirations in August and further expirations in September, October, and November, the indexes are set to increase SpaceX's weighting when they next rebalance. The Morningstar index and Nasdaq-100 will rebalance in mid-September. They'll increase the weight of SpaceX by about 3.4 times. The Russell 100 index will update later this year, and it'll see an even bigger increase as more share unlocks will have occurred by the time it's set to rebalance.

Considering the billions of dollars locked up in index funds tracking these indexes, plus all the mutual funds benchmarked against them (which incentivize fund managers to add exposure to SpaceX), there will be many buyers of SpaceX stock over the next few months.

But as mentioned, there are hundreds of billions of dollars worth of shares locked up, most of which will come to market by the end of the year. Most early investors are likely eager to take the stock off their books, as the massive gains may have left their portfolios heavily concentrated. It's unclear if the forced buying will be enough to offset the selling pressure.

Which side should you be on?

It's worth noting that many of the early investors may sell SpaceX stock not because they think it's a bad investment, but to reduce their concentration risk. At the same time, index fund managers will buy the stock not because they think it's a good investment, but because they're required to do so.

Index investors are caught in the middle. Those looking to avoid the stock could shift more of their assets to the S&P 500 and other indexes that won't include it until next year at the earliest. But for many investors locked into certain funds, it'll be hard to avoid. The stock will account for a growing percentage of their investment portfolio, whether they're bullish on the company or not.

Investors focused on the individual stock may find that near-term pressure from insider and early investor selling could create buying opportunities. Importantly, the value of SpaceX stock is heavily dependent on high growth expectations for its artificial intelligence and communications businesses, including technologies that have yet to prove themselves viable or scalable. Valuing the stock based on its recent financial results or even near-term expectations results in multiples that make little sense. If the stock price comes under pressure from early investors unloading large stakes, though, the price could become enticing given the business's long-term potential.

In the meantime, investors should expect significant volatility in the stock as lockup expirations trigger large selling events and index rebalancing triggers large buying events.

Should you buy stock in Space Exploration Technologies right now?

Before you buy stock in Space Exploration Technologies, consider this:

The Motley Fool Stock Advisor analyst team just identified what they believe are the 10 best stocks for investors to buy now… and Space Exploration Technologies wasn’t one of them. The 10 stocks that made the cut could produce monster returns in the coming years.

Consider when Netflix made this list on December 17, 2004... if you invested $1,000 at the time of our recommendation, you’d have $445,833!* Or when Nvidia made this list on April 15, 2005... if you invested $1,000 at the time of our recommendation, you’d have $1,402,153!*

Now, it’s worth noting Stock Advisor’s total average return is 993% — a market-crushing outperformance compared to 214% for the S&P 500. Don't miss the latest top 10 list, available with Stock Advisor, and join an investing community built by individual investors for individual investors.

See the 10 stocks »

*Stock Advisor returns as of September 5, 2026.

Adam Levy has no position in any of the stocks mentioned. The Motley Fool has no position in any of the stocks mentioned. The Motley Fool has a disclosure policy.

☐ ☆ ✇ CryptoPotato

PONS Skyrockets Another 30% to New ATH, Bitcoin Loses $80K: Weekend Watch

By: Jordan Lyanchev

Bitcoin’s price reacted immediately to the stronger-than-expected US jobs report on Friday, plunging from a multi-month high of over $82,000 to under $79,000 before it found some support.

Red dominates the larger-cap alts’ charts, with XRP dropping back to $1.40, ETH losing the $2,500 level, and XMR plunging by over 5%. BNB stands in the opposite corner with a 4.5% surge.

BTC Halted at $82K

The primary cryptocurrency faced a similar fate last Friday when it jumped to $81,500 only to be rejected and driven south to under $77,000 after the hawkish speech by Fed Chair Kevin Warsh at Jackson Hole. However, it rebounded during the weekend and even tapped $79,000 on Sunday.

The resumed military actions in the Middle East brought another leg down on Monday morning, with BTC slipping to $77,000 again. The bulls managed to defend that level again, and the cryptocurrency remained stuck between that lower boundary and the upper one at $79,000 for a few days.

The breakout began on Thursday when the asset surged past the latter level and kept climbing on Friday morning. The peak came at $82,400, which became BTC’s highest price tag in three and a half months. Although it was stopped there, it remained above $81,000 before the aforementioned jobs report went live and plunged immediately after it made the headlines to just under $79,000.

It has rebounded to $79,600 since then, with its market cap standing close to $1.6 trillion on CMC. Its dominance over the alts has retreated slightly to 59.45%.

BTCUSD September 5. Source: TradingView

PONS Keeps Rocking

The new rockstar of the altcoin space, PONS, is once again the top performer, surging by 30% in the past 24 hours to a new all-time high of almost $0.90. DASH follows suit, skyrocketing by 25% to over $65.

Binance Coin is up by 4.5%, being the biggest gainer among the larger caps, and now sits at $750. NEAR has gained 11% and is above $2.25. DOT, TAO, and LTC are also well in the green.

In contrast, ETH is down by 2.5% to $2,450, XRP has slipped by almost 3% to $1.40, and XMR is down by 5% to $525. RAIN, HYPE, and ADA are also in the red.

Cryptocurrency Market Overview September 5. Source: QuantifyCrypto


The post PONS Skyrockets Another 30% to New ATH, Bitcoin Loses $80K: Weekend Watch appeared first on CryptoPotato.

☐ ☆ ✇ The Motley Fool

Nvidia Stock: Buy or Sell? (My Final Verdict)

By: newsfeedback@fool.com (Parkev Tatevosian, CFA)

Nvidia (NASDAQ: NVDA) is forecasting robust growth for the fiscal year 2028.

Missed Nvidia in 2009? This Rare Signal Is Flashing Again. In 2009, a "Double Down" signal flashed for a little-known chipmaker called Nvidia. For the first time in years, that same "Total Conviction" signal is flashing for a company 1/100th the size of Nvidia. Continue »

*Stock prices used were the afternoon prices of Sept. 2, 2026. The video was published on Sept. 4, 2026.

Should you buy stock in Nvidia right now?

Before you buy stock in Nvidia, consider this:

The Motley Fool Stock Advisor analyst team just identified what they believe are the 10 best stocks for investors to buy now… and Nvidia wasn’t one of them. The 10 stocks that made the cut could produce monster returns in the coming years.

Consider when Netflix made this list on December 17, 2004... if you invested $1,000 at the time of our recommendation, you’d have $445,833!* Or when Nvidia made this list on April 15, 2005... if you invested $1,000 at the time of our recommendation, you’d have $1,402,153!*

Now, it’s worth noting Stock Advisor’s total average return is 993% — a market-crushing outperformance compared to 214% for the S&P 500. Don't miss the latest top 10 list, available with Stock Advisor, and join an investing community built by individual investors for individual investors.

See the 10 stocks »

*Stock Advisor returns as of September 5, 2026.

Parkev Tatevosian, CFA has positions in Nvidia. The Motley Fool has positions in and recommends Nvidia. The Motley Fool has a disclosure policy. Parkev Tatevosian is an affiliate of The Motley Fool and may be compensated for promoting its services. If you choose to subscribe through his link, he will earn some extra money that supports his channel. His opinions remain his own and are unaffected by The Motley Fool.

☐ ☆ ✇ CryptoPotato

2 Major Ripple (XRP) News From The Past 24 Hours: Details

By: Jordan Lyanchev

Less than two months after announcing a major partnership with the Kansas Jayhawks, the company behind XRP has doubled down on its US sports endeavors by collaborating with the Florida Gators.

Almost immediately after the news was announced, both parties shared a video showing that XRP’s logo was painted on the sports team’s ground.

$XRP and @FloridaGators.🐊
Soon. https://t.co/AI7wKEy3xw

— Ripple (@Ripple) September 4, 2026

Further details on the partnership indicate that the team will generate $5 million annually by placing the logos in the Swamp.

“Florida has a long history of embracing innovation and technology to enhance the experience of our fans and advance our programs,” athletic director Scott Stricklin said in a statement. “This partnership brings together two organizations that think boldly about the future, and we look forward to introducing XRP to our fans.”

The first game to host XRP’s logo will be played tonight at the Ben Hill Griffin Stadium, as the Florida Gators will face the Florida Atlantic Owls.

Recall that Ripple made a similar partnership with the Kansas Jayhawks, who represent the University of Kansas, and their teams have won 15 national championships, including 12 NCAA Division I titles. This one was more personal for Ripple’s CEO, who was raised in the state and holds a Bachelor of Arts in Economics from the University of Kansas.

The second news was shared by one of the most popular XRP Army members, BankXRP, on X. The user noted that Ripple will be the headline sponsor of Stable Launch – Stablecon USA’s startup competition.

The company’s Whittney Levitt will join the judging panel of the event, in which the winning startup gets a $200,000 investment.

The post 2 Major Ripple (XRP) News From The Past 24 Hours: Details appeared first on CryptoPotato.

☐ ☆ ✇ CryptoPotato

Pi Network Just Released 3 Major Upgrades: Here’s What They Mean for Pioneers

By: Jordan Lyanchev

The Core Team behind the popular project rolled out three new capabilities designed to make its ecosystem more attractive to app developers. The project also overhauled its developer documentation as it continues its broader push toward real-world utility.

The team said this update comes after several months of releases focused on enhancing Pi beyond simple crypto transactions and creating more reasons for users to actually explore and utilize the ecosystem.

3 New Features

The three new developer capabilities are local storage, access to app-specific staking data, and file and video sharing. Perhaps the most interesting is the first one.

Selected whitelisted Pi Browser apps can now store certain information directly on a user’s device instead of requiring devs to maintain their own backend infrastructure. Preferences, session inflation, and other applicable data can consequently be stored on the device, which can reduce infrastructure costs and complexity while providing a consistent experience across Android and iOS, added the post.

It’s worth noting that the data is not uploaded to Pi Network’s servers, even though the feature currently has several limitations. Only whitelisted apps have access, as storage capability is limited, and old data can eventually be removed.

Staking Data API, the second release, allows eligible developers to see how much effective Pi a user has staked specifically for their application through Ecosystem Directory Staking. Devs could potentially use this info to build app-specific features around their most committed supporters.

The last one, called Pi.shareFile, allows apps to use a phone’s native sharing functionality for files, images, and videos. Some of the examples outlined in the blog post range from marketplace customers sharing receipts or photos to gaming and content apps allowing users to share clips directly.

More Devs Wanted

In addition to the three new features, Pi Network announced that it has consolidated previously fragmented dev resources into a single documentation platform, which now covers everything from app registration and sandbox development to authentication, Pi payments, Mainnet preparation, and launch.

It also introduces AI-assisted guidance for integrating authentication and payments. The idea is quite clear as it reduces the friction involved in building applications for Pi and fits into the project’s broader strategy.

The team said that these releases tackle a problem that could be very important for the project and the native token’s long-term prospects: giving developers more tools and fewer technical obstacles to continue building apps that people actually want to use.

The post Pi Network Just Released 3 Major Upgrades: Here’s What They Mean for Pioneers appeared first on CryptoPotato.

☐ ☆ ✇ Crypto Insiders

Munt van de week: Hoe Arbitrum een groene markt hard verslaat

By: Kevin Schijven
De cryptomarkt heeft opnieuw een sterke week achter de rug, maar één munt steekt er met kop en schouders bovenuit. Arbitrum is deze week onze Munt van de week. De cryptomunt schiet met afstand het hardst omhoog binnen de top 100 en trekt ondertussen ook veel handel aan onder Nederlandse beleggers. Daar blijft het niet bij. Ook achter de schermen gebeurt er veel rond het netwerk, dat steeds vaker wordt gebruikt door grote financiële en technologiebedrijven. Van breaking news tot opvallende koersbewegingen: 27.000 Nederlanders volgen ons op Instagram.

In het kort

  • Arbitrum staat deze week 57 procent hoger en is daarmee de sterkste stijger uit de top 100.
  • Op Bitvavo behoort de munt tot de vijf meest verhandelde cryptomunten van deze week.
  • Nieuwe cijfers laten zien dat ook het netwerk achter Arbitrum flink blijft groeien.

Arbitrum stijgt 57 procent in één week

Arbitrum staat op het moment van schrijven rond 0,14 dollar. Dat is ruim 57 procent hoger dan een week geleden. Ondanks dat vrijwel de hele markt deze week groen kleurt, wist geen enkele andere munt uit de top 100 deze week zo sterk te stijgen. Arbitrum is een netwerk dat bovenop Ethereum is gebouwd om transacties sneller en goedkoper te maken. De munt trok eerder deze week al veel aandacht toen de koers plotseling ongeveer 30 procent in een dag steeg. Twee dagen later volgde opnieuw een flinke sprong.

Nederlanders handelen volop in Arbitrum

Ook op de Nederlandse cryptobeurs Bitvavo is de belangstelling groot. Arbitrum staat deze week in de top vijf van meest verhandelde munten, met een handelsvolume van ruim 21,5 miljoen euro. Vooral onder beleggers tussen de 30 en 44 jaar is de munt populair. Binnen deze leeftijdsgroep staat Arbitrum zelfs in de top drie. Dat is extra interessant omdat 30- tot 44-jarigen deze week samen goed waren voor 61 procent van het totale handelsvolume op Bitvavo.

Netwerk achter Arbitrum groeit sterk

De koersstijging wordt vooral in verband gebracht met Robinhood Chain. Dit nieuwe cryptonetwerk van handelsplatform Robinhood draait op technologie van Arbitrum en levert inmiddels inkomsten op voor het ecosysteem. Deze week kwamen daarnaast nieuwe cijfers van de Arbitrum Foundation naar buiten. Het netwerk heeft inmiddels 2,7 miljard transacties verwerkt en ziet gemiddeld voor 70 miljard dollar per maand aan stablecoins langskomen. Ook bedrijven als Mastercard, PayPal en LG maken gebruik van Arbitrum of bouwen erop. Verder stemde de Arbitrum-gemeenschap deze week over een nieuwe betaalde datadienst voor bedrijven en handelaren. Van de inkomsten daarvan zou 97 procent naar de gezamenlijke kas van Arbitrum gaan.

man-kijkt-scherm-groene-grafiek

☐ ☆ ✇ CryptoPotato

Bitcoin’s $3K Drop Comes as Fed Rate Hike Bets Surge, but Analyst Remains Bullish

By: Jordan Lyanchev

All eyes on Friday were on the US jobs report, which actually showed that the US economy had added 162,000 jobs in August, almost triple expectations of roughly 55,000-58,000. The unemployment rate remained at 4.1%, while July’s initially reported loss of 23,000 jobs was revised to a gain of 21,000.

The reaction in financial markets was instant. Bitcoin dropped sharply below $79,000 after it was rejected at $82,400 earlier that day, and the US stock market joined the ride. In contrast, Treasury yields and the greenback jumped.

Good News Is Hurting Markets?

Although a strong labor market sounds positive at first glance for financial markets, there’s more to the story as it comes to monetary policy. Such a favorable labor environment gives the Federal Reserve more room to keep fighting inflation without worrying that higher borrowing costs will trigger a sharp deterioration in employment. Perhaps that’s why the rate hike odds immediately jumped to over 50% after the jobs report went live.

Consequently, strong economic data can become negative news for risk assets when inflation remains high. The analysts at the Kobeissi Letter determined that “the system is broken,” pointing to stocks falling despite the economy creating substantially more jobs than expected. Even US President Donald Trump was surprised by the initial market reaction.

The system is broken.

You know the system is broken when stocks FALL after the US unexpectedly adds +162,000 jobs in a month, TRIPLING expectations.

Why? Because a strong jobs report means a higher chance of rate hikes.

This is the product 60-straight months of 2%+ inflation.… pic.twitter.com/kP8y9kxBOj

— The Kobeissi Letter (@KobeissiLetter) September 4, 2026

Expectations for higher interest rates typically push Treasury yields and the dollar north, while tightening financial conditions and reducing investors’ appetite for risk assets. That should explain BTC’s immediate reaction and price drop after the report went live.

Long-Term Bullish

Bitcoin analyst Adam Livingston outlined a different scenario beyond Friday’s reaction, arguing that persistent inflation, rising debt, and the monetary response ultimately required to sustain the financial system strengthen BTC’s long-term value proposition.

In that framework, higher rates can pressure the cryptocurrency in the short term, but they don’t solve the structural problems BTC was designed to hedge against.

The asset remains very sensitive to interest-rate expectations over shorter periods, but if inflation stays structurally elevated while governments continue running large deficits and debt burdens grow, the long-term argument for owning a scarce asset with a fixed supply could become much stronger.

The post Bitcoin’s $3K Drop Comes as Fed Rate Hike Bets Surge, but Analyst Remains Bullish appeared first on CryptoPotato.

☐ ☆ ✇ CryptoPotato

XRP Bulls Defend Key Level as Analyst Envisions Another 100% Rally

By: Jordan Lyanchev

The price rally initiated by the cross-border token in mid-August was halted at $1.70, and the subsequent correction drove it south hard to under $1.35. However, the asset managed to rebound swiftly and now sits above a key support level at $1.40.

This has provided additional fuel to popular bullish analysts such as EGRAG CRYPTO to map out XRP’s next move, which could take it north by almost 100%.

Is $2.70 on the Map for XRP?

The token’s recovery coincided with a substantial increase in trading activity as the spot volume across major exchanges skyrocketed to its highest level since February in late August. Binance alone handled almost $7.3 billion in XRP spot trades, followed by South Korea’s Upbit ($4.7 billion) and Bithumb with $2.6 billion.

EGRAG argued that XRP is now attempting to establish a bullish continuation pattern after recovering from the recent pullback that drove it from $1.70 to $1.33 in just over a week. The key here will be whether buyers can reclaim the resistance area that has repeatedly capped the asset’s breakout attempts.

If XRP is finally successful, it could aim at $2.70, said EGRAG, which would be a 100% move from the recent lows. However, there are still several hurdles in place.

The first major resistance level stands at $1.50, followed by the next at $1.60. Only if XRP is able to decisively close above both on the daily, it would have the opportunity to target the psychological $2.00. If it doesn’t, it can rely again on the $1.25-$1.30 support, which was already tested successfully recently.

Demand Still Present

Aside from the hurdles, there are some encouraging signs behind the latest leg up. Perhaps the most notable comes from the ETF inflows, as the financial products registered their best week in 2026 at the end of August, attracting over $110 million. The cumulative net inflows consequently tapped a new all-time high of $1.66 billion. Although the trend cooled in the past week, the funds still closed in the green as they have done for the past two months straight.

Ripple whales have also been on a substantial accumulation spree lately. Although these positive developments do not guarantee that EGRAG’s $2.70 target will materialize, they show that demand is still present despite the underlying asset’s rejection at $1.70. However, before it aims at $2.70, XRP would have to overcome other key resistance lines, with the first located at $1.50.

The post XRP Bulls Defend Key Level as Analyst Envisions Another 100% Rally appeared first on CryptoPotato.

☐ ☆ ✇ The Motley Fool

Rigetti Computing Stock: Time to Buy This Quantum Computing Stock?

By: newsfeedback@fool.com (Parkev Tatevosian, CFA)

Investors are hopeful that quantum stocks could be the next thing to soar after AI stocks.

Missed Nvidia in 2009? This Rare Signal Is Flashing Again. In 2009, a "Double Down" signal flashed for a little-known chipmaker called Nvidia. For the first time in years, that same "Total Conviction" signal is flashing for a company 1/100th the size of Nvidia. Continue »

*Stock prices used were the afternoon prices of Sept. 2, 2026. The video was published on Sept. 4, 2026.

Should you buy stock in Rigetti Computing right now?

Before you buy stock in Rigetti Computing, consider this:

The Motley Fool Stock Advisor analyst team just identified what they believe are the 10 best stocks for investors to buy now… and Rigetti Computing wasn’t one of them. The 10 stocks that made the cut could produce monster returns in the coming years.

Consider when Netflix made this list on December 17, 2004... if you invested $1,000 at the time of our recommendation, you’d have $445,833!* Or when Nvidia made this list on April 15, 2005... if you invested $1,000 at the time of our recommendation, you’d have $1,402,153!*

Now, it’s worth noting Stock Advisor’s total average return is 993% — a market-crushing outperformance compared to 214% for the S&P 500. Don't miss the latest top 10 list, available with Stock Advisor, and join an investing community built by individual investors for individual investors.

See the 10 stocks »

*Stock Advisor returns as of September 4, 2026.

Parkev Tatevosian, CFA has no position in any of the stocks mentioned. The Motley Fool has no position in any of the stocks mentioned. The Motley Fool has a disclosure policy. Parkev Tatevosian is an affiliate of The Motley Fool and may be compensated for promoting its services. If you choose to subscribe through his link, he will earn some extra money that supports his channel. His opinions remain his own and are unaffected by The Motley Fool.

☐ ☆ ✇ The Motley Fool

Should Investors Buy Microsoft Stock Instead of Apple Stock?

By: newsfeedback@fool.com (Parkev Tatevosian, CFA)

Microsoft (NASDAQ: MSFT) and Apple (NASDAQ: AAPL) generate hundreds of billions in revenue.

Missed Nvidia in 2009? This Rare Signal Is Flashing Again. In 2009, a "Double Down" signal flashed for a little-known chipmaker called Nvidia. For the first time in years, that same "Total Conviction" signal is flashing for a company 1/100th the size of Nvidia. Continue »

*Stock prices used were the afternoon prices of Sept. 2, 2026. The video was published on Sept. 4, 2026.

Should you buy stock in Apple right now?

Before you buy stock in Apple, consider this:

The Motley Fool Stock Advisor analyst team just identified what they believe are the 10 best stocks for investors to buy now… and Apple wasn’t one of them. The 10 stocks that made the cut could produce monster returns in the coming years.

Consider when Netflix made this list on December 17, 2004... if you invested $1,000 at the time of our recommendation, you’d have $445,833!* Or when Nvidia made this list on April 15, 2005... if you invested $1,000 at the time of our recommendation, you’d have $1,402,153!*

Now, it’s worth noting Stock Advisor’s total average return is 993% — a market-crushing outperformance compared to 214% for the S&P 500. Don't miss the latest top 10 list, available with Stock Advisor, and join an investing community built by individual investors for individual investors.

See the 10 stocks »

*Stock Advisor returns as of September 4, 2026.

Parkev Tatevosian, CFA has positions in Microsoft. The Motley Fool has positions in and recommends Apple and Microsoft. The Motley Fool has a disclosure policy. Parkev Tatevosian is an affiliate of The Motley Fool and may be compensated for promoting its services. If you choose to subscribe through his link, he will earn some extra money that supports his channel. His opinions remain his own and are unaffected by The Motley Fool.

☐ ☆ ✇ DailyCoin.com

Ripple CEO Urges: “Let’s Finish The Job” On CLARITY Act

By: Tadas Klimasevskis
Ripple CEO Urges: “Let’s Finish The Job” On CLARITY Act

“Proud to be in the room”, said Ripple’s Brad Garlinghouse as a landmark decision on CLARITY is coming.

Continue reading at DailyCoin.

☐ ☆ ✇ CoinGape

COIN and HOOD Stock Prediction After Strong US Jobs Data Boost Fed Rate Hike Odds

By: Frank bevah

COIN and HOOD Stock entered Friday under pressure after employment data revived expectations for a Federal Reserve rate increase. Coinbase price fell 4.21% to $184.59, while Robinhood declined 1.17% to $123.26 during afternoon trading. The losses followed Thursday’s crypto-linked rally, showing how quickly tighter-policy concerns can reverse risk appetite.  Ad Ad US Jobs Data Raises

The post COIN and HOOD Stock Prediction After Strong US Jobs Data Boost Fed Rate Hike Odds appeared first on CoinGape.

❌