FreshRSS

πŸ”’
❌ About FreshRSS
There are new articles available, click to refresh the page.
Yesterday β€” 6 September 2026CryptoPotato

Ripple Price Analysis: Where Is XRP Heading Next Week After Defending Its 200-Day EMA?

6 September 2026 at 20:09

Ripple’s XRP remains in a corrective phase after its sharp August breakout, with buyers struggling to regain control of the key overhead supply zone. The current structure suggests that the market may need more consolidation before another sustained directional move develops.

XRP Price Analysis: The Daily Chart

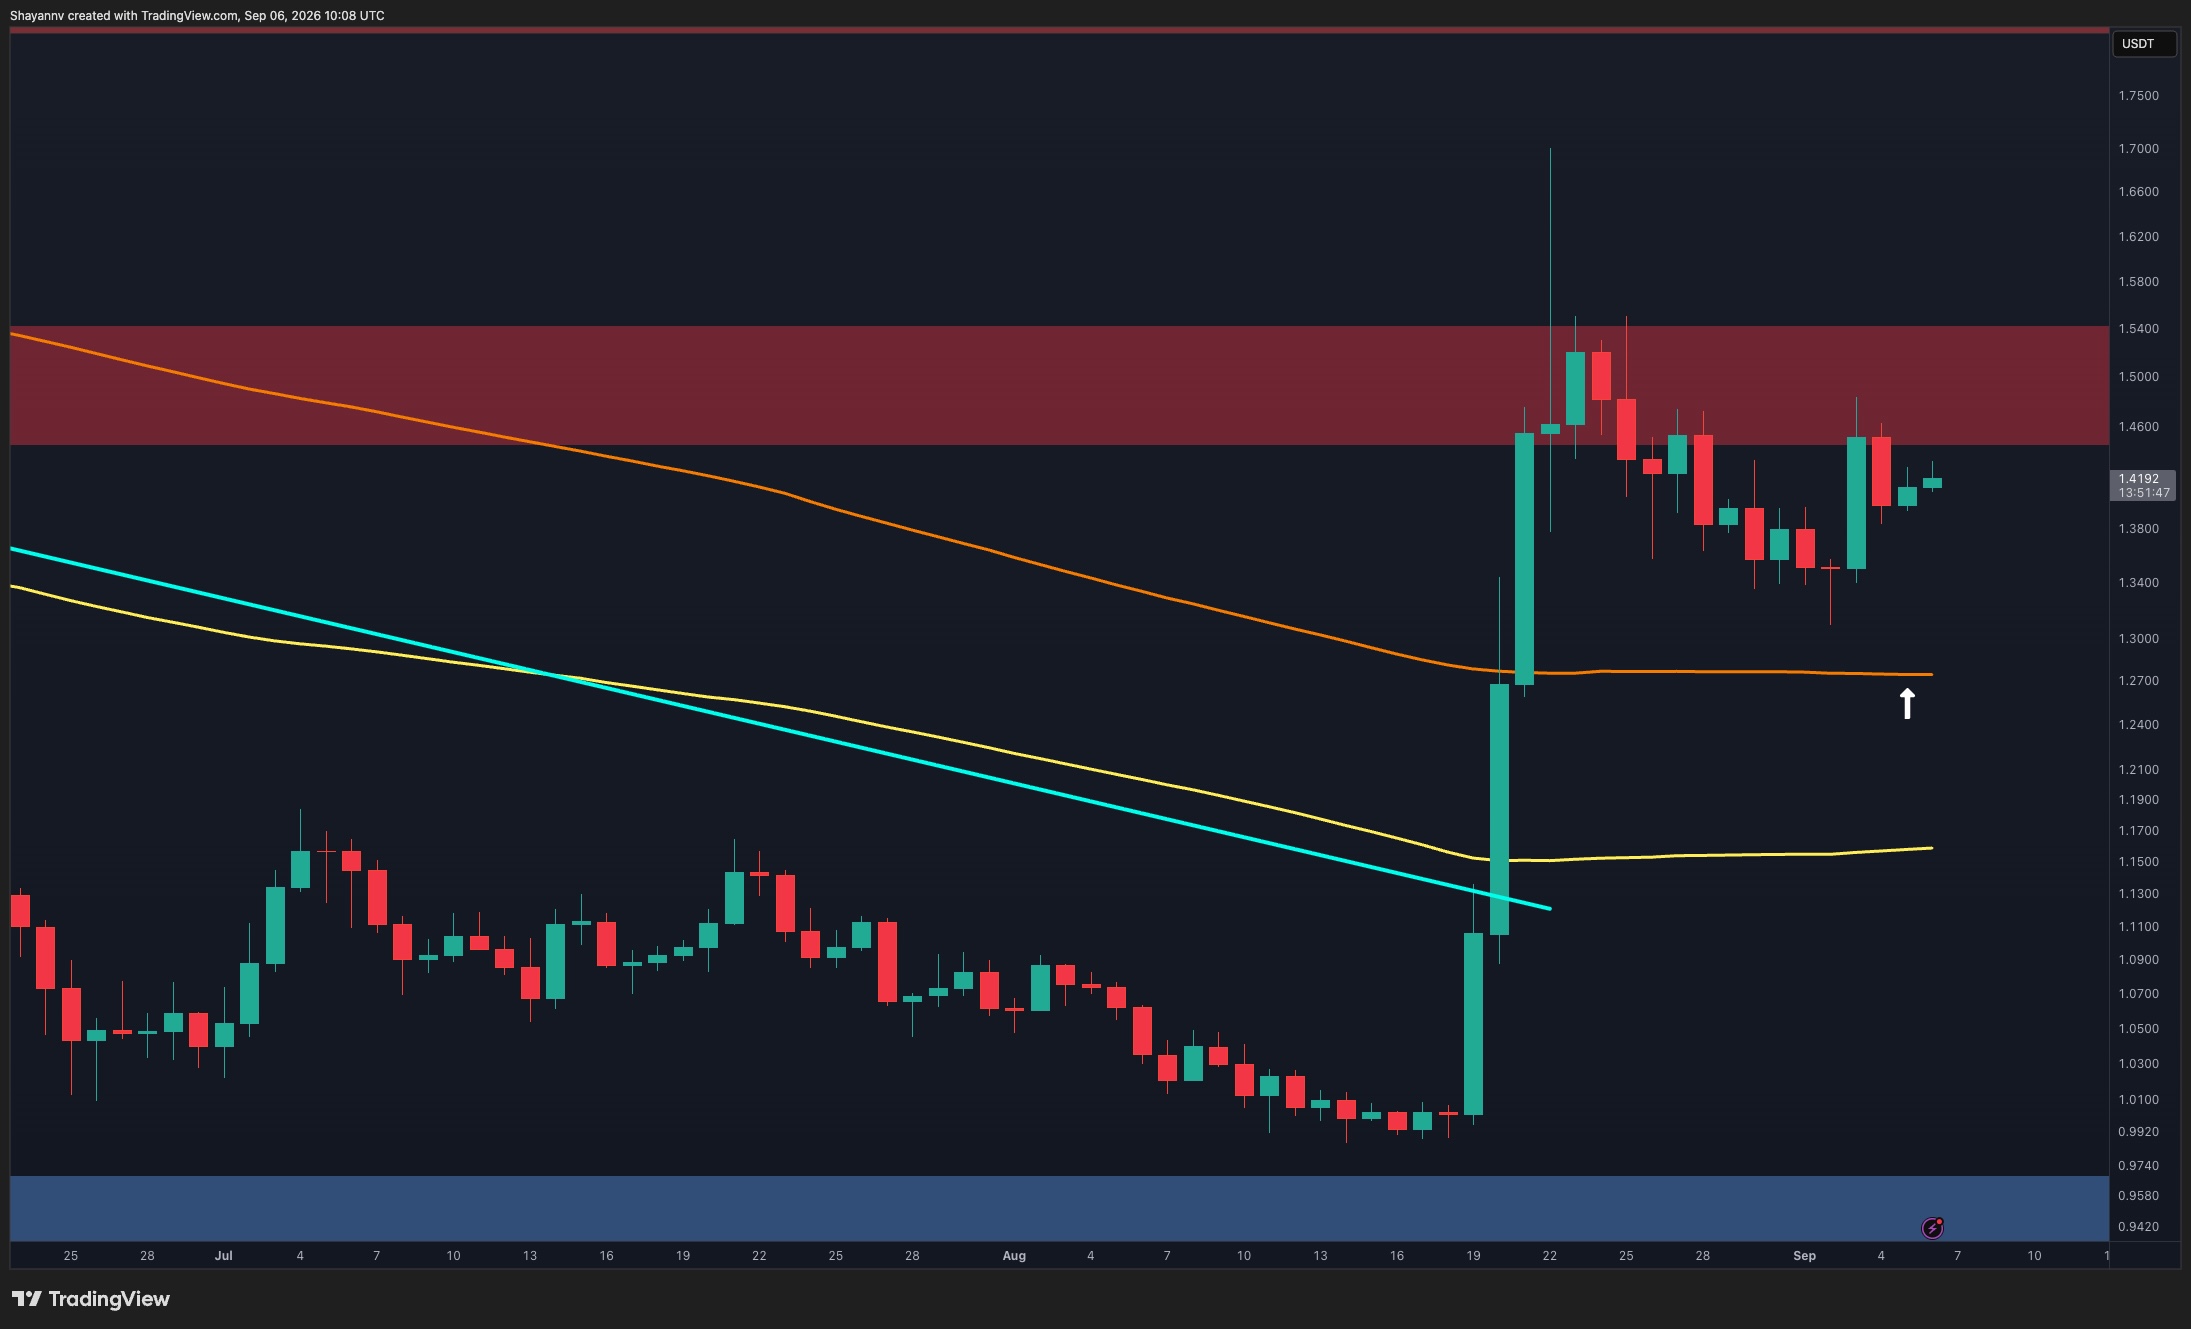
On the daily timeframe, XRP’s explosive rally from the $0.94-$0.97 support zone broke the previous descending structure and pushed the price as high as roughly $1.70. However, the breakout was followed by an equally notable rejection, and the asset has since been unable to establish itself above the $1.45-$1.54 resistance zone.

The price is currently trading around $1.42, just below this major supply area. More importantly, XRP continues to hold above the long-term moving average near $1.27, which has flattened after previously trending lower. This level represents an important structural support for the ongoing recovery.

As long as the $1.27 area holds, the recent weakness can still be viewed as consolidation following an impulsive rally. A daily close above the $1.45-$1.54 resistance zone would strengthen the bullish case and could eventually bring the $1.70 high back into focus. Conversely, losing the $1.27 support would substantially weaken the structure and increase the probability of a deeper retracement toward the lower moving average around $1.15.

XRP/USDT 4-Hour Chart

The 4-hour chart highlights a descending channel that has contained XRP since the initial surge. The asset has repeatedly failed to break through the channel’s upper boundary, which is now converging with the crucial $1.45-$1.54 resistance zone.

The latest rebound from around $1.34 has brought XRP back toward $1.42, placing it directly beneath this descending resistance. This makes the current area particularly important. A breakout above the trendline followed by a successful reclaim of $1.45 could signal that the corrective structure is ending, with the $1.50-$1.54 zone becoming the next hurdle.

However, another rejection would preserve the descending structure and could send the token back toward $1.34-$1.38. Below there, the channel’s lower boundary is approaching the $1.27-$1.30 region, which overlaps with a clearly defined support zone.

Therefore, XRP remains caught between improving support underneath and persistent resistance overhead. Until the descending channel is broken, the short-term outlook appears more consistent with continued consolidation and potentially another corrective move rather than an immediate bullish continuation.

The post Ripple Price Analysis: Where Is XRP Heading Next Week After Defending Its 200-Day EMA? appeared first on CryptoPotato.

Ethereum Price Analysis: ETH Consolidates at $2.5K as Whale Participation Stalls

6 September 2026 at 20:04

Ethereum is attempting to stabilize after its explosive August breakout, but the follow-through has remained limited. ETH is holding around $2.5K, yet repeated swings within the same range suggest the market is still digesting the rally rather than establishing a fresh directional trend.

Ethereum Price Analysis: The Daily Chart

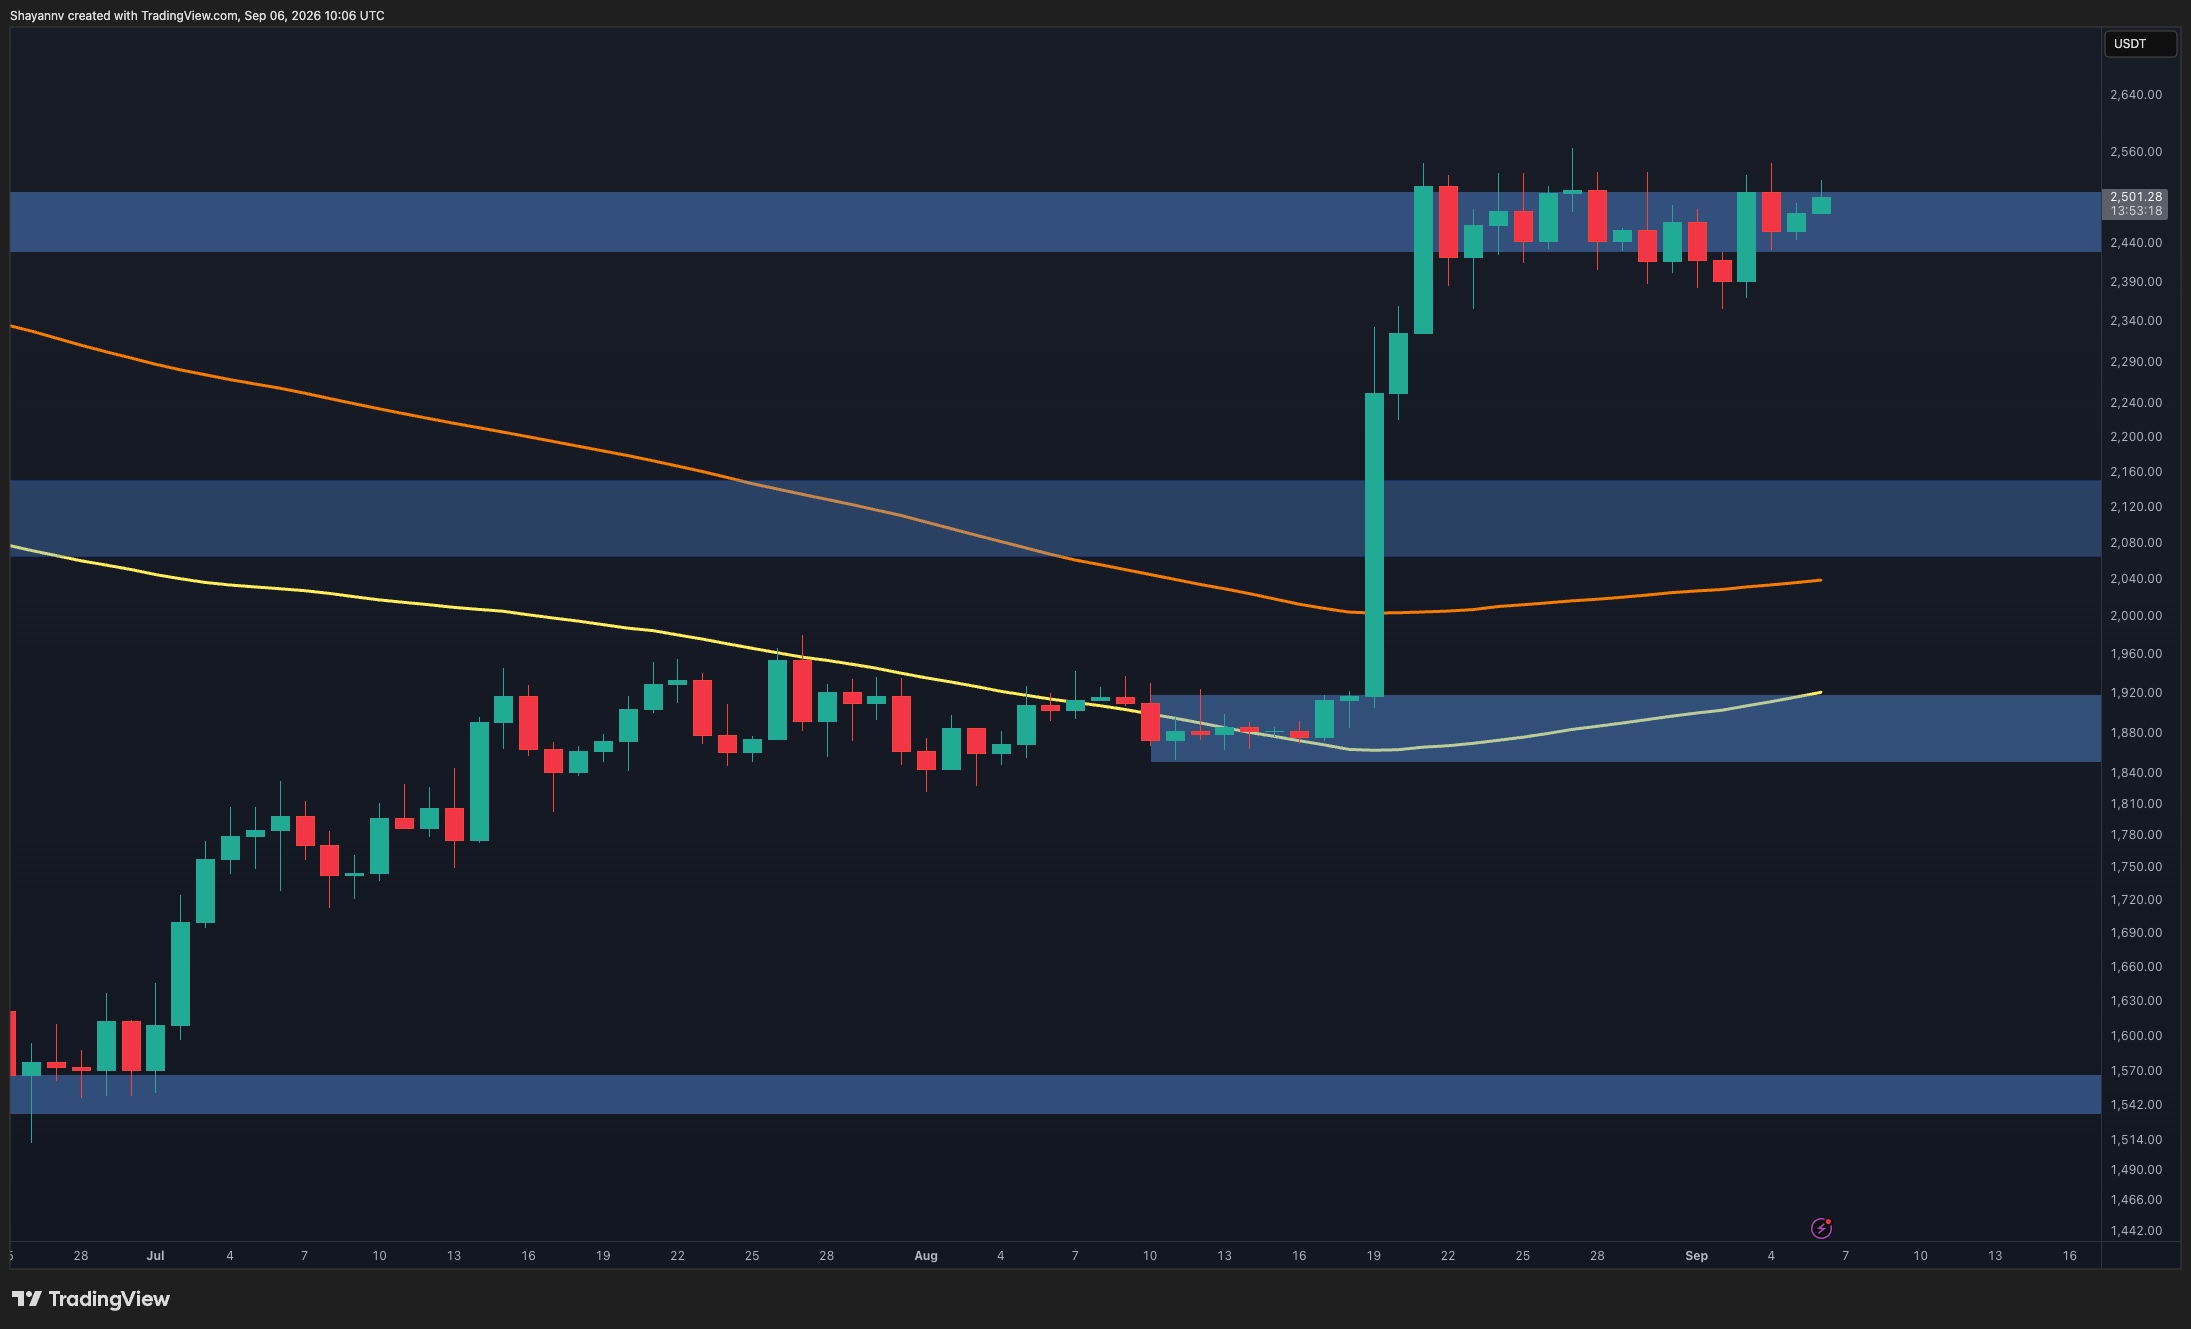
ETH’s broader structure remains constructive after the powerful breakout from the $1.85K-$1.92K base. Yet, momentum has stalled inside the $2.44K-$2.52K resistance area. Several daily candles have tested this region without producing a sustained breakout, while repeated upper and lower wicks indicate considerable indecision. ETH is currently trading near $2.5K, close to the upper portion of this range.

A clean daily breakout above roughly $2.52K-$2.56K would be required to confirm that buyers have regained control and potentially initiate another impulsive leg higher. Until then, continued consolidation remains the more likely scenario.

On the downside, losing the $2.39K-$2.44K area would weaken the current setup and increase the probability of a deeper correction. In that case, the $2.08K-$2.15K former resistance zone would become the major medium-term support to watch.

ETH/USDT 4-Hour Chart

The 4-hour timeframe shows ETH trapped in a broad consolidation between approximately $2.35K and $2.56K following the vertical advance from below $2K.

The important development is that buyers have repeatedly stepped in near the lower portion of this range. The latest recovery from around $2.38K has carried ETH back toward $2.5K, placing the price once again near the upper resistance region. Yet multiple previous attempts around $2.5K-$2.55K have failed to generate continuation.

Therefore, another rejection could keep the market oscillating inside the existing range. A breakdown below the $2.35K-$2.39K floor would be more consequential and could expose the first major pullback zone around $2.22K-$2.27K.

Conversely, sustained acceptance above $2.52K-$2.56K would invalidate the near-term consolidation scenario and indicate that buyers are ready to resume the broader bullish move.

Sentiment Analysis

Ethereum’s Spot Average Order Size provides an important clue regarding the lack of follow-through. The latest observations around $2.4K-$2.5K are predominantly gray, classified as normal-sized orders, while the green whale-order activity visible during earlier portions of the recovery has largely disappeared.

This suggests that ETH’s recent push toward $2.5K has not been accompanied by notable large-player participation. There is also no visible concentration of retail orders in the latest data, pointing to an absence of aggressive positioning from either side.

The lack of dominant whale activity fits well with the price action. With neither substantial large-scale demand nor supply appearing in the metric, ETH may remain prone to low-conviction, choppy movements inside its current range. A renewed appearance of significant whale orders could therefore be an important signal that the consolidation is approaching a more decisive resolution.

The post Ethereum Price Analysis: ETH Consolidates at $2.5K as Whale Participation Stalls appeared first on CryptoPotato.

Before yesterdayCryptoPotato

Bitcoin Price Analysis: The Good and the Bad for BTC After Latest $82.4K Rejection

5 September 2026 at 19:12

Bitcoin remains locked in a post-breakout consolidation phase, but the latest rejection from the upper end of the structure shows that buyers are still struggling to generate sustained momentum above $80K. The broader trend remains constructive, although the current range leaves BTC vulnerable to further liquidity-driven swings before its next directional move.

Bitcoin Price Analysis: The Daily Chart

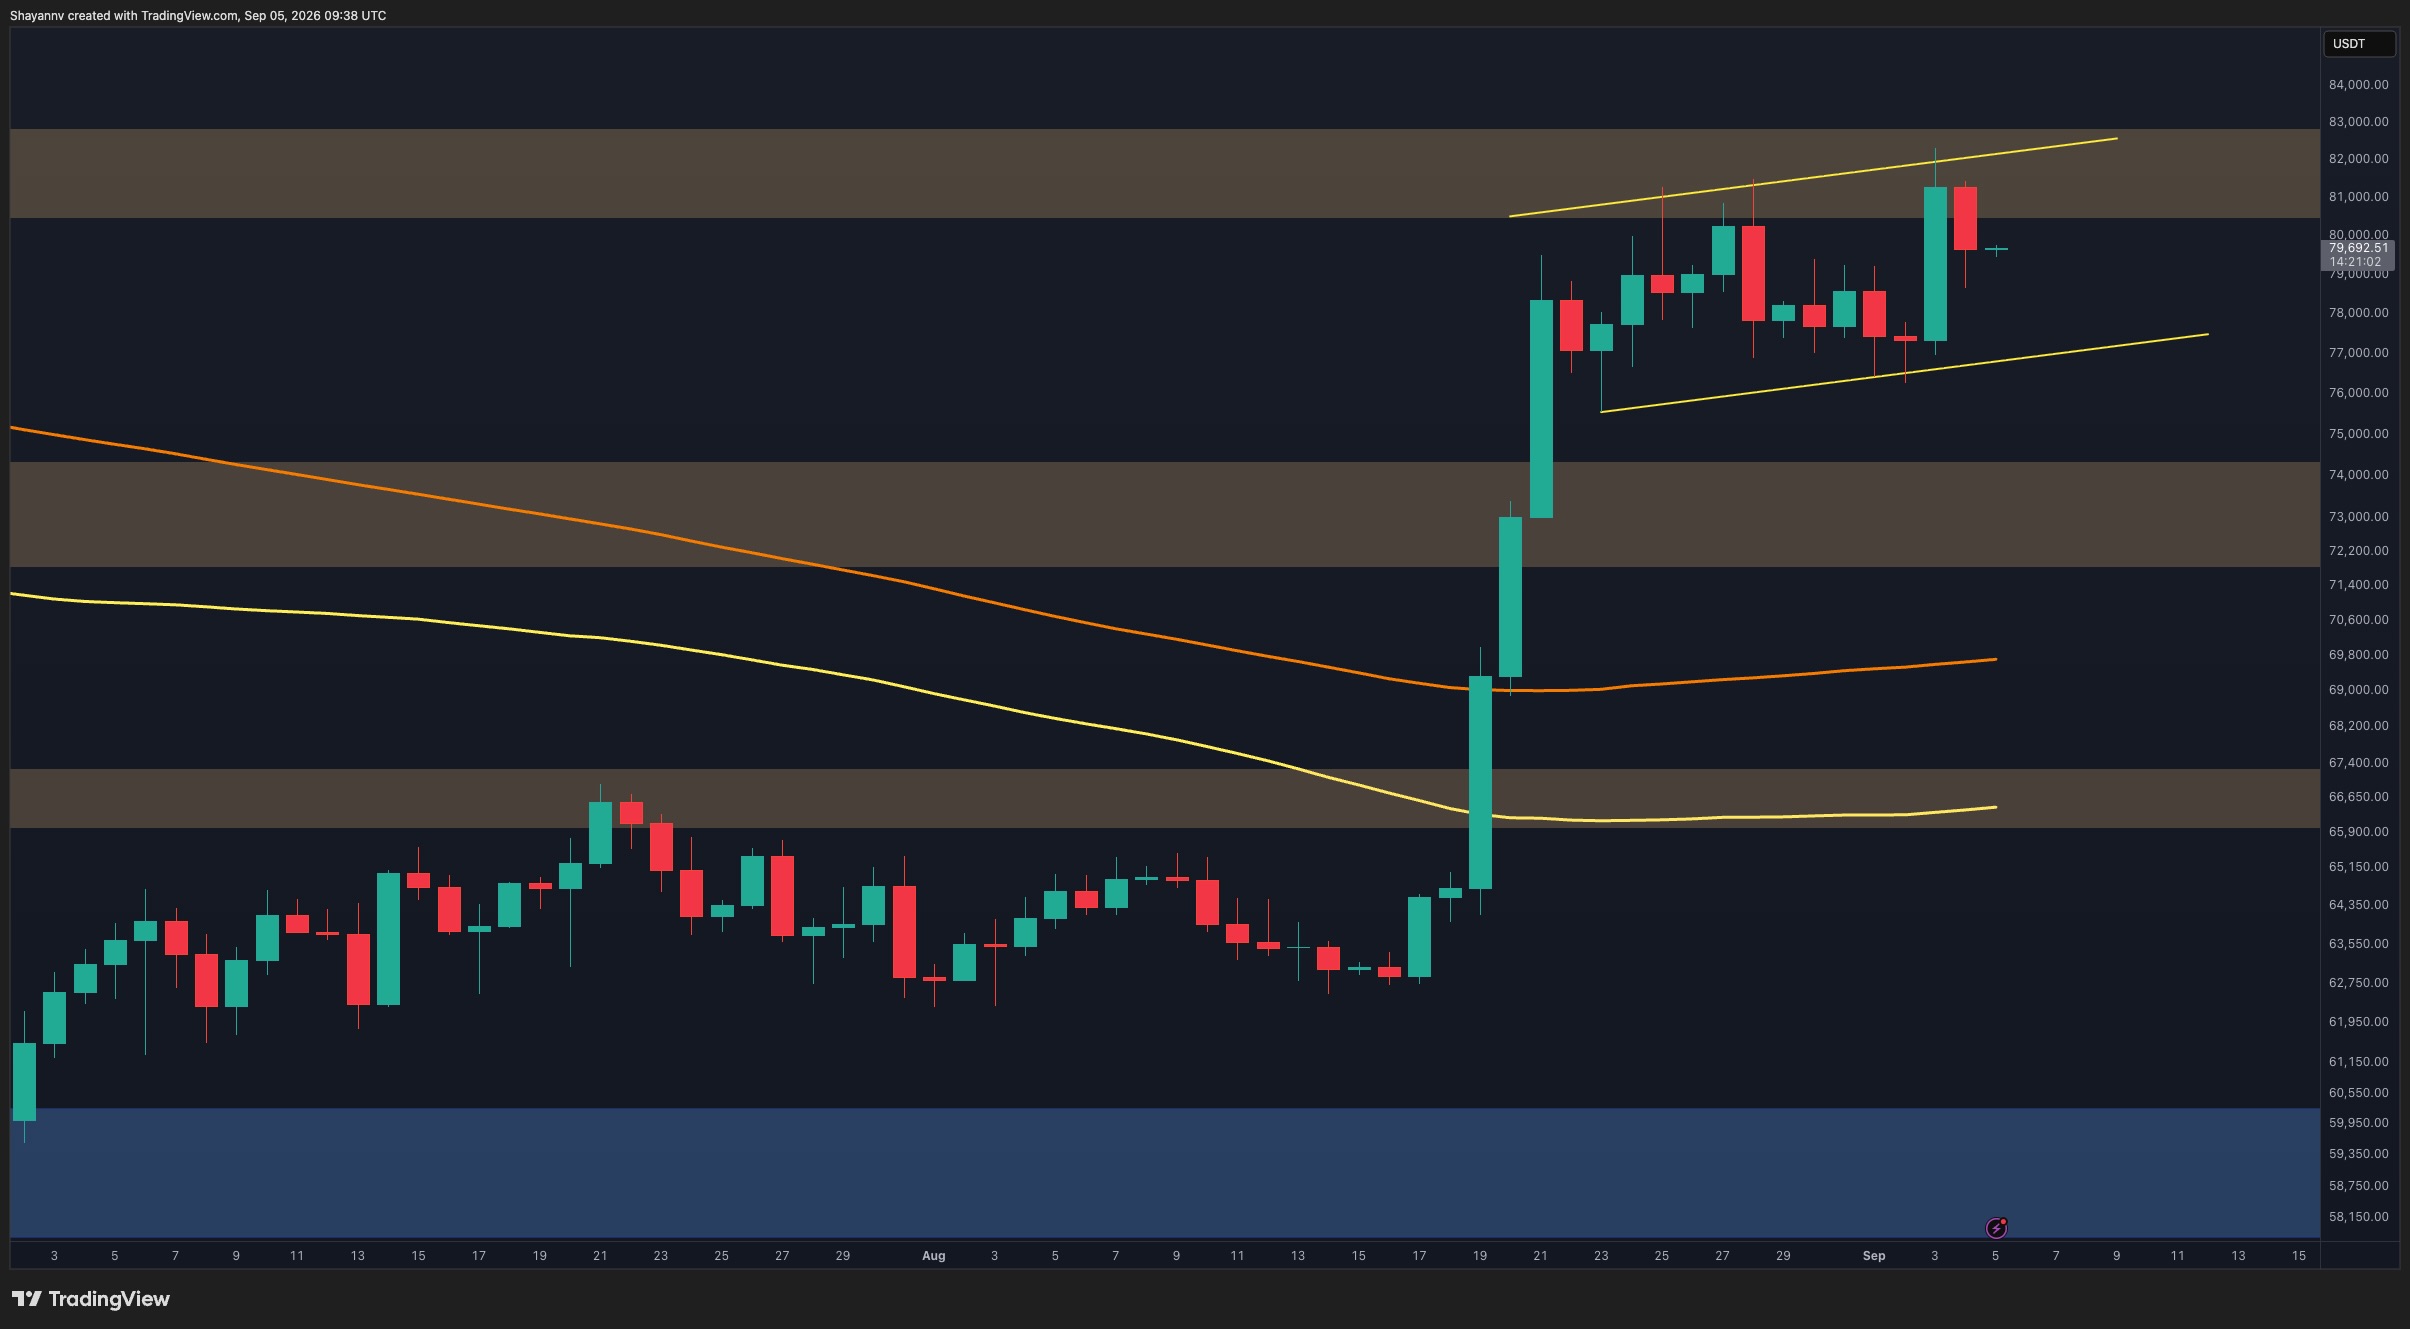
Bitcoin’s daily structure remains significantly stronger than it was before the August breakout. The asset is holding well above the former $72K-$74.5K resistance zone and both moving averages, preserving the broader bullish shift despite the recent loss of momentum.

However, BTC has repeatedly encountered selling pressure inside the $80.5K-$82.5K resistance zone. The latest attempt briefly pushed toward $82K before being rejected, sending the price back below $80K. This inability to establish acceptance above the resistance area suggests that supply remains active at higher prices.

At the same time, the asset continues to trade within a gradually ascending channel. Its lower boundary currently sits around the $76K-$77K region, making this the most important nearby structural support. As long as BTC remains above this area, the ongoing price action can still be interpreted as consolidation following the sharp rally rather than a confirmed bearish reversal.

A decisive breakout above the $80.5K-$82.5K zone would strengthen the continuation scenario. Conversely, losing the channel support around $76K-$77K could trigger a more substantial correction, with the former $72K-$74.5K breakout zone becoming the next major area of interest.

BTC/USDT 4-Hour Chart

The 4-hour chart highlights the market’s current indecision more clearly. BTC rallied from the lower boundary of the ascending structure near $76.5K-$77K and quickly tested the $81K-$82K area, only for sellers to reject the move once again.

Price subsequently dropped toward $79.5K and has entered a tight short-term consolidation. This creates a notable contrast between the rising channel structure and the repeated failures near its upper boundary. Buyers are still defending higher lows, but they have yet to demonstrate enough momentum to convert the $80.5K-$82.5K supply area into support.

The $76.5K-$77.5K region therefore remains crucial. Another test of this zone could determine whether the ascending structure survives. A strong reaction would keep a renewed push toward $81K-$82K in play, whereas a breakdown would indicate that the consolidation is transitioning into a deeper corrective phase.

Sentiment Analysis

The one-week BTC liquidation heatmap shows substantial liquidity on both sides of the current price, which supports the possibility of continued choppy trading and liquidity sweeps.

Above the market, notable liquidation concentrations appear around $81K-$82K and extend toward approximately $84K. These clusters could attract price if buyers regain momentum.

However, the downside liquidity is particularly relevant following the latest rejection. A broad and comparatively dense concentration is visible below the market, especially around the $76K-$78K region. This aligns closely with the lower boundary of the ascending technical structure.

As a result, a downside liquidity sweep toward $76K-$78K remains a plausible near-term scenario before another recovery attempt. Such a move would not automatically invalidate the broader bullish setup, but a sustained breakdown beneath this region would increase the probability of a deeper retracement toward the $72K-$74.5K support zone.

The post Bitcoin Price Analysis: The Good and the Bad for BTC After Latest $82.4K Rejection appeared first on CryptoPotato.

Ethereum Price Analysis: ETH Rejected at $2.5K Again – What Happens Next?

4 September 2026 at 17:14

Ethereum has staged a sharp recovery from the June lows and is now consolidating below $2.5K after reclaiming several important technical levels. The daily structure has improved materially, but ETH is still struggling at a key resistance area, while the latest taker-flow data suggests that aggressive buying has not yet fully confirmed the move.

Ethereum Price Analysis: The Daily Chart

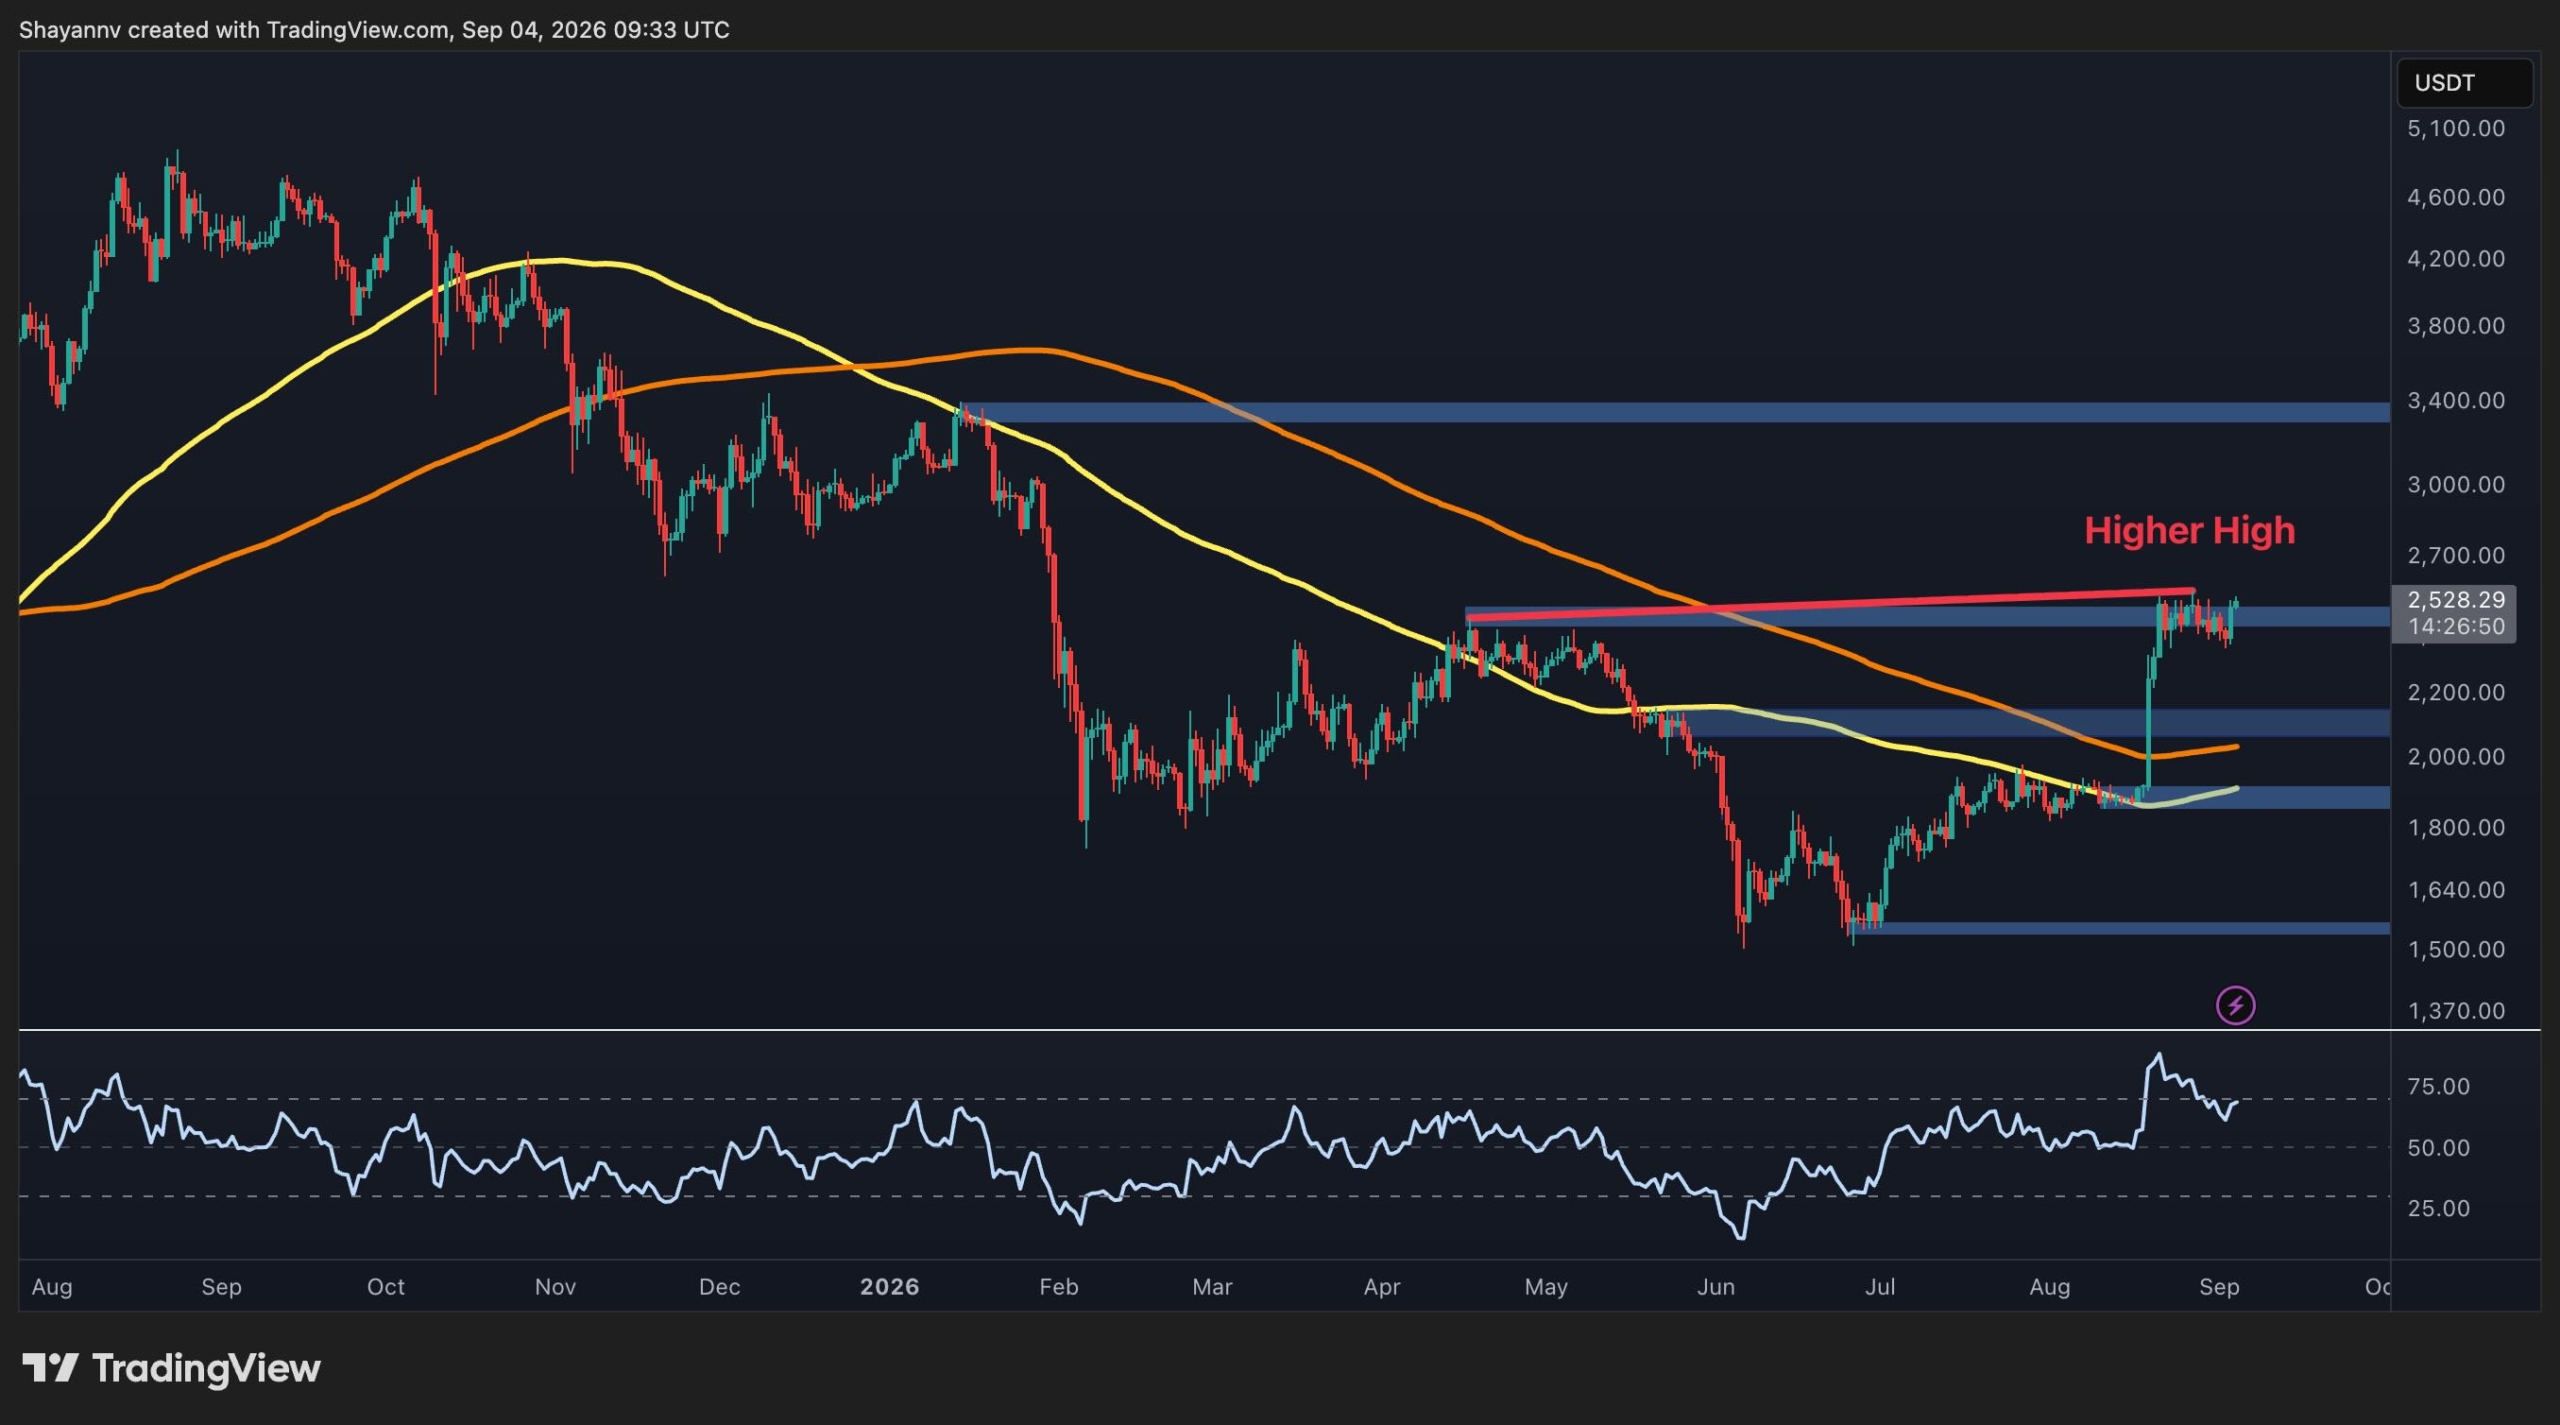
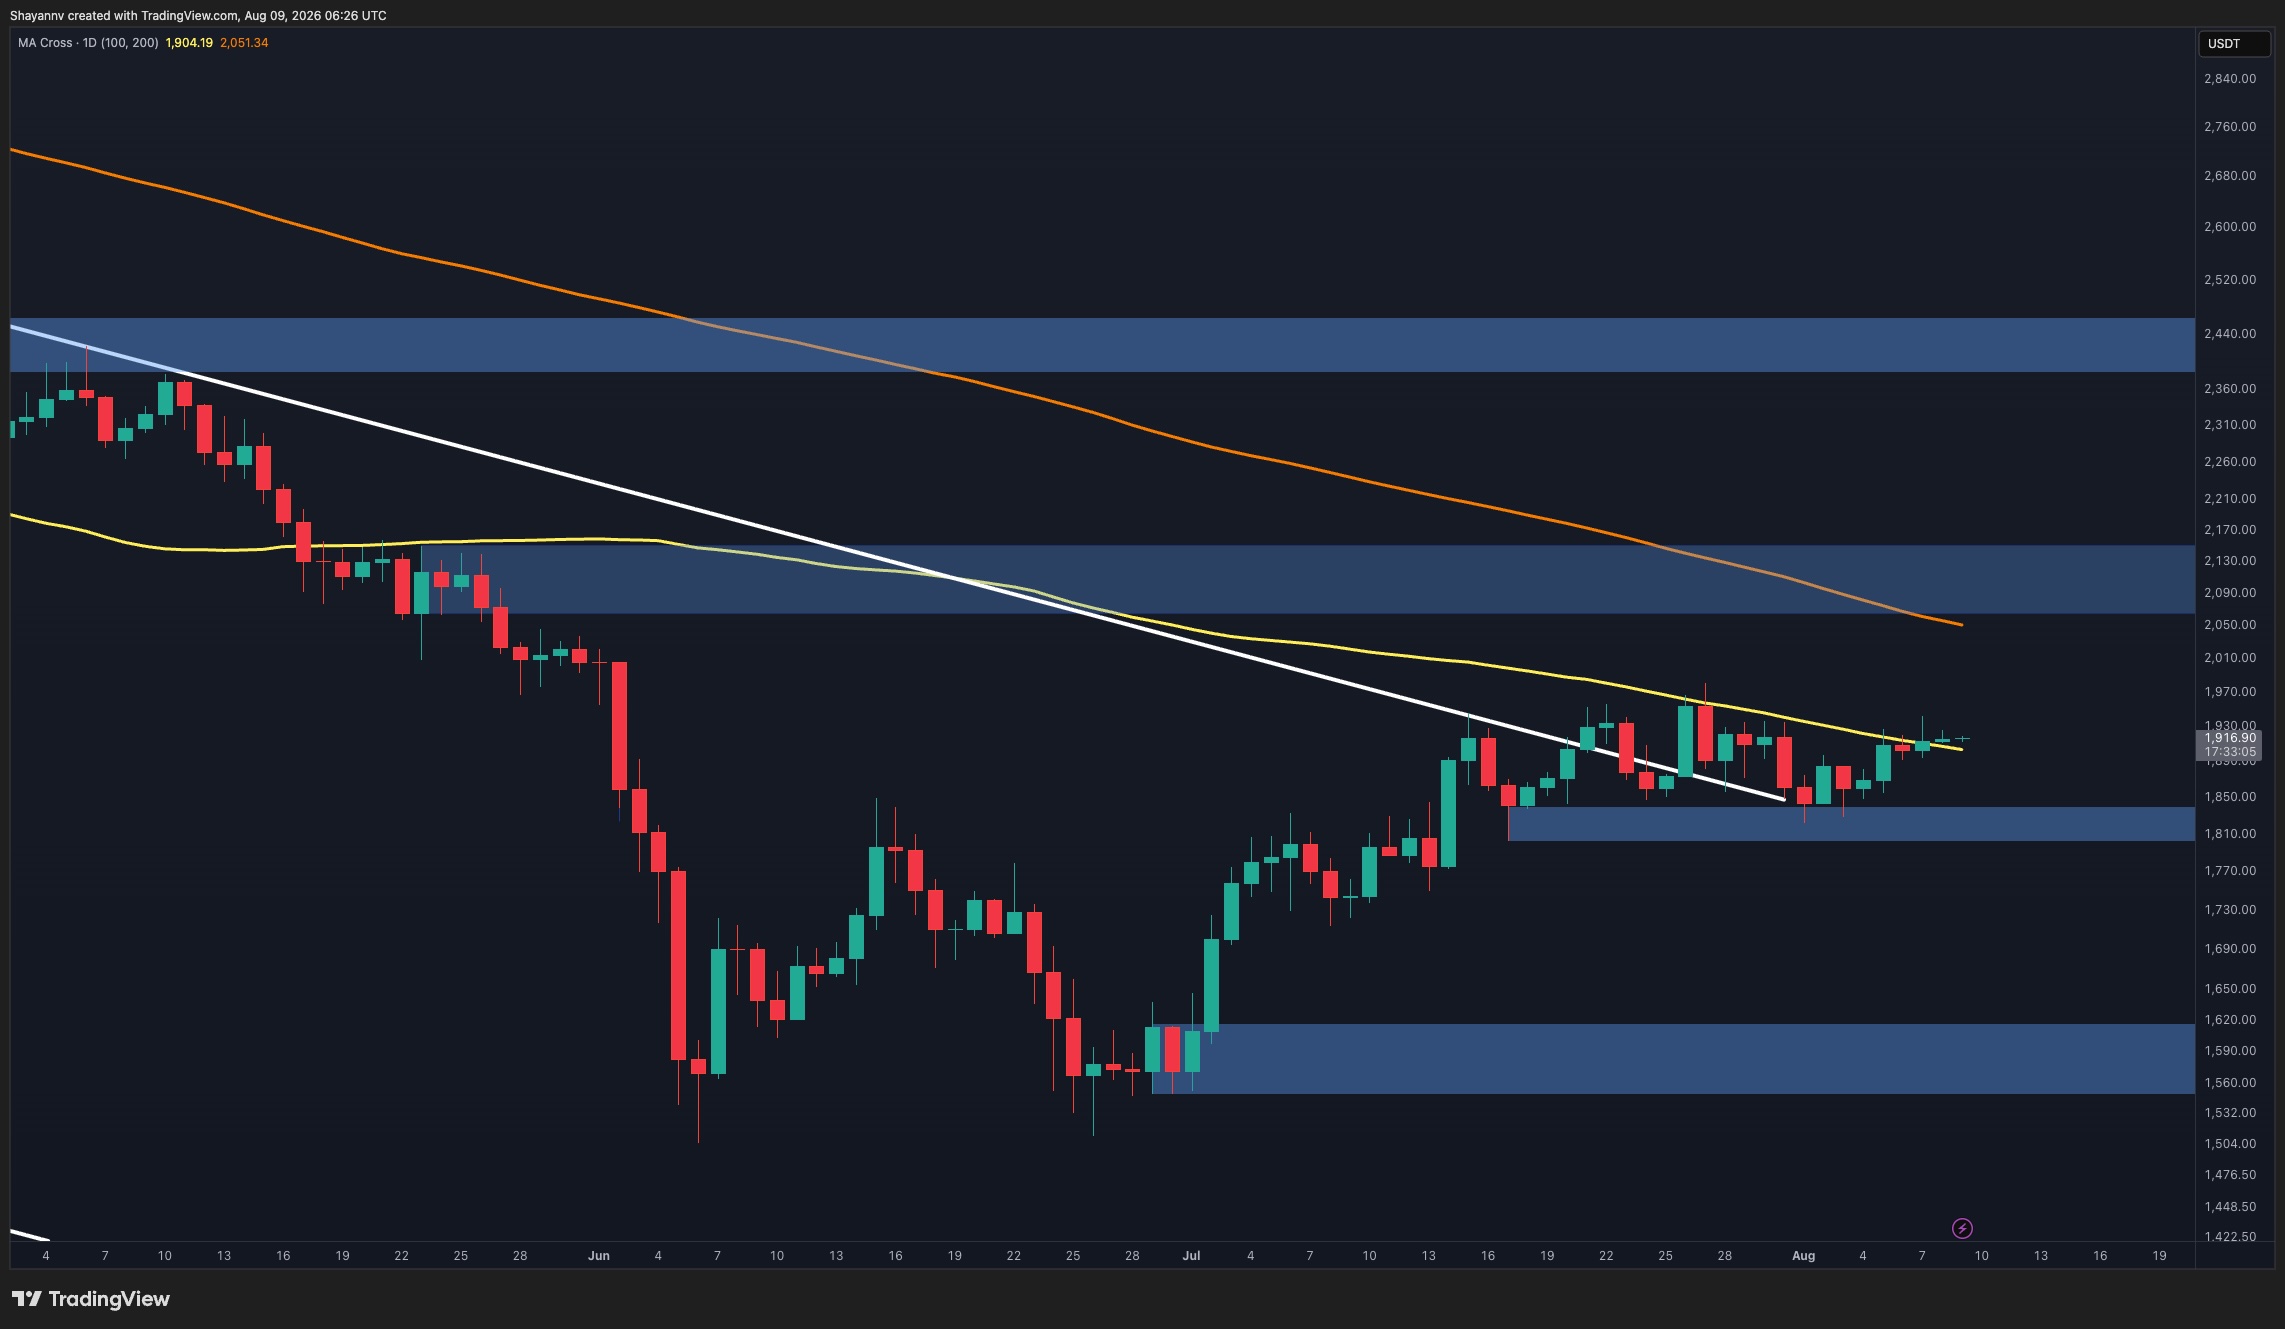
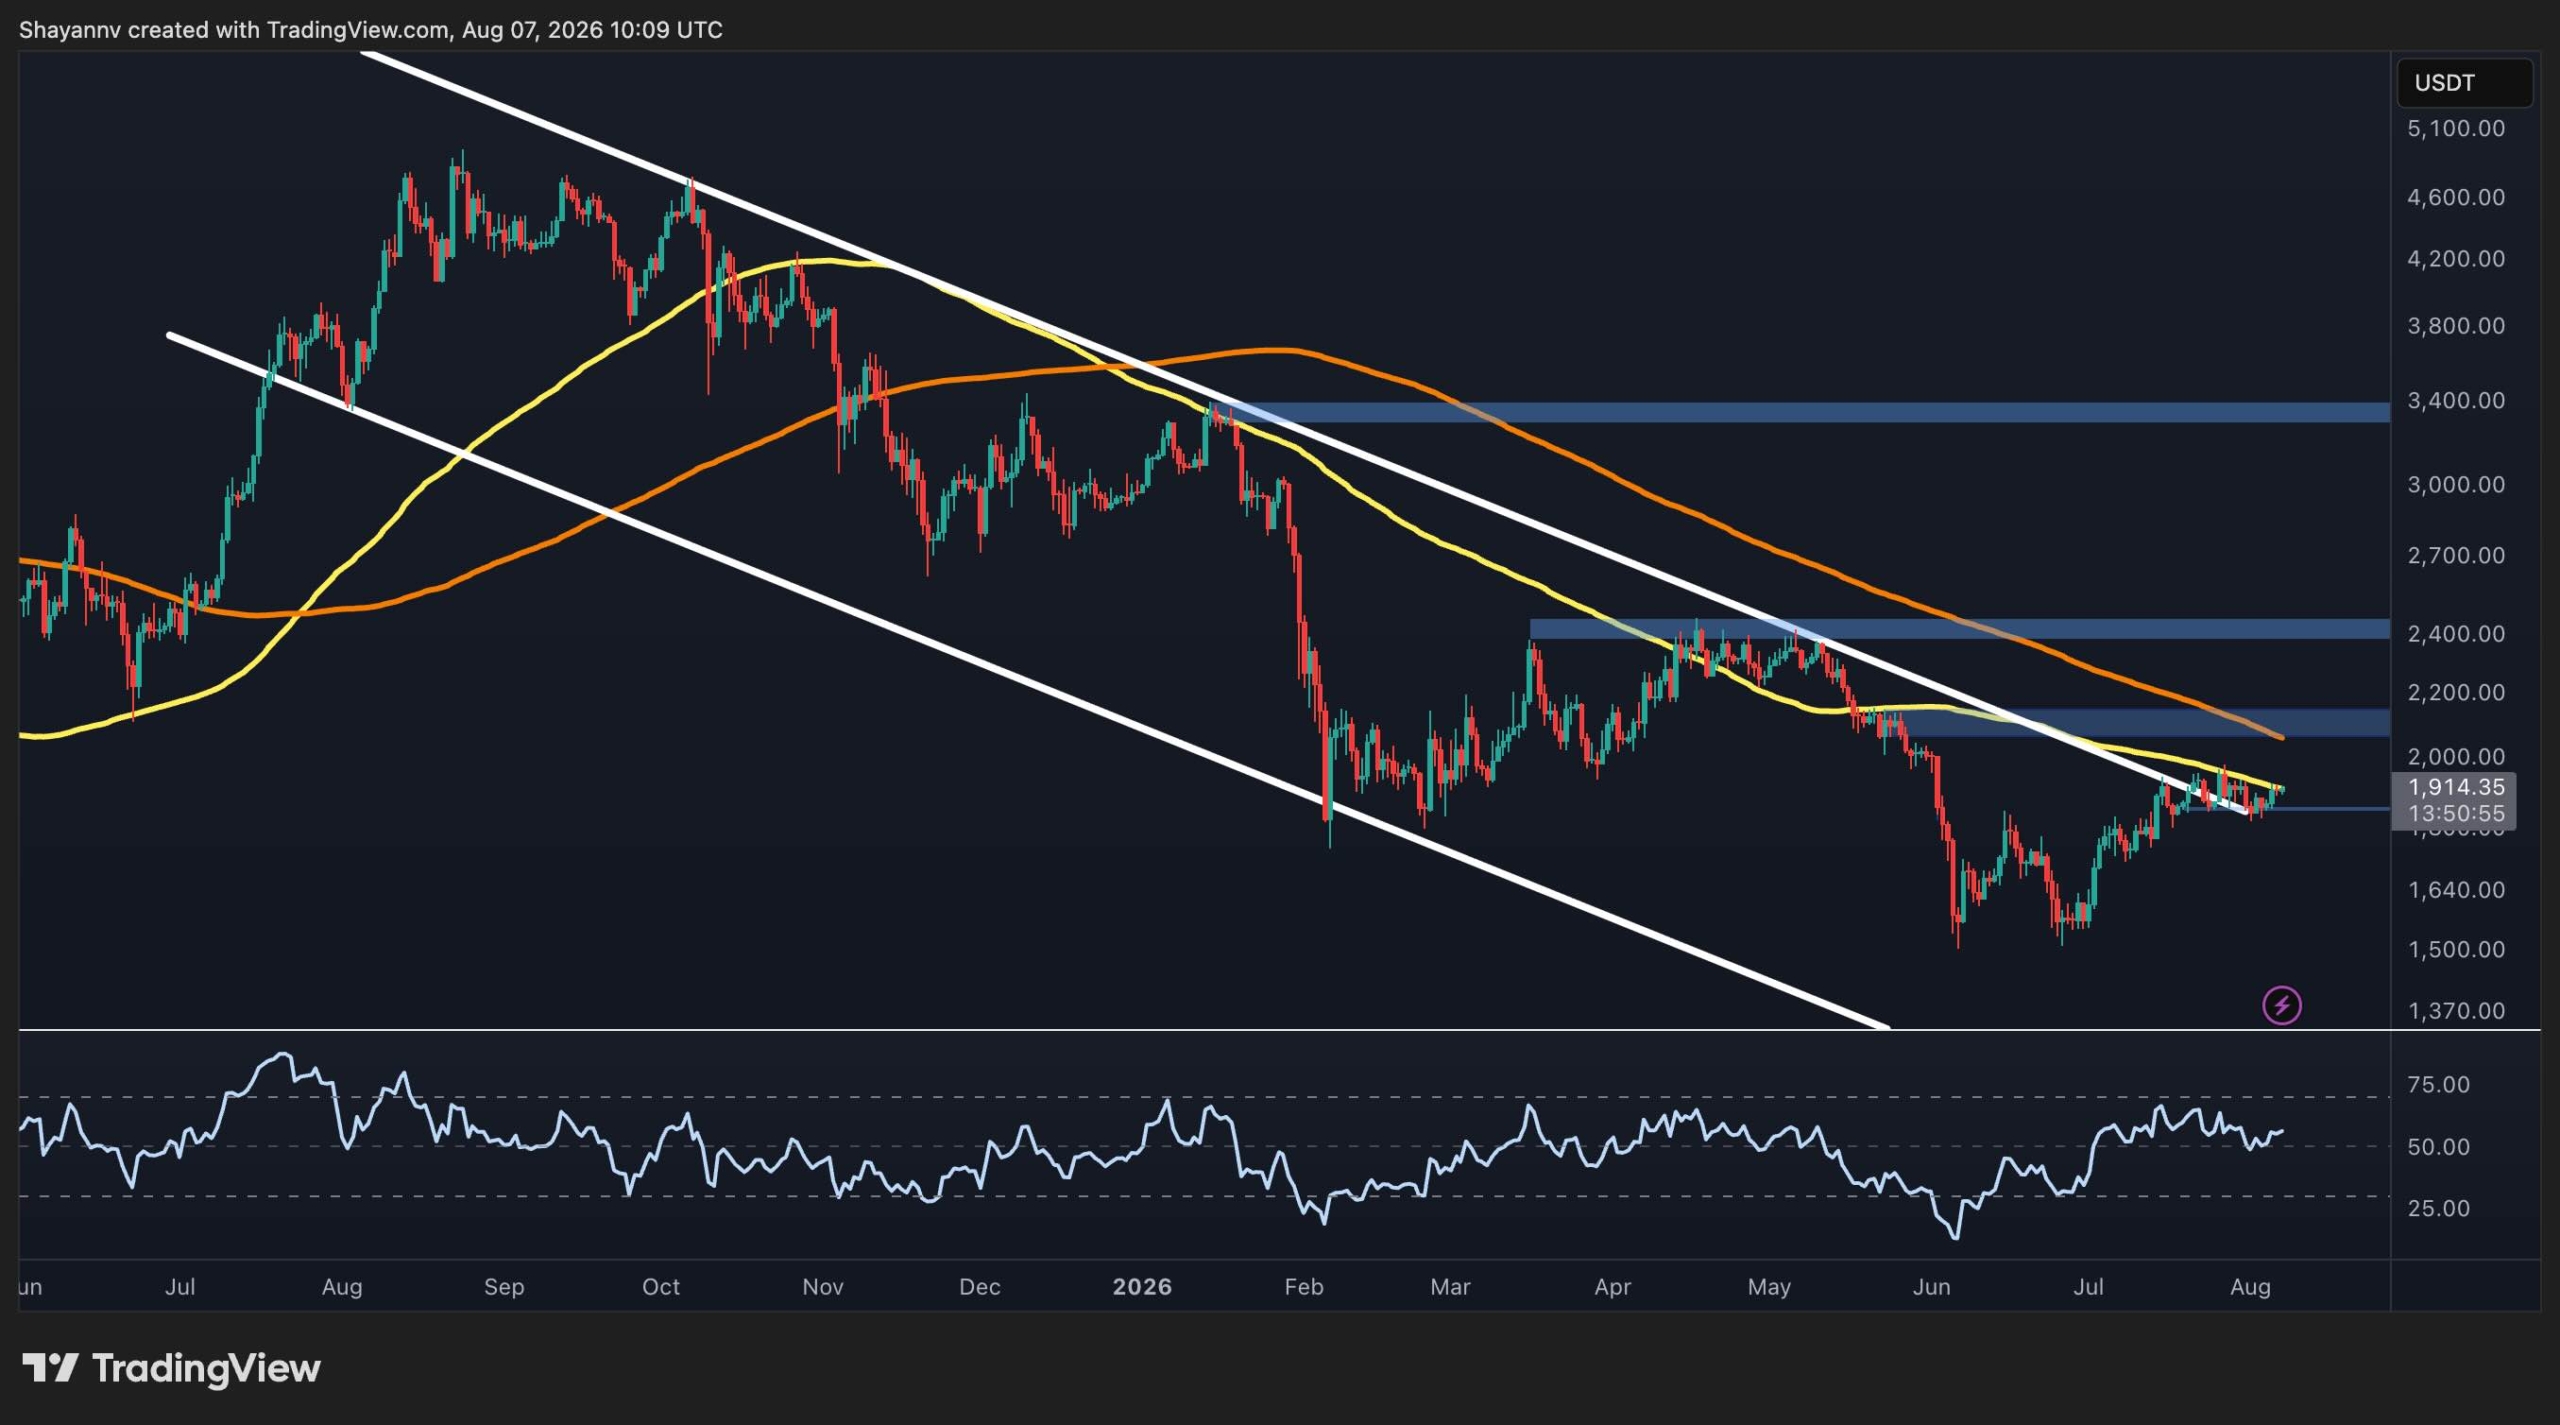
The daily chart shows a clear structural recovery from the $1.5K area. ETH subsequently reclaimed the $1.9K zone and pushed above the $2K mark, with the latest impulsive move taking price toward $2.5K.

The most important development is the price moving above the previous swing-high area around $2.45K and finally creating a higher high after months of decline. However, the asset is still sitting directly below the $2.5K resistance zone and has not yet cleared it after it was rejected again today. Therefore, further upside may require a decisive daily breakout rather than another rejection from the same area.

The 100-day and 200-day moving averages have also become more constructive. Both are now sloping upward after being reclaimed, with the 200-day moving average around the $2K region being the most important support element buyers should defend.

If ETH establishes a daily close above the $2.5K resistance zone, the next major upside area visible on the chart is the next swing high at $3.4K. Conversely, a rejection could send ETH back toward the $2K-$2.1K region, which appears to be the key structural support that must be held at all costs.

ETH/USDT 4-Hour Chart

The 4-hour chart shows that most of the recent advance occurred through a very aggressive vertical move from roughly $1.9K toward $2.5K. Since then, ETH has been consolidating inside a tight range, roughly between $2.35K and $2.55K.

This consolidation is important because it follows a strong impulsive breakout. Rather than immediately giving back the entire move, ETH has spent several weeks holding above the previous breakout area. The latest candles are also moving toward the upper boundary of the range.

The $2.4K-$2.5K area is therefore the key near-term pivot. Holding around this region would preserve the bullish structure and could allow another attempt to break out higher. This would strengthen the continuation case and potentially expose the $2.8K area before the larger $3.4K resistance zone.

On the downside, a loss of the consolidation range’s low around $2.4K would weaken the immediate setup and could trigger a deeper retracement toward the $2.25K order block. Meanwhile, the 4-hour RSI remains constructive, although it has cooled from its recent spike. This suggests that momentum is still positive without being as stretched as it was immediately after the breakout.

Sentiment Analysis

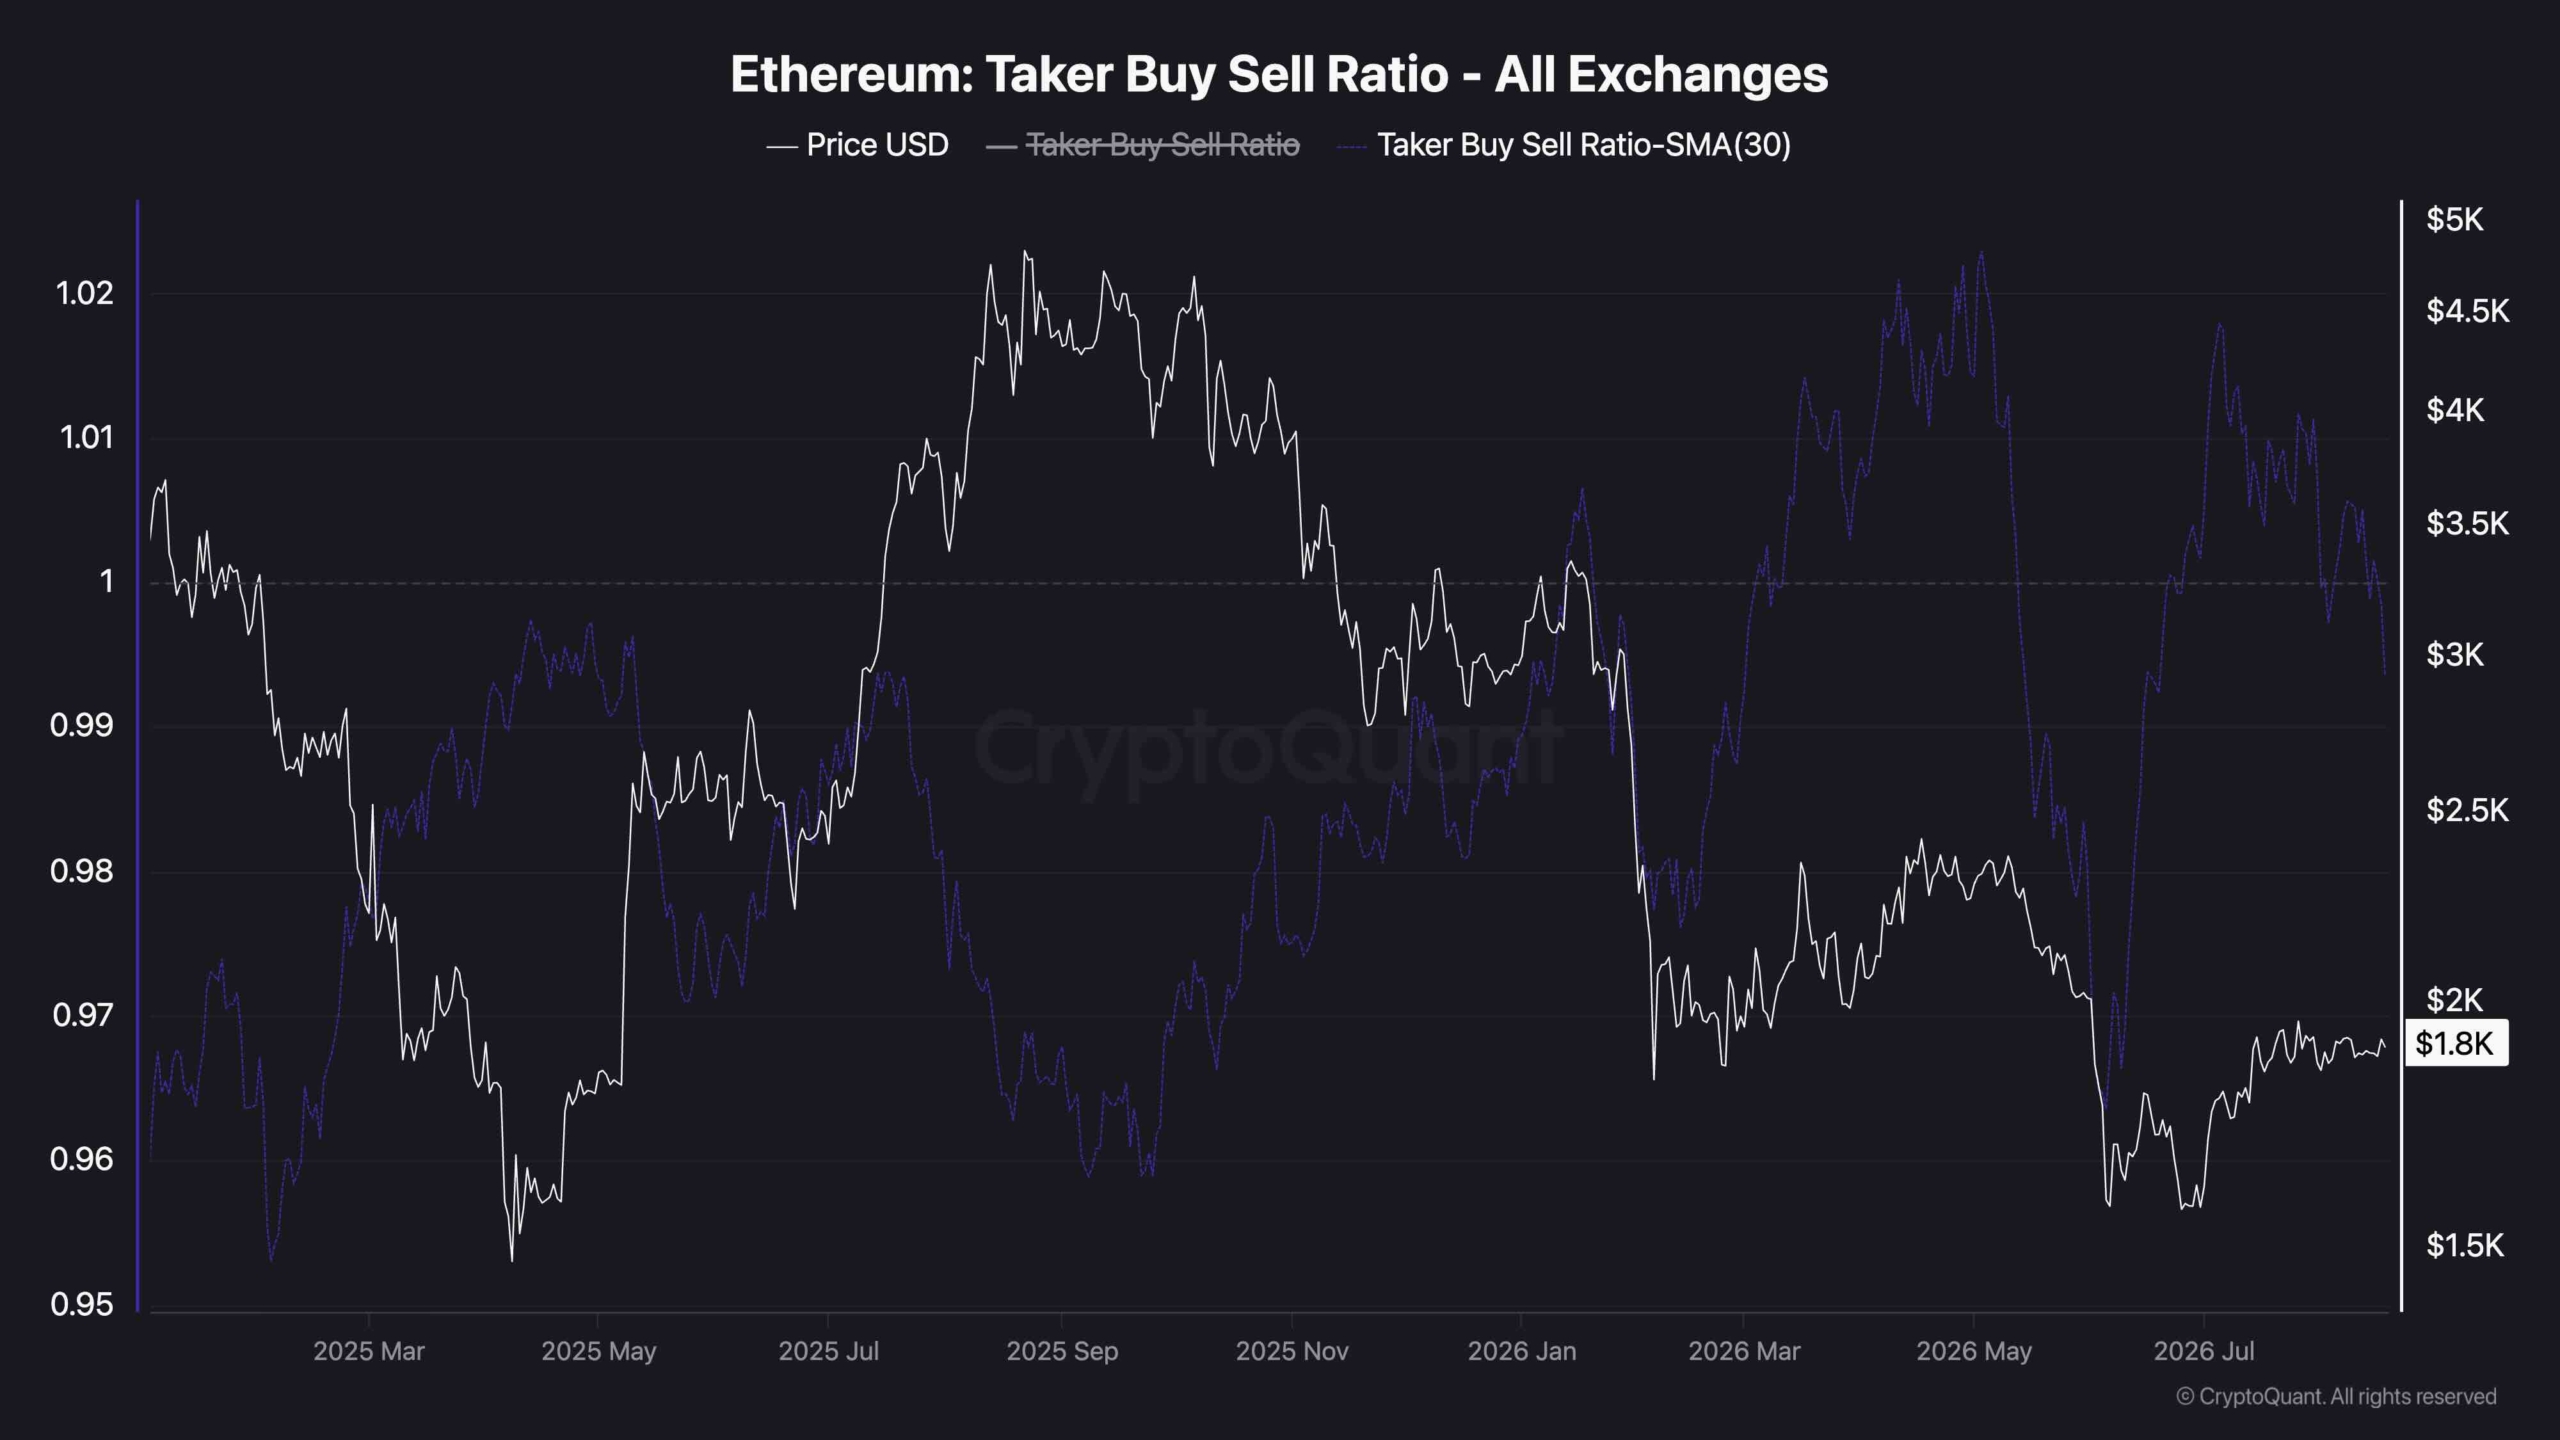
The Ethereum Taker Buy/Sell Ratio chart provides a more cautious signal. The 30-day moving average of the metric has recently dropped below the neutral 1.0 levelΒ  again and appears to be hovering around 0.995, meaning aggressive sell orders have slightly outweighed aggressive buy orders across exchanges.

This is notable because ETH has simultaneously remained close to $2.5K. In other words, the latest price strength has not been accompanied by a strong increase in taker buying pressure.

The divergence does not necessarily invalidate the bullish technical structure, but it does suggest that the current consolidation may need another wave of genuine spot or aggressive futures demand before ETH can sustain a larger breakout. A move back above 1.0 in the taker buy/sell ratio alongside a decisive break above $2.5K would provide stronger confirmation for continuation and potentially lead to a genuine market recovery after months of downtrend.

Β 

The post Ethereum Price Analysis: ETH Rejected at $2.5K Again – What Happens Next? appeared first on CryptoPotato.

BTC Price Analysis: Bitcoin Rebounds From $76K but Crucial Resistance Remains Above $80K

3 September 2026 at 17:17

Bitcoin is holding above $78K after a sharp recovery from the $60K area, but the latest price action suggests that buyers have yet to secure a decisive breakout above the upper resistance levels. At the same time, the exchange whale ratio has risen significantly, adding a potentially bearish supply-side signal to the otherwise constructive technical structure.

Bitcoin Price Analysis: The Daily Chart

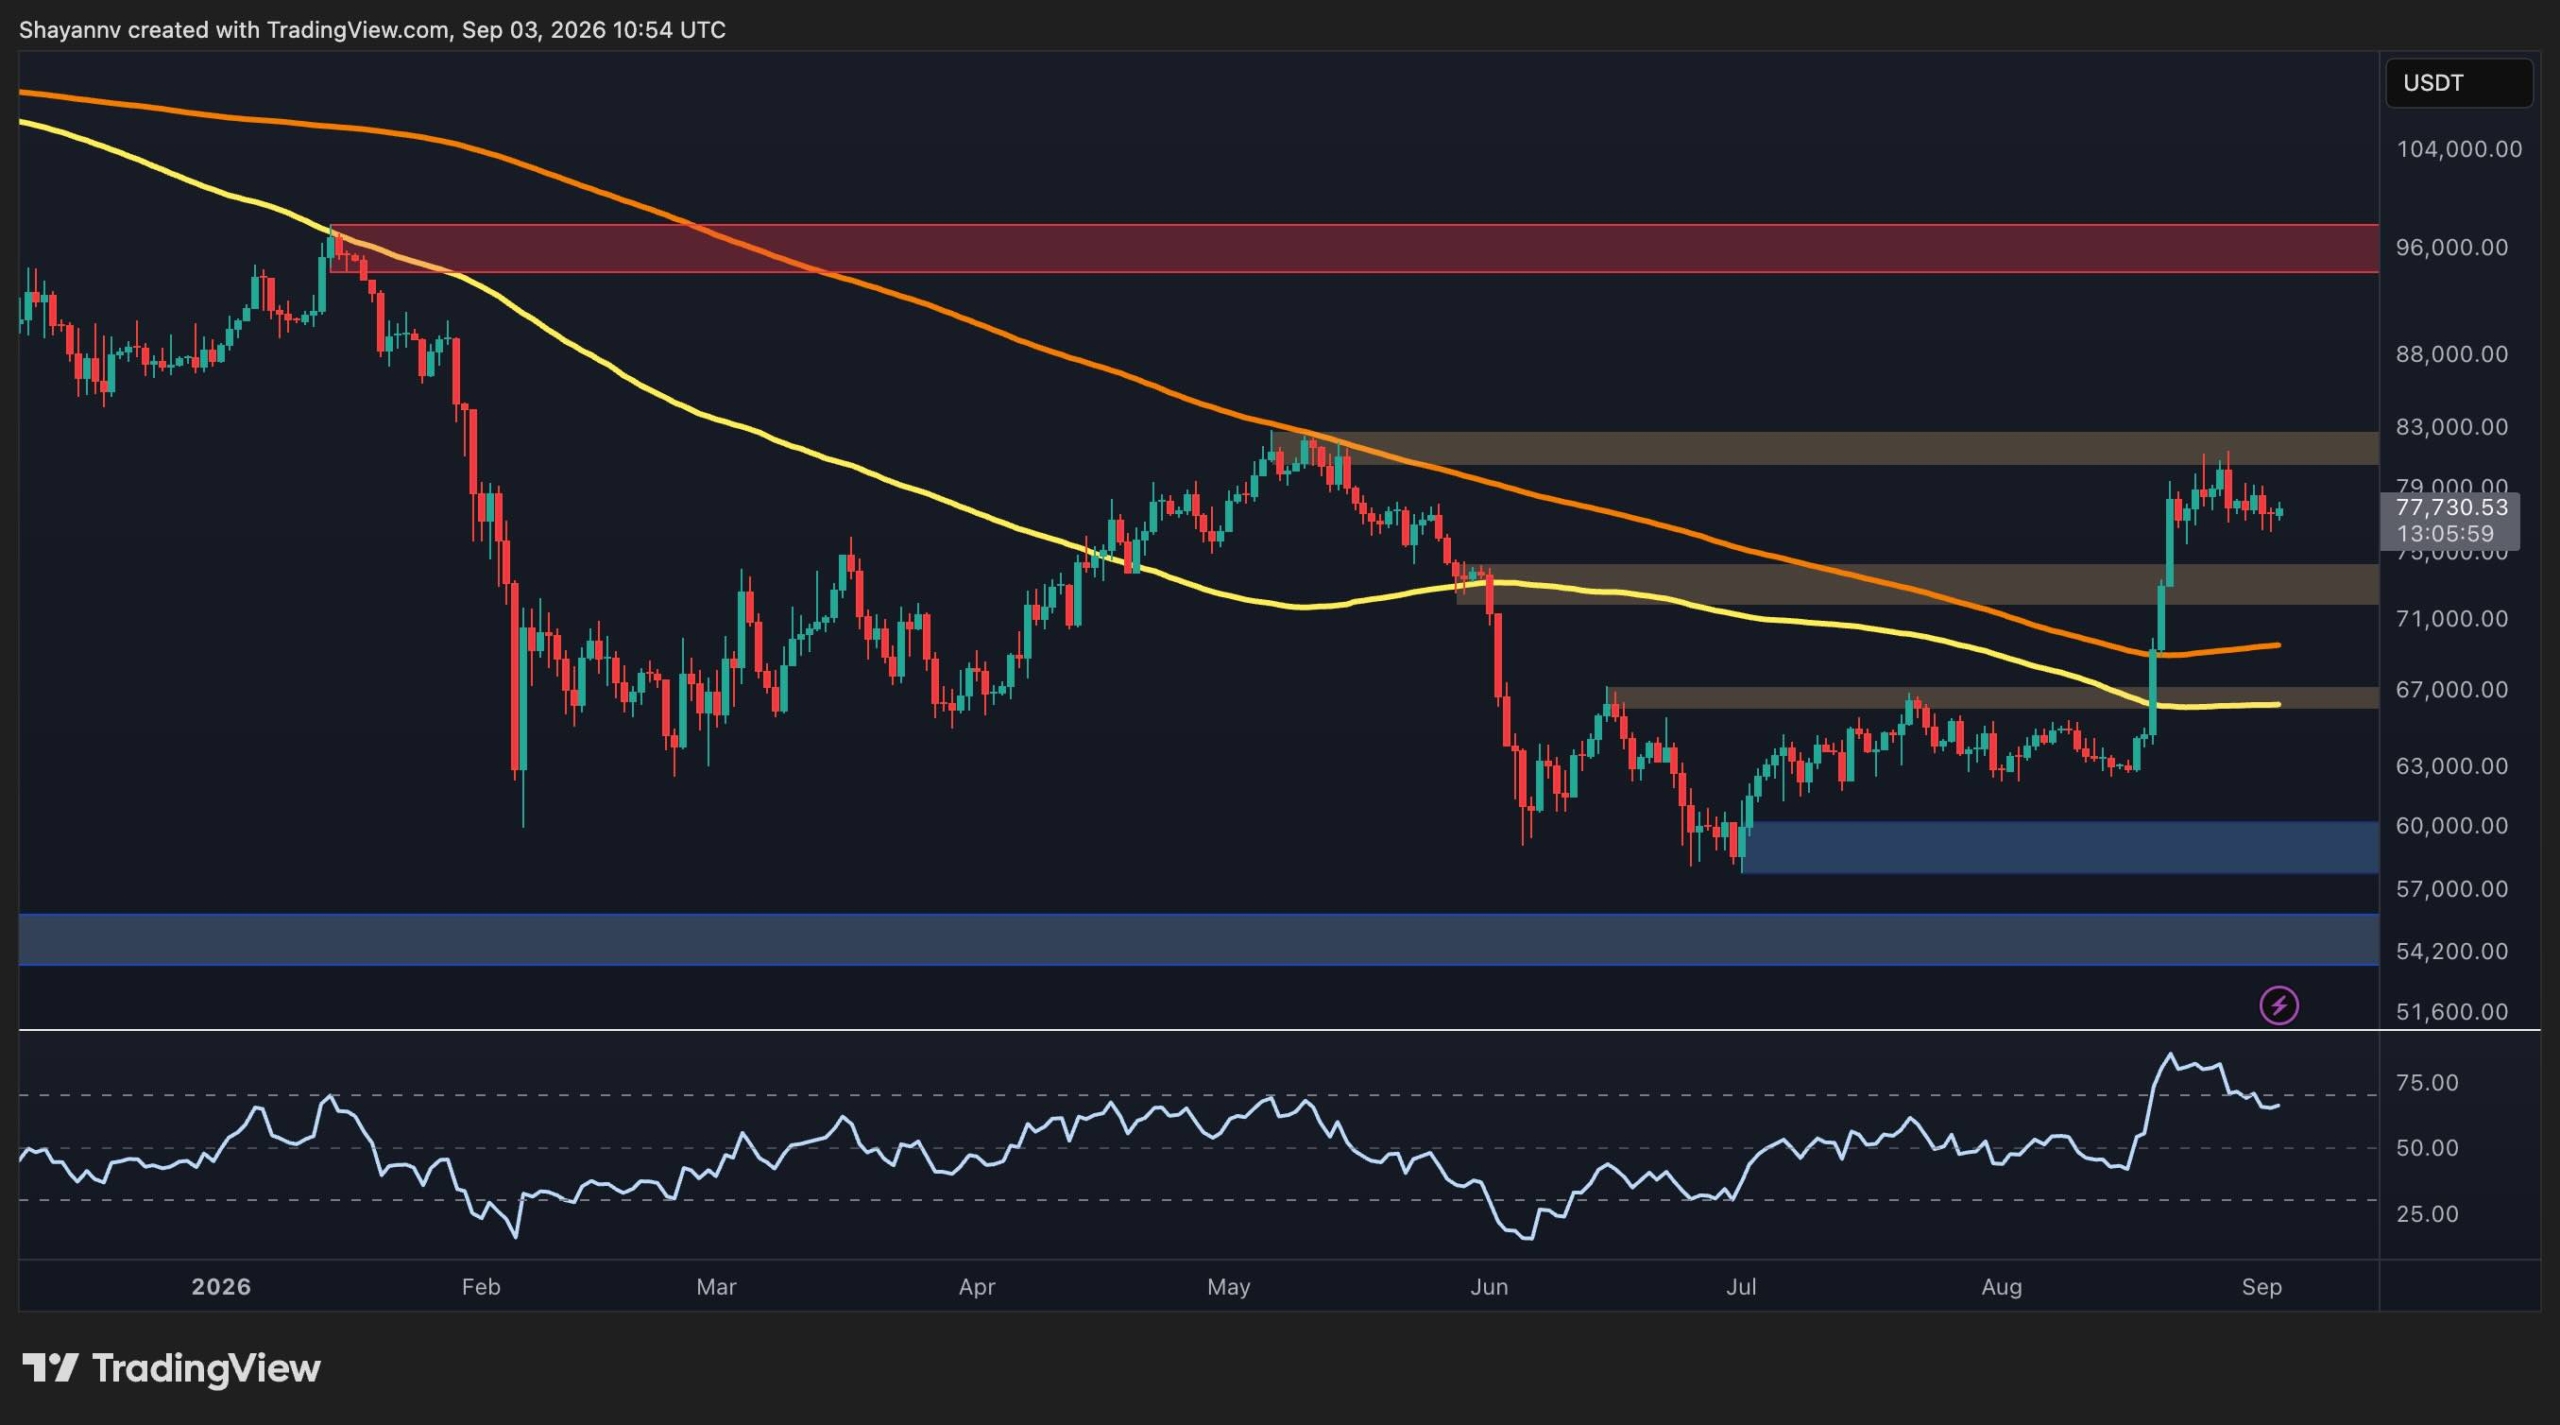
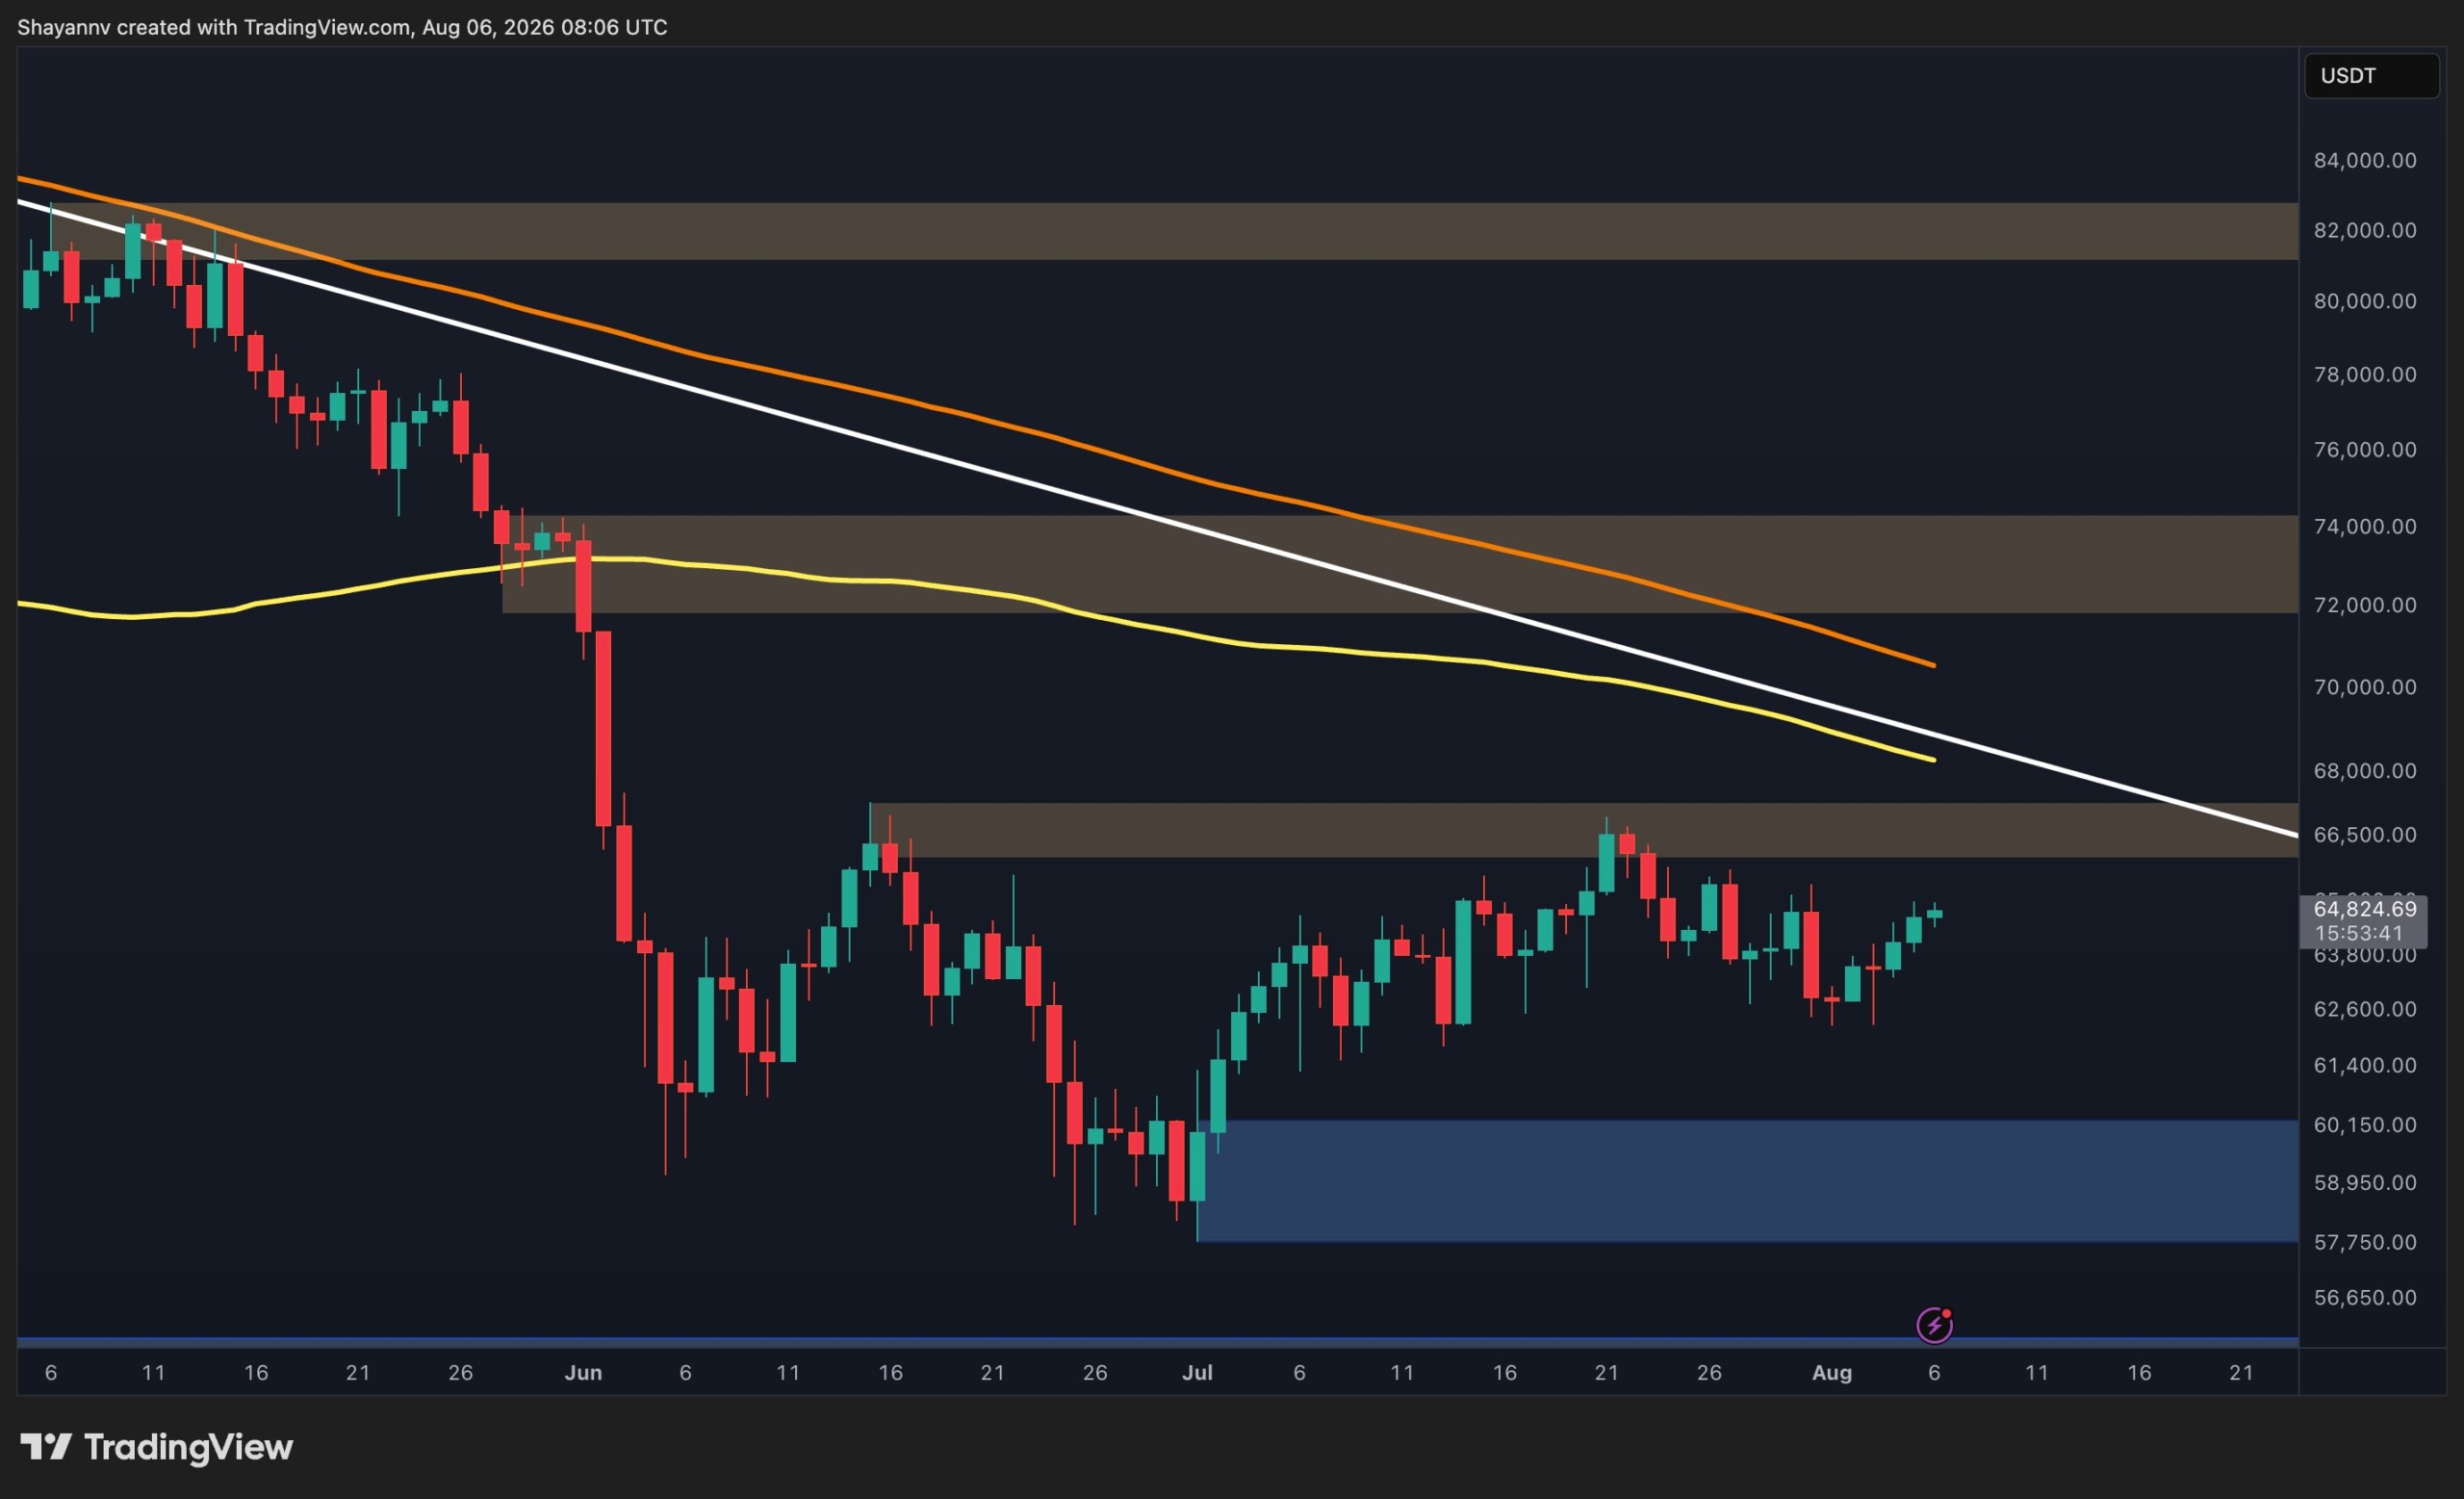
The daily chart shows a significant structural improvement following the recovery from the $60K support zone. BTC broke above the $67K area and subsequently reclaimed the $72K zone, which had previously acted as resistance. The price is now trading around $78.5K, comfortably above both major moving averages shown on the chart.

The short-term challenge is the $82K resistance zone. This area coincides with the recent swing highs, making it an important barrier for the buyers. A daily close above this level would strengthen the recovery structure, as it would create a higher high after months of downtrend. Therefore, this potential breakout could open the way toward the $95.6K resistance region.

Momentum has also improved considerably. The daily RSI climbed from oversold territory during the June bottom and is now just below the overbought territory. However, it has started to turn lower after reaching elevated levels, suggesting that momentum is cooling rather than accelerating.

On the downside, the $72K zone is the first major support to monitor. Holding above it would keep the broader recovery intact, while a deeper correction could bring the $67K region back into focus.

Therefore, the daily structure remains cautiously constructive, but BTC needs to clear $82K to confirm that the recent recovery is evolving into a stronger bullish continuation rather than another rejection from resistance.

BTC/USDT 4-Hour Chart

The 4-hour chart provides a more cautious picture. BTC has been moving inside a falling wedge-like structure since reaching the $82K area in late August. The upper trendline has repeatedly capped advances, while the lower boundary currently sits around $76K.

BTC is now testing the upper boundary of this structure once again. A successful breakout above this resistance line, which is currently near the $78K mark and declining, would be the first indication that buyers are attempting to regain short-term control.

A potential breakout would lead to another push toward the $82K area, which, as mentioned, is currently the most important resistance level on the daily timeframe.

Conversely, failure to break the wedge and a move below $76K could trigger a deeper correction toward the $72K-$74K area, which has turned into support after getting broken to the upside earlier. Holding this zone would be critical for keeping the recovery alive, as a breakdown could undo all the positive price action BTC has shown over the past couple of weeks.

On-Chain Analysis

The exchange whale ratio measures the proportion of exchange inflows associated with the largest transactions, making it useful for assessing whether large holders are becoming more active in sending BTC to exchanges. A rising reading can indicate increased potential selling pressure, although it does not necessarily mean that whales are immediately selling.

The chart shows the 30-day moving average of Bitcoin’s exchange whale ratio rising sharply during the latest price recovery. It has moved back toward the 0.32 area, which is nearly the highest level visible on the chart, while BTC is trading around $78.5K.

This development is worth monitoring. Bitcoin has recovered substantially from its June lows, but the increasing whale ratio suggests that large transactions toward exchanges have also become more prominent, which could unbalance the supply and demand equation in favor of the sellers. If this elevated reading persists while BTC struggles to break above the $80K-$82K area, it could reinforce the case for a rejection or consolidation.

On the other hand, a decisive breakout above $82K accompanied by a subsequent decline in the whale ratio would provide a more constructive confirmation that the increased whale activity is not translating into significant distribution and that there is enough fresh demand to absorb whales’ distribution.

The post BTC Price Analysis: Bitcoin Rebounds From $76K but Crucial Resistance Remains Above $80K appeared first on CryptoPotato.

XRP Price Analysis: Can XRP Resume Its Rally After Defending Key Support?

3 September 2026 at 17:04

XRP is consolidating after its sharp late-August breakout, with the price now hovering close to $1.40. The charts suggest that the broader structure has improved considerably, but the token remains trapped beneath a major resistance zone. A breakout from the current corrective structure could determine whether the recent rally resumes or develops into a deeper retracement.

Ripple Price Analysis: The USDT Pair

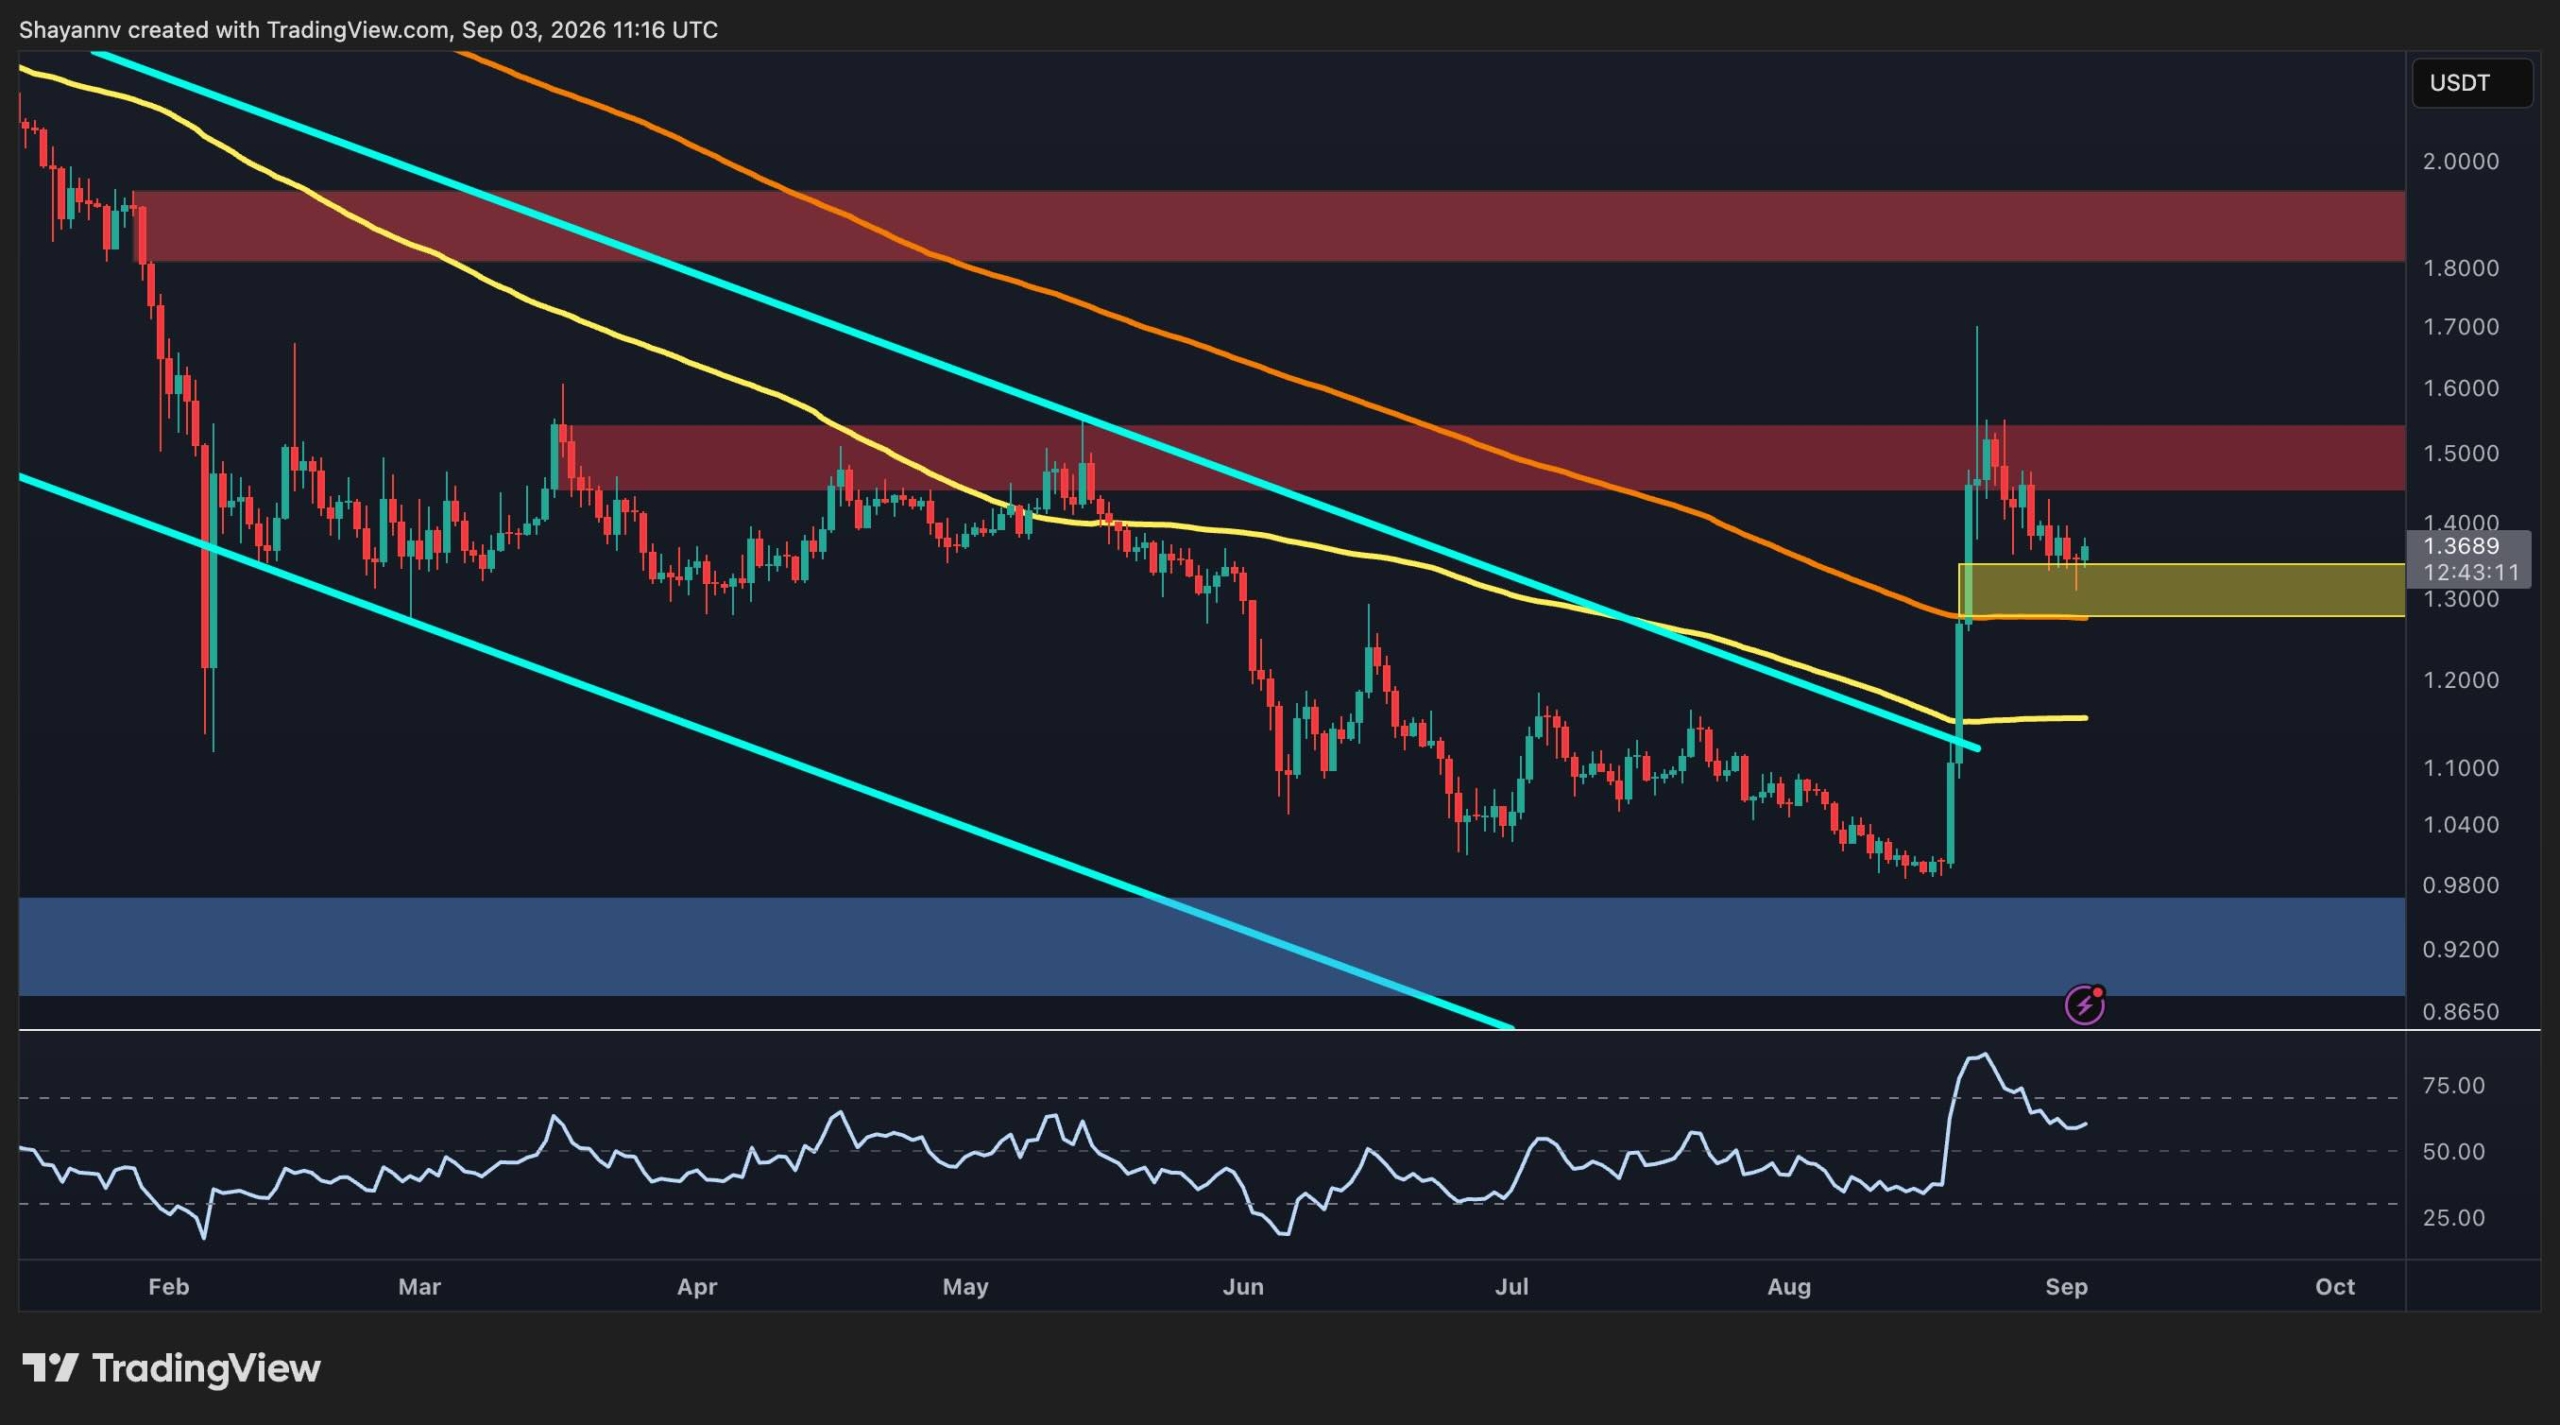
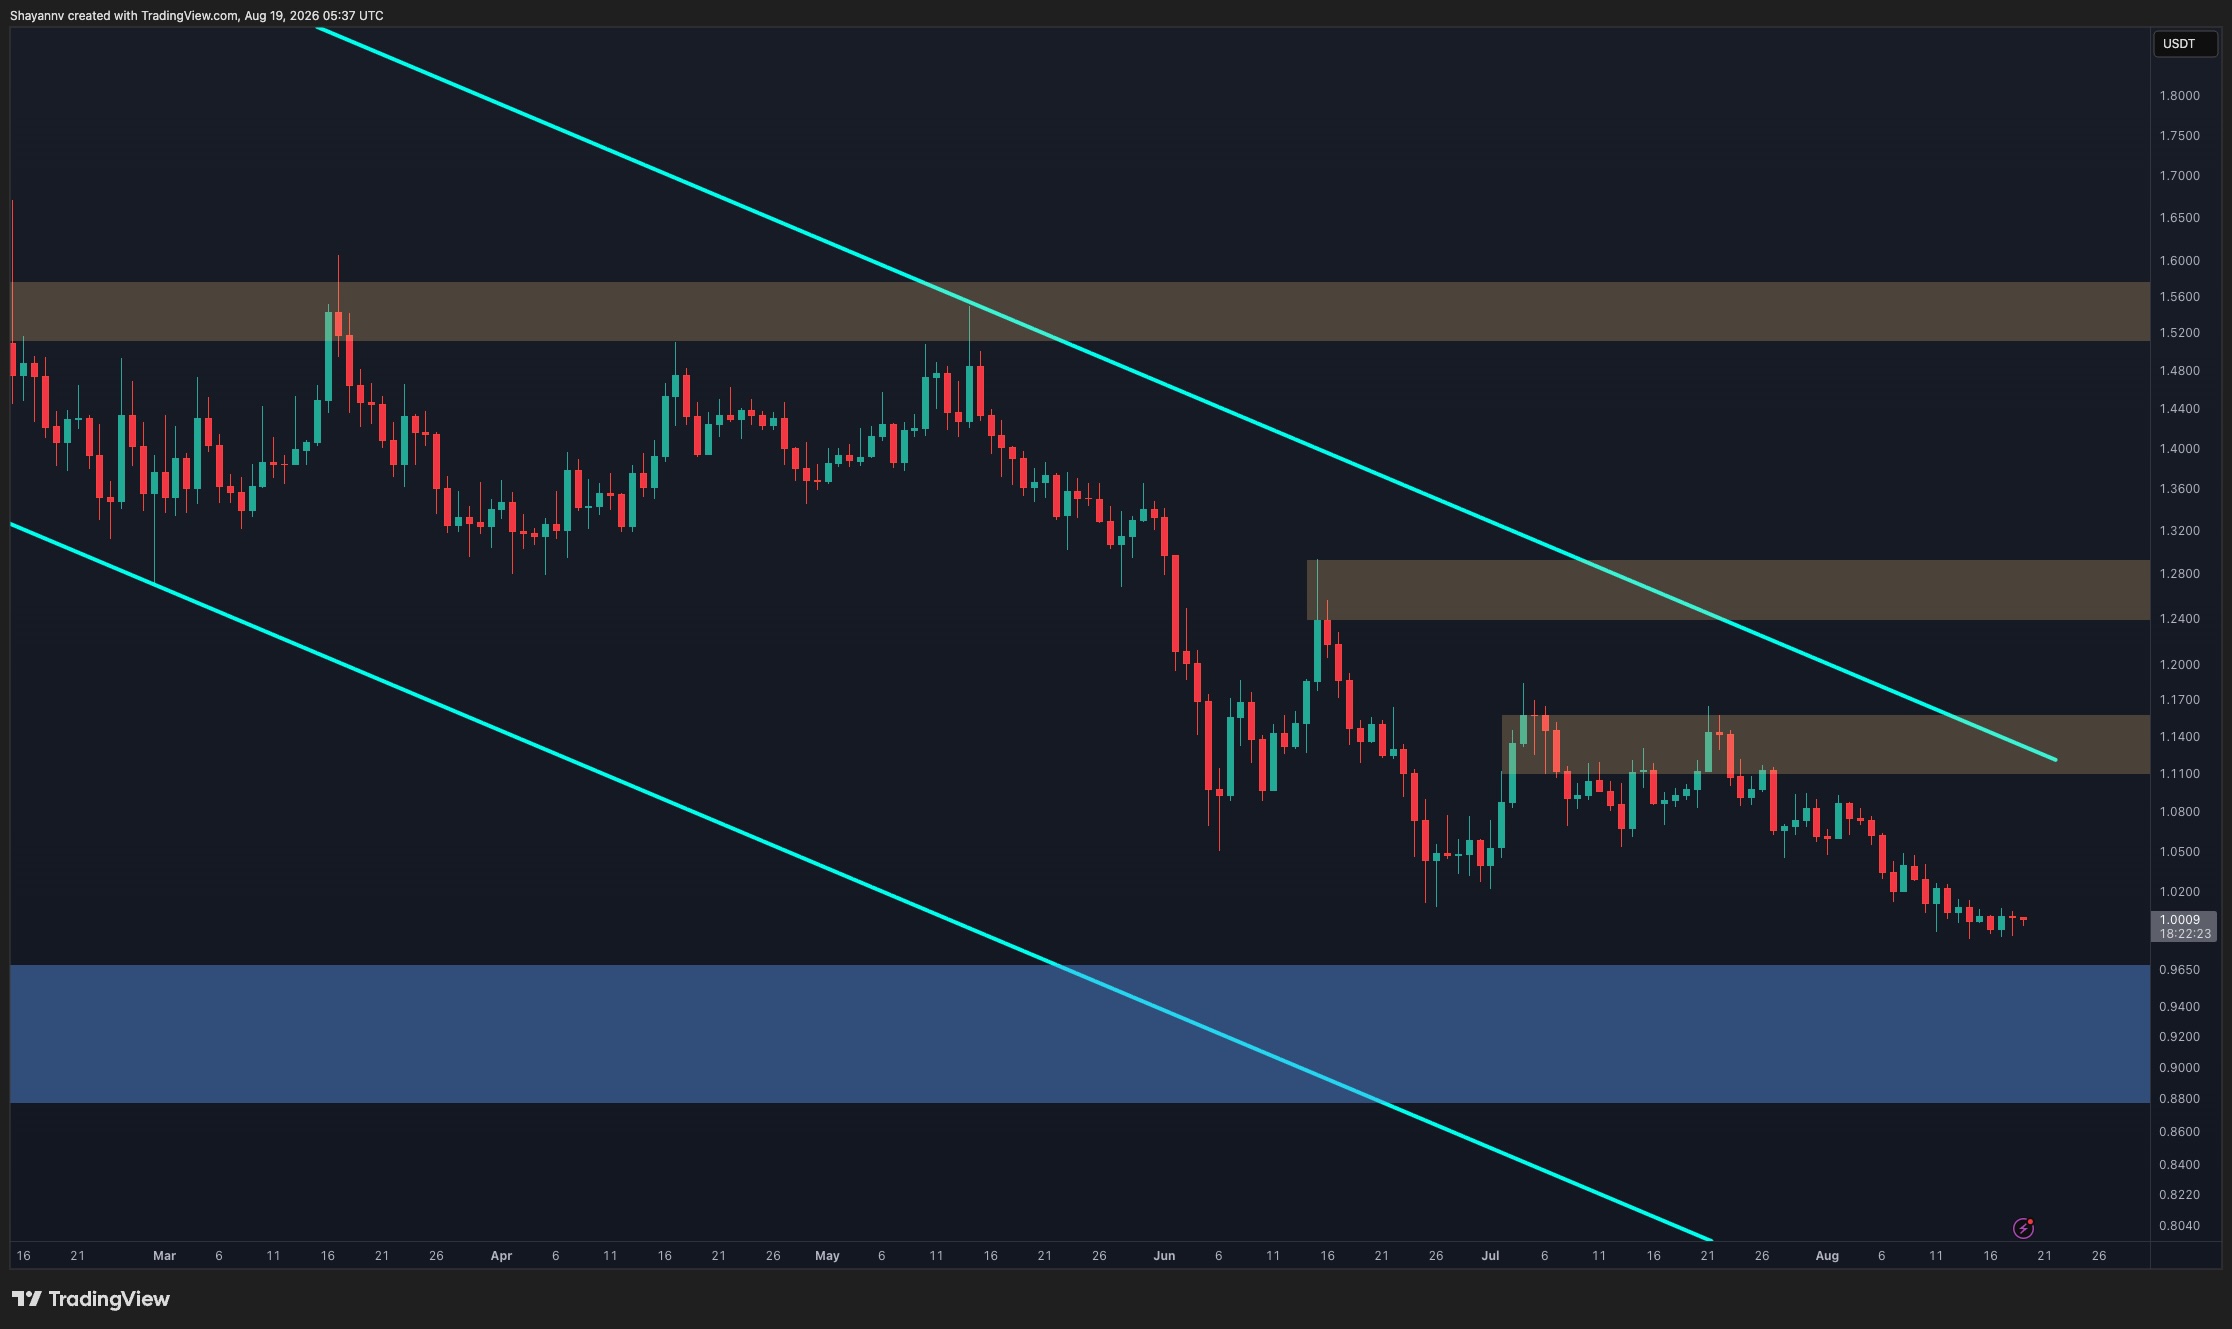
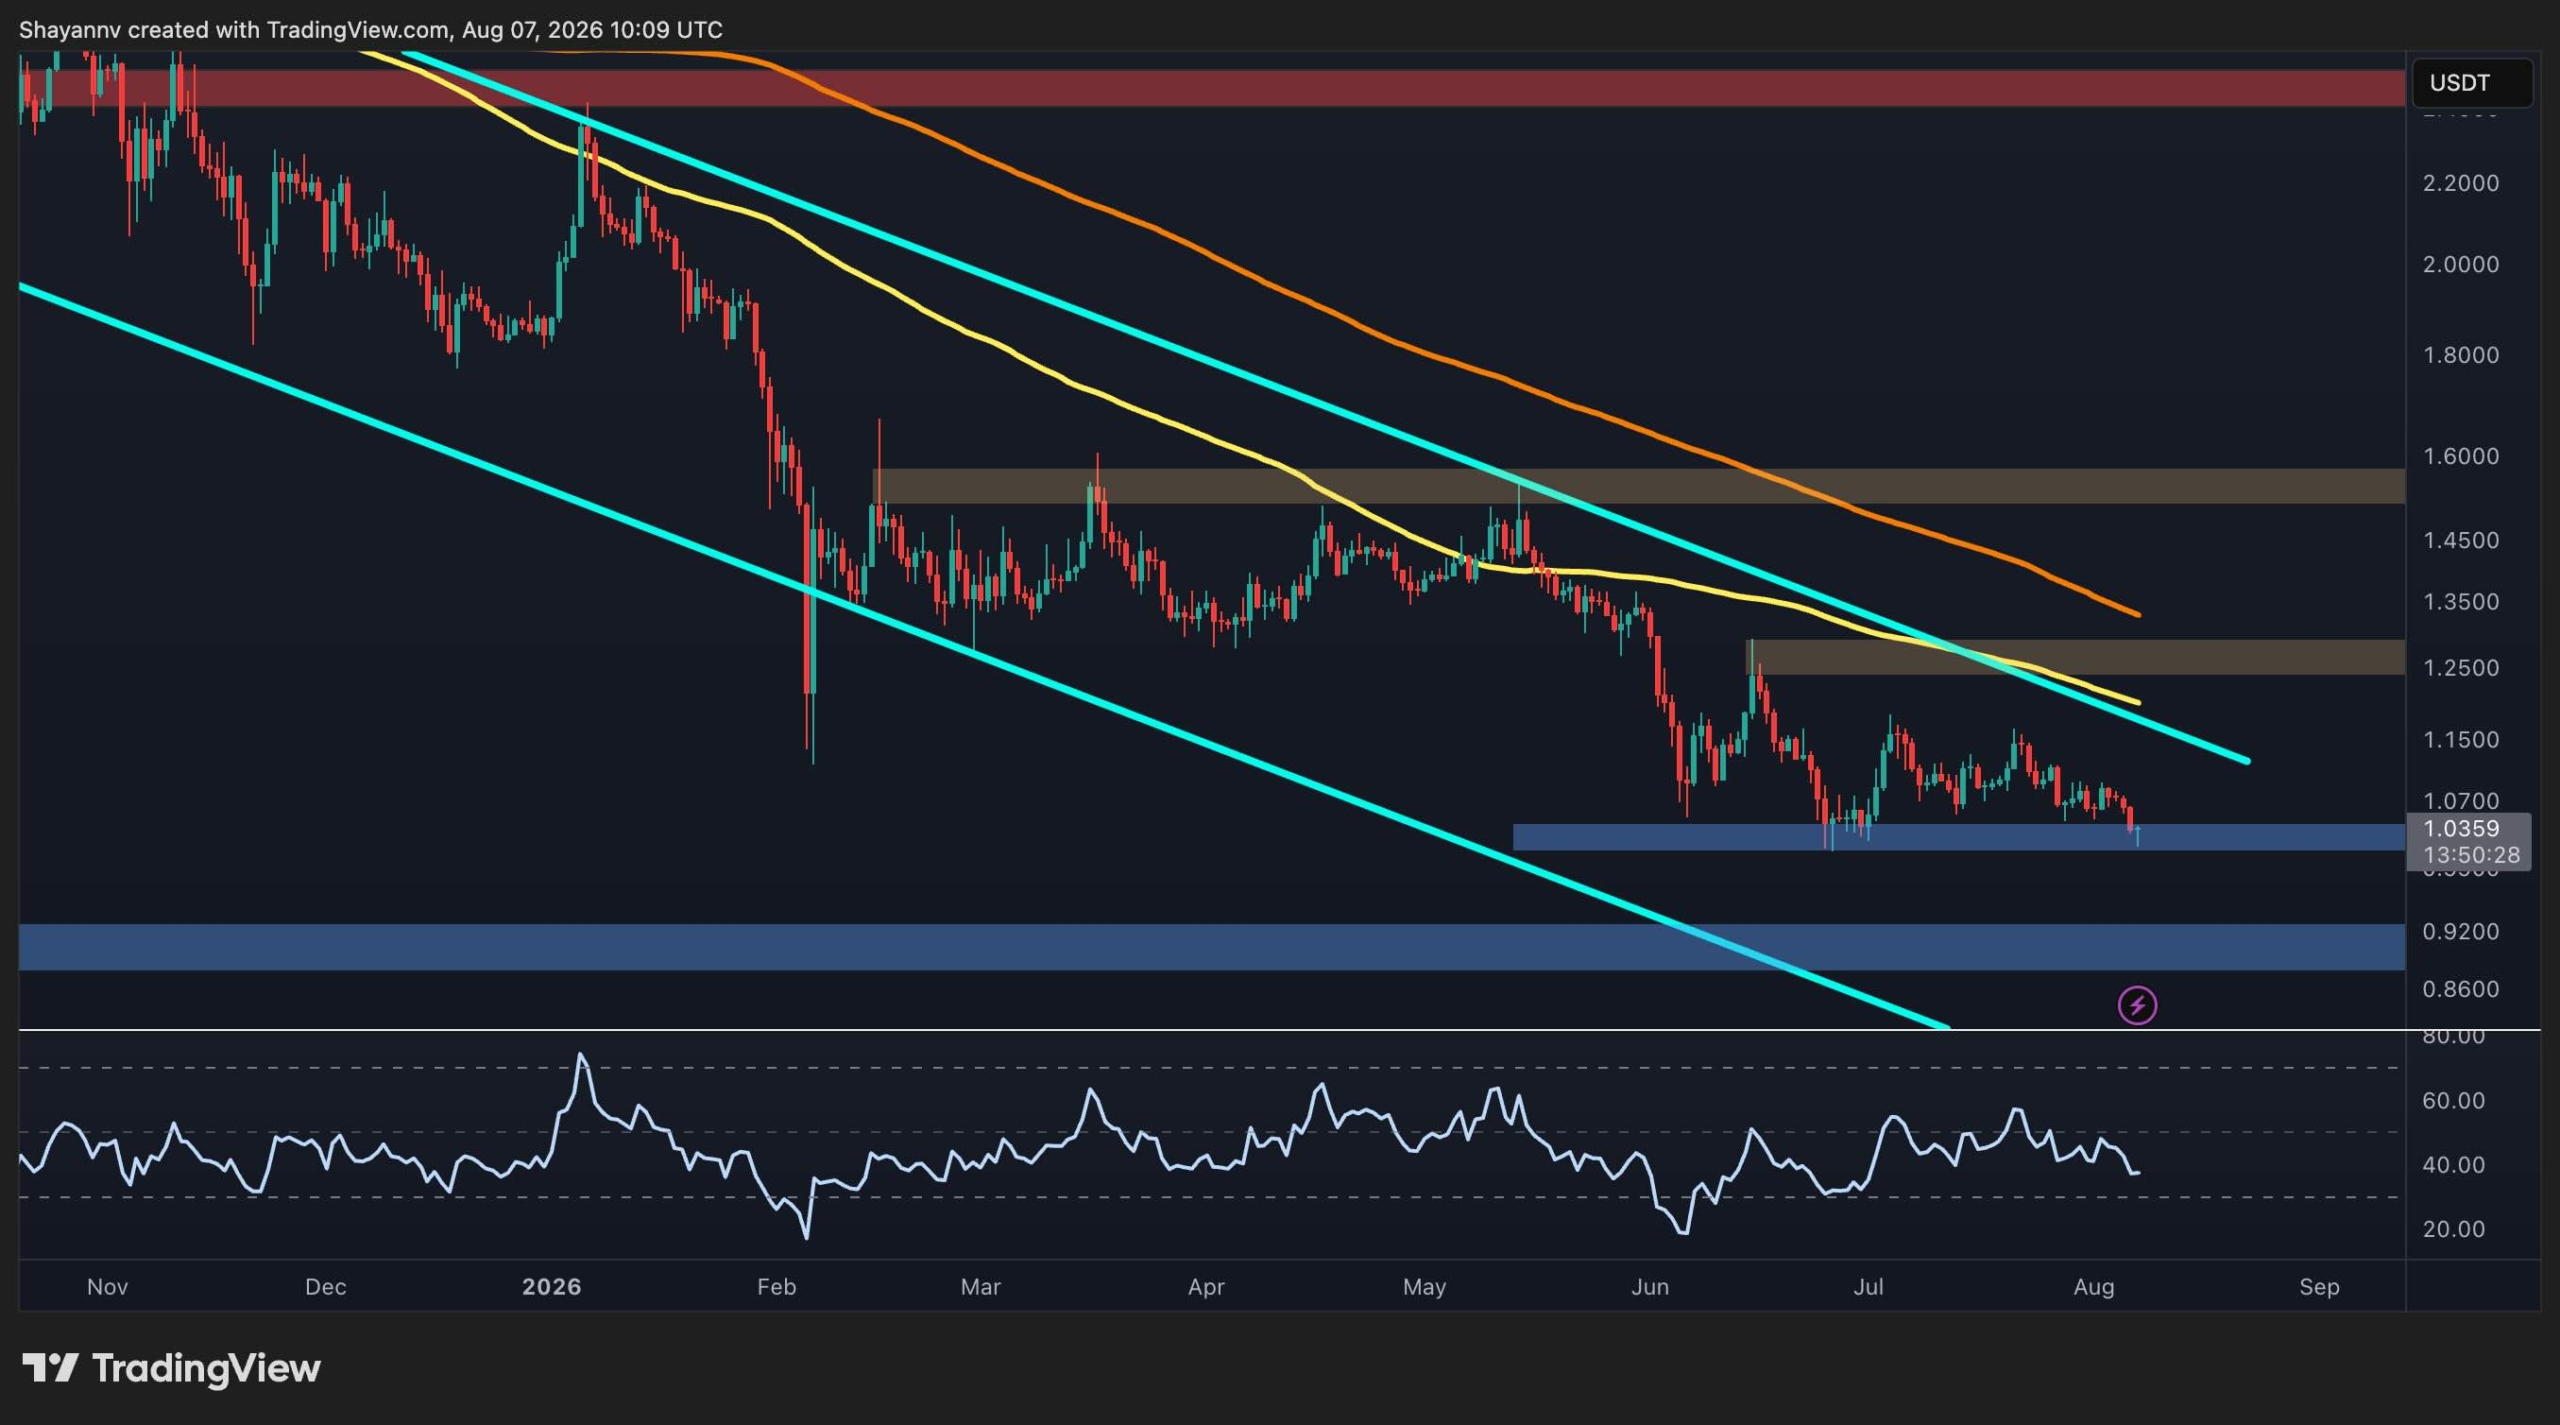
On the daily timeframe, XRP has undergone a significant structural shift. After spending several months in a broad downtrend, the asset broke decisively higher in late August, surging from around $1.00 to a spike near $1.70. This move also pushed XRP above the previously declining long-term trendline and the major moving averages visible on the chart.

The subsequent pullback has brought XRP toward the $1.30 area, which is currently highlighted as an important demand zone at a clear bullish imbalance area. Meanwhile, the still price remains above the 100-day and 200-day moving averages, suggesting that the broader recovery structure is still intact despite the recent correction.

Above the current price, the $1.5 region represents the main resistance zone. It previously acted as a significant supply area and has already rejected XRP several times over the past year. Therefore, a daily close above this zone would significantly strengthen the bullish case and could pave the way toward the $2 region, which is an important psychological barrier for Ripple.

The momentum picture has also cooled substantially from the extreme levels reached during the initial breakout. The daily RSI has fallen below 75, relieving overbought conditions while remaining above the neutral 50 area. This is generally constructive because XRP has been able to consolidate without completely losing its momentum.

The 4-Hour Chart

The 4-hour chart provides a clearer view of the current correction. Since the late-August spike, XRP has been forming a descending structure defined by two downward-sloping trendlines. The price is currently near $1.37 and appears to be testing the upper boundary of this formation.

This makes the current area particularly important. A breakout above the descending resistance line, followed by a move through the $1.5 zone, would provide an initial signal that the corrective phase may be ending.

On the downside, the highlighted $1.25 bullish order block is the immediate support region. As long as XRP continues to hold this zone, the descending structure could eventually resolve to the upside. A breakdown below it, however, would increase the probability of a deeper retracement toward the lower order block around $1.1.

Overall, XRP is approaching a decision point. Holding $1.25 and breaking above the descending trendline would favor continuation above $1.5. Conversely, losing the $1.25 area would invalidate the immediate bullish setup and could send the price back toward the base of the recent rally.

The post XRP Price Analysis: Can XRP Resume Its Rally After Defending Key Support? appeared first on CryptoPotato.

Ethereum Price Prediction: Will ETH Drop to $2K Next if Buyers Fail to Regain Control Soon?

2 September 2026 at 16:09

Ethereum’s post-breakout consolidation is beginning to tilt toward a corrective phase, with the price slipping below the lower end of its recent range. While the broader recovery remains intact, weakening short-term structure suggests ETH could seek liquidity at lower levels before buyers attempt another sustained advance.

Ethereum Price Analysis: The Daily Chart

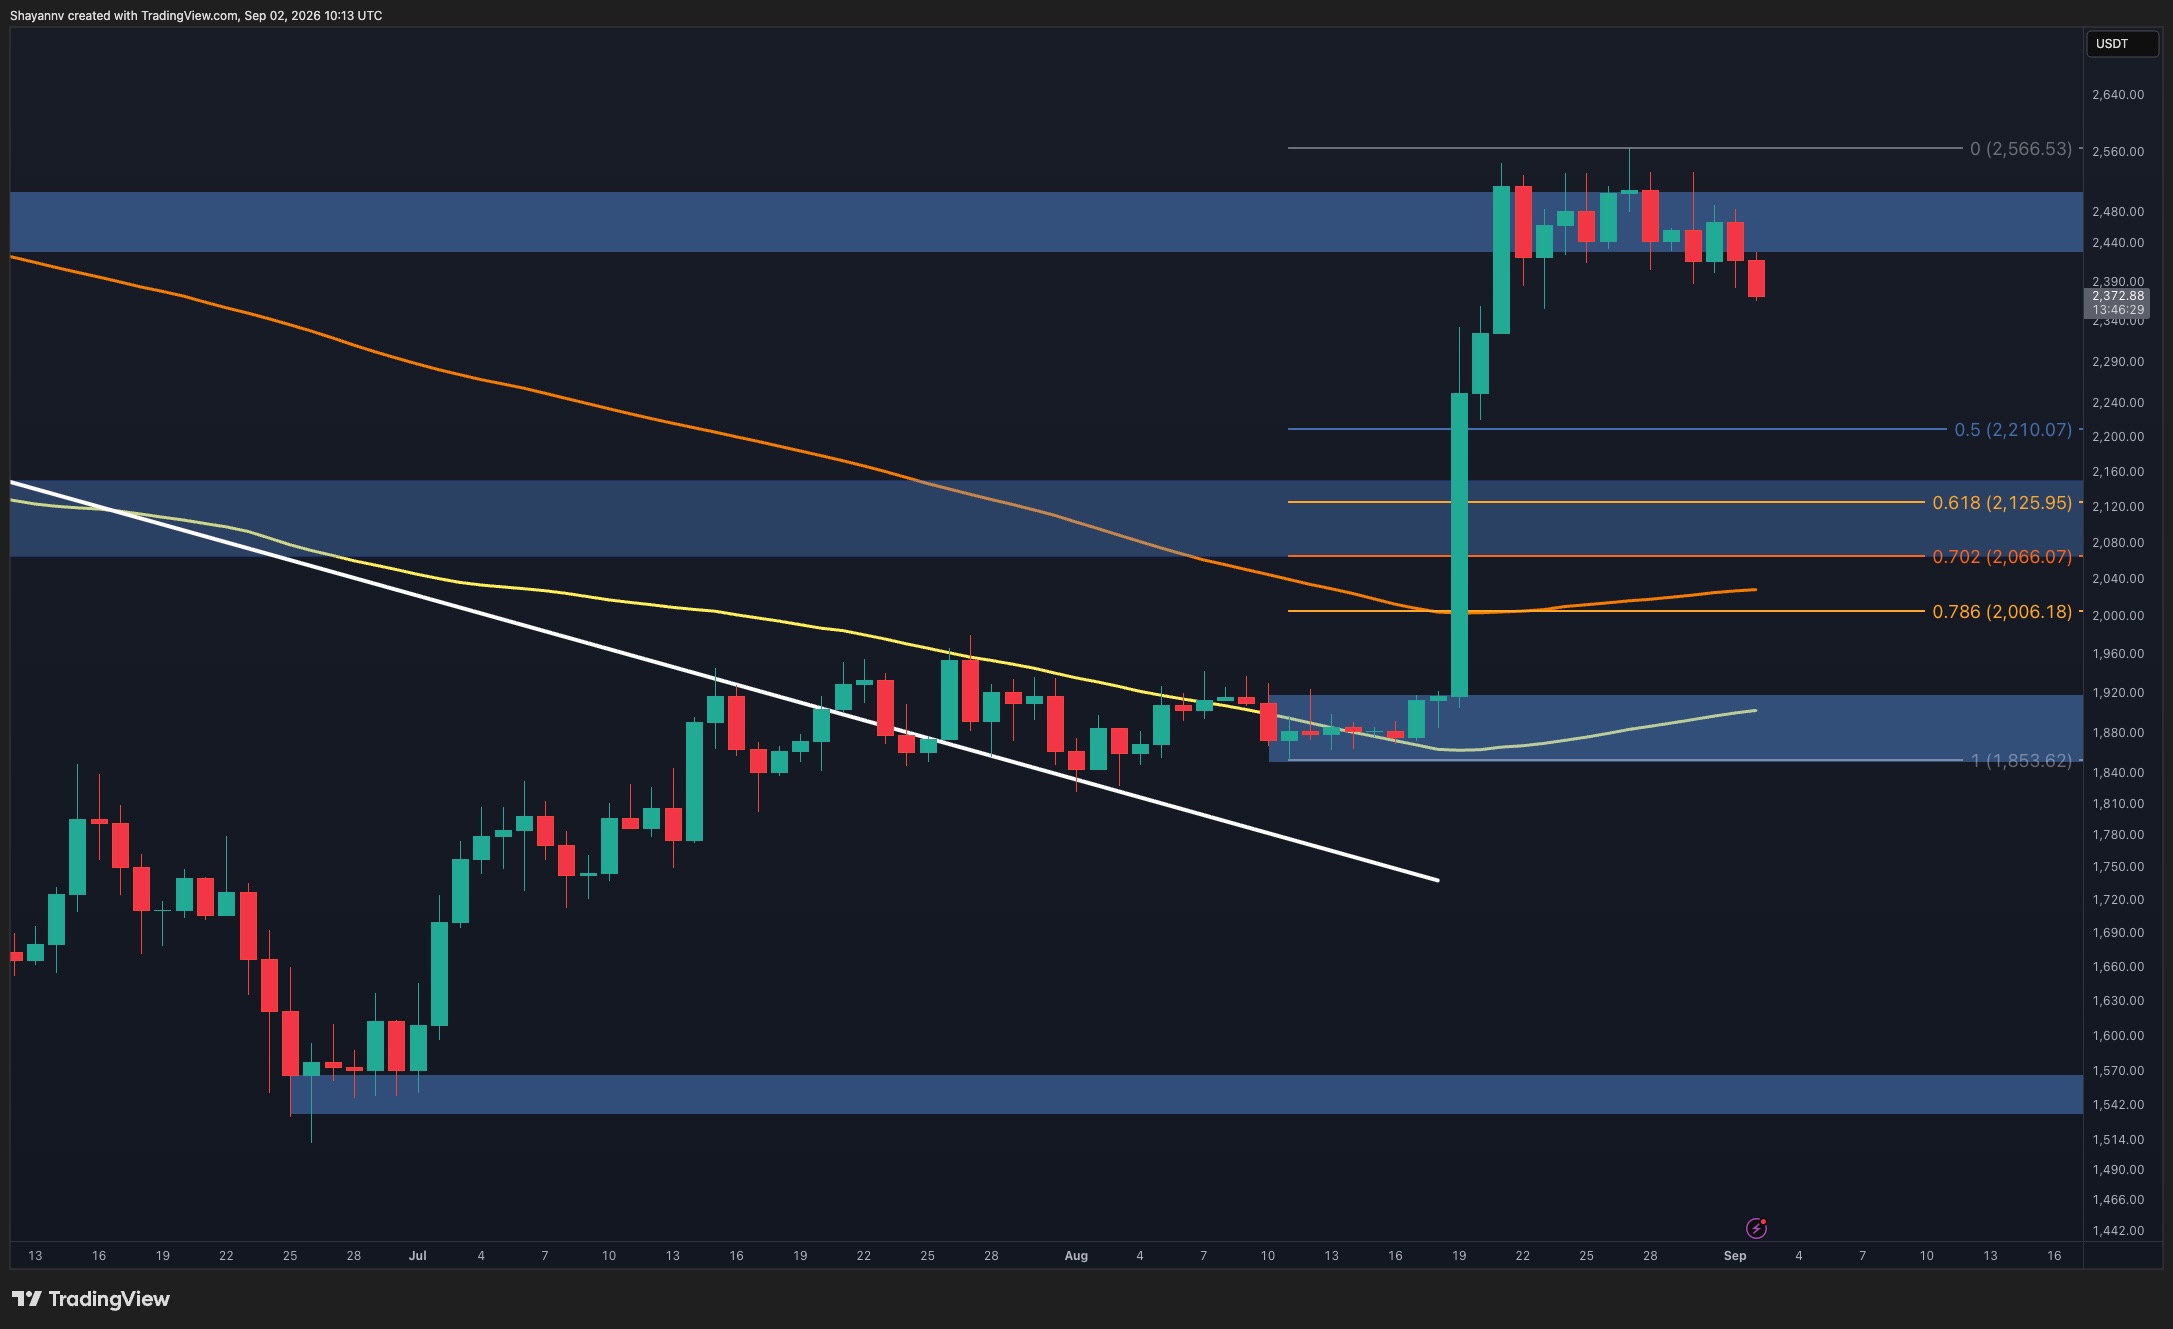
Ethereum’s daily chart shows the market cooling considerably after the explosive rally from the $1.85K-$1.92K base. The move carried ETH directly into the major $2.44K-$2.51K resistance zone, but buyers have repeatedly failed to establish acceptance above this area.

The latest candles are now showing a gradual shift in favor of sellers. ETH has fallen below the lower boundary of the $2.44K-$2.51K resistance zone and is trading near $2.37K. This follows several unsuccessful attempts to continue toward the $2.57K local high, suggesting that the initial bullish momentum has been exhausted for the time being.

If the correction develops further, the Fibonacci retracement levels provide a useful roadmap. The 0.5 level sits around $2.21K, while the 0.618 retracement near $2.13K overlaps closely with the broader $2.07K-$2.16K support zone. This confluence makes the $2.07K-$2.21K region an important potential demand area during a deeper pullback.

Nevertheless, the broader bullish structure would not necessarily be invalidated by such a correction. A recovery back above the $2.44K-$2.51K resistance zone would instead reduce the immediate bearish pressure and put the $2.57K high back in focus.

ETH/USDT 4-Hour Chart

The 4-hour timeframe presents a clearer deterioration in short-term market structure. After spending several sessions oscillating inside the $2.43K-$2.51K range, ETH has broken beneath its lower boundary and is now approaching $2.37K.

More importantly, recent rebounds have become progressively less effective at sustaining upside momentum. The latest rejection from the $2.48K-$2.50K area was followed by another sharp move lower, indicating that sellers are gaining control as the previous consolidation resolves to the downside.

The first major technical pullback zone is located around $2.21K-$2.31K. Considering the vertical nature of the original rally, relatively little price structure was established between the current market and this area, making a deeper retracement toward it increasingly plausible if selling pressure continues.

The next significant support sits around $2.07K-$2.12K. However, a recovery above the $2.43K-$2.51K zone would weaken the corrective scenario and indicate that the latest breakdown lacked sufficient follow-through.

Sentiment Analysis

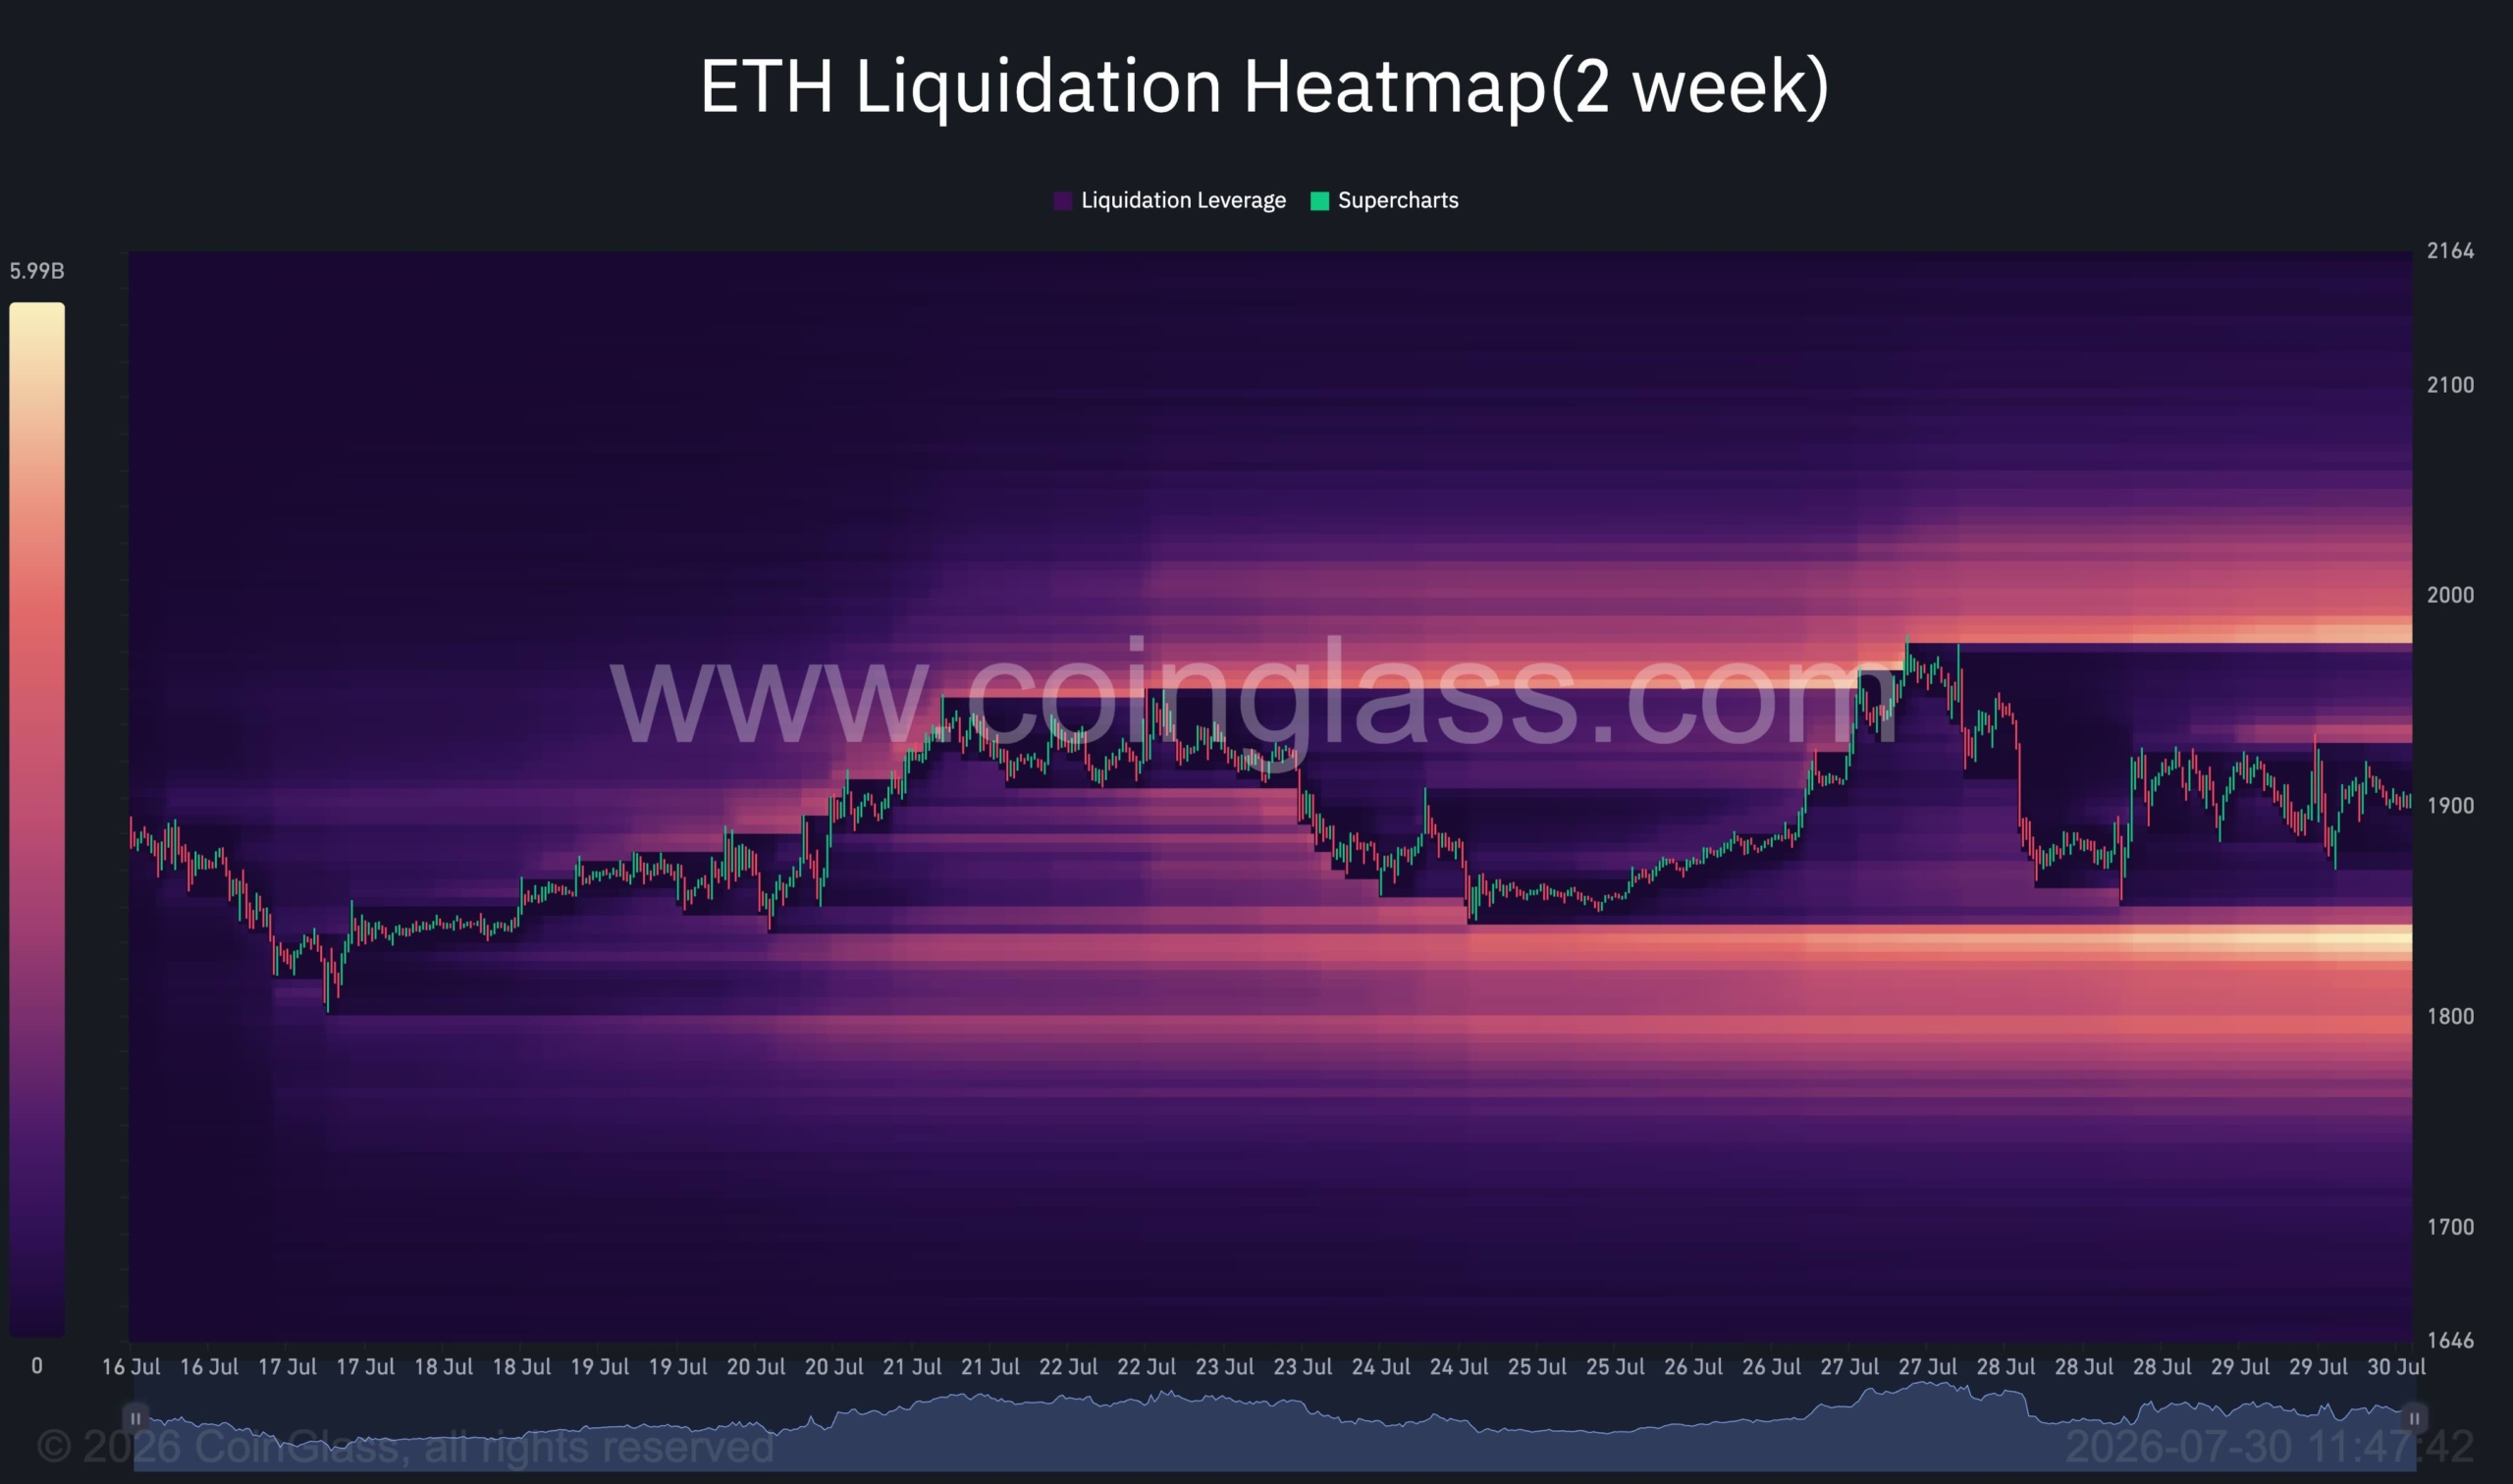
The two-week ETH liquidation heatmap reinforces the possibility of a near-term move lower. With ETH trading around the upper-$2.3K region, a substantial concentration of liquidation liquidity is visible immediately beneath the market, roughly around $2.32K-$2.36K.

This downside liquidity represents the most relevant near-term target on the heatmap. If the current decline continues, the market could be drawn toward this cluster as leveraged positions are cleared and liquidity is collected.

Therefore, the liquidation data aligns with the weakening technical structure. A sweep of the liquidity below the current price could serve as the first objective of the developing pullback before the market determines whether a larger correction toward the major technical support zones is necessary.

The post Ethereum Price Prediction: Will ETH Drop to $2K Next if Buyers Fail to Regain Control Soon? appeared first on CryptoPotato.

Bitcoin Price Analysis: Warning Signs Emerge as BTC’s Breakout Loses Momentum

2 September 2026 at 08:55

Bitcoin continues to hover below $78K, but the absence of meaningful upside progress is becoming increasingly important. After the initial breakout impulse, repeated failures to challenge the $80K-$82K supply area suggest demand is losing strength, raising the probability of a deeper corrective move.

Bitcoin Price Analysis: The Daily Chart

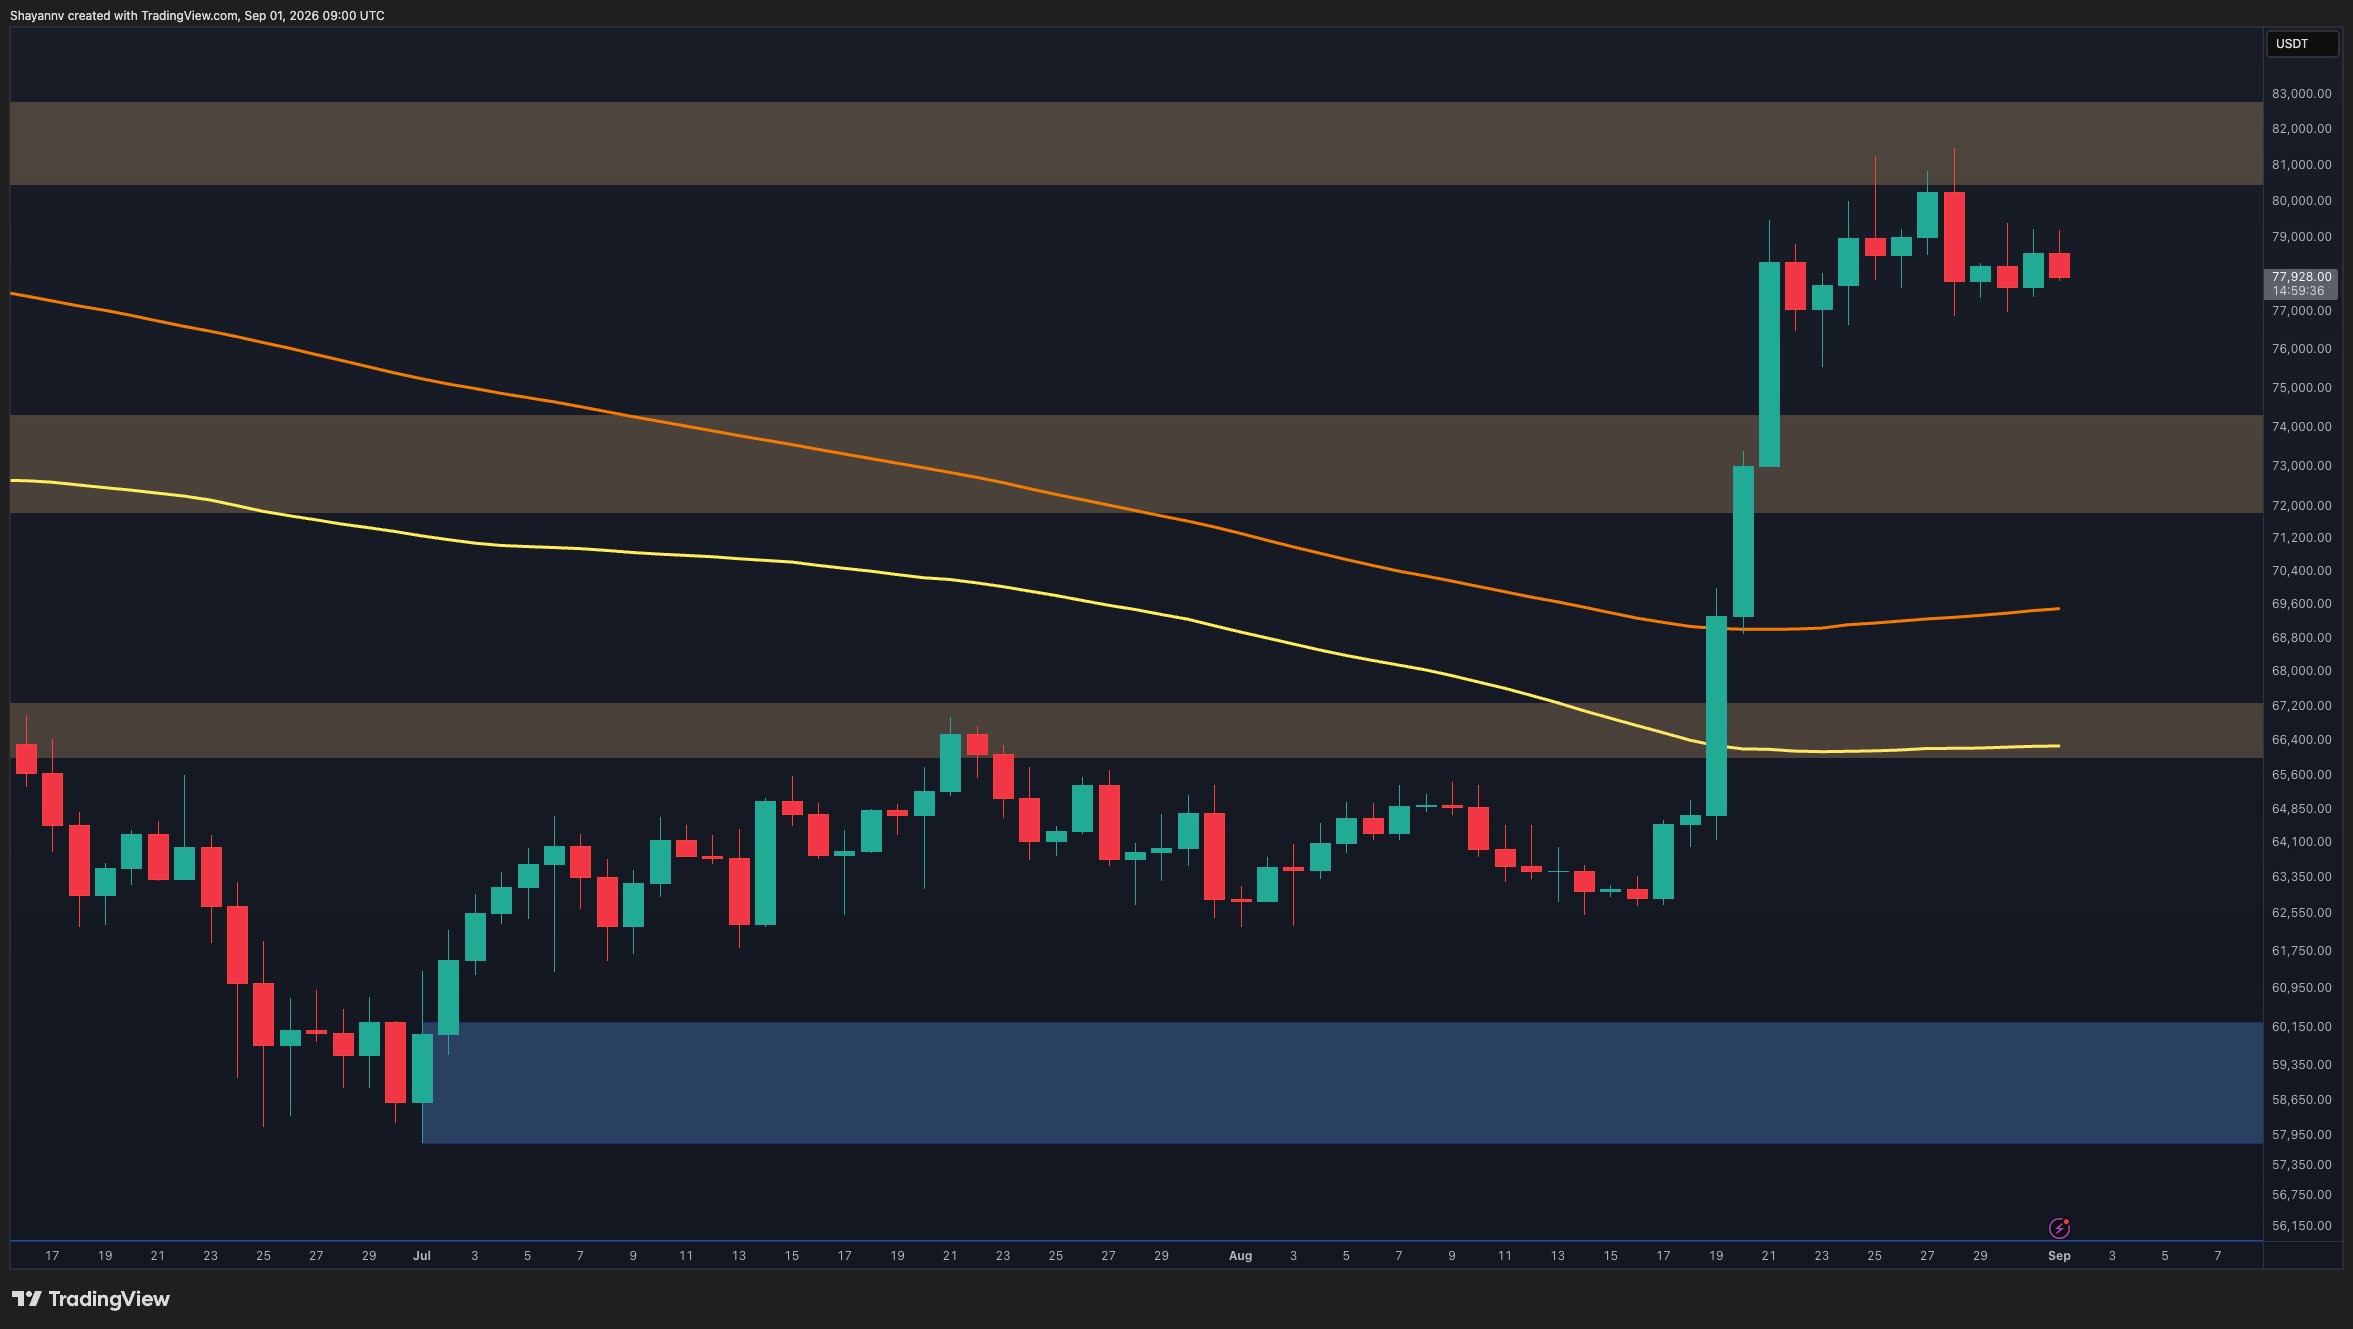
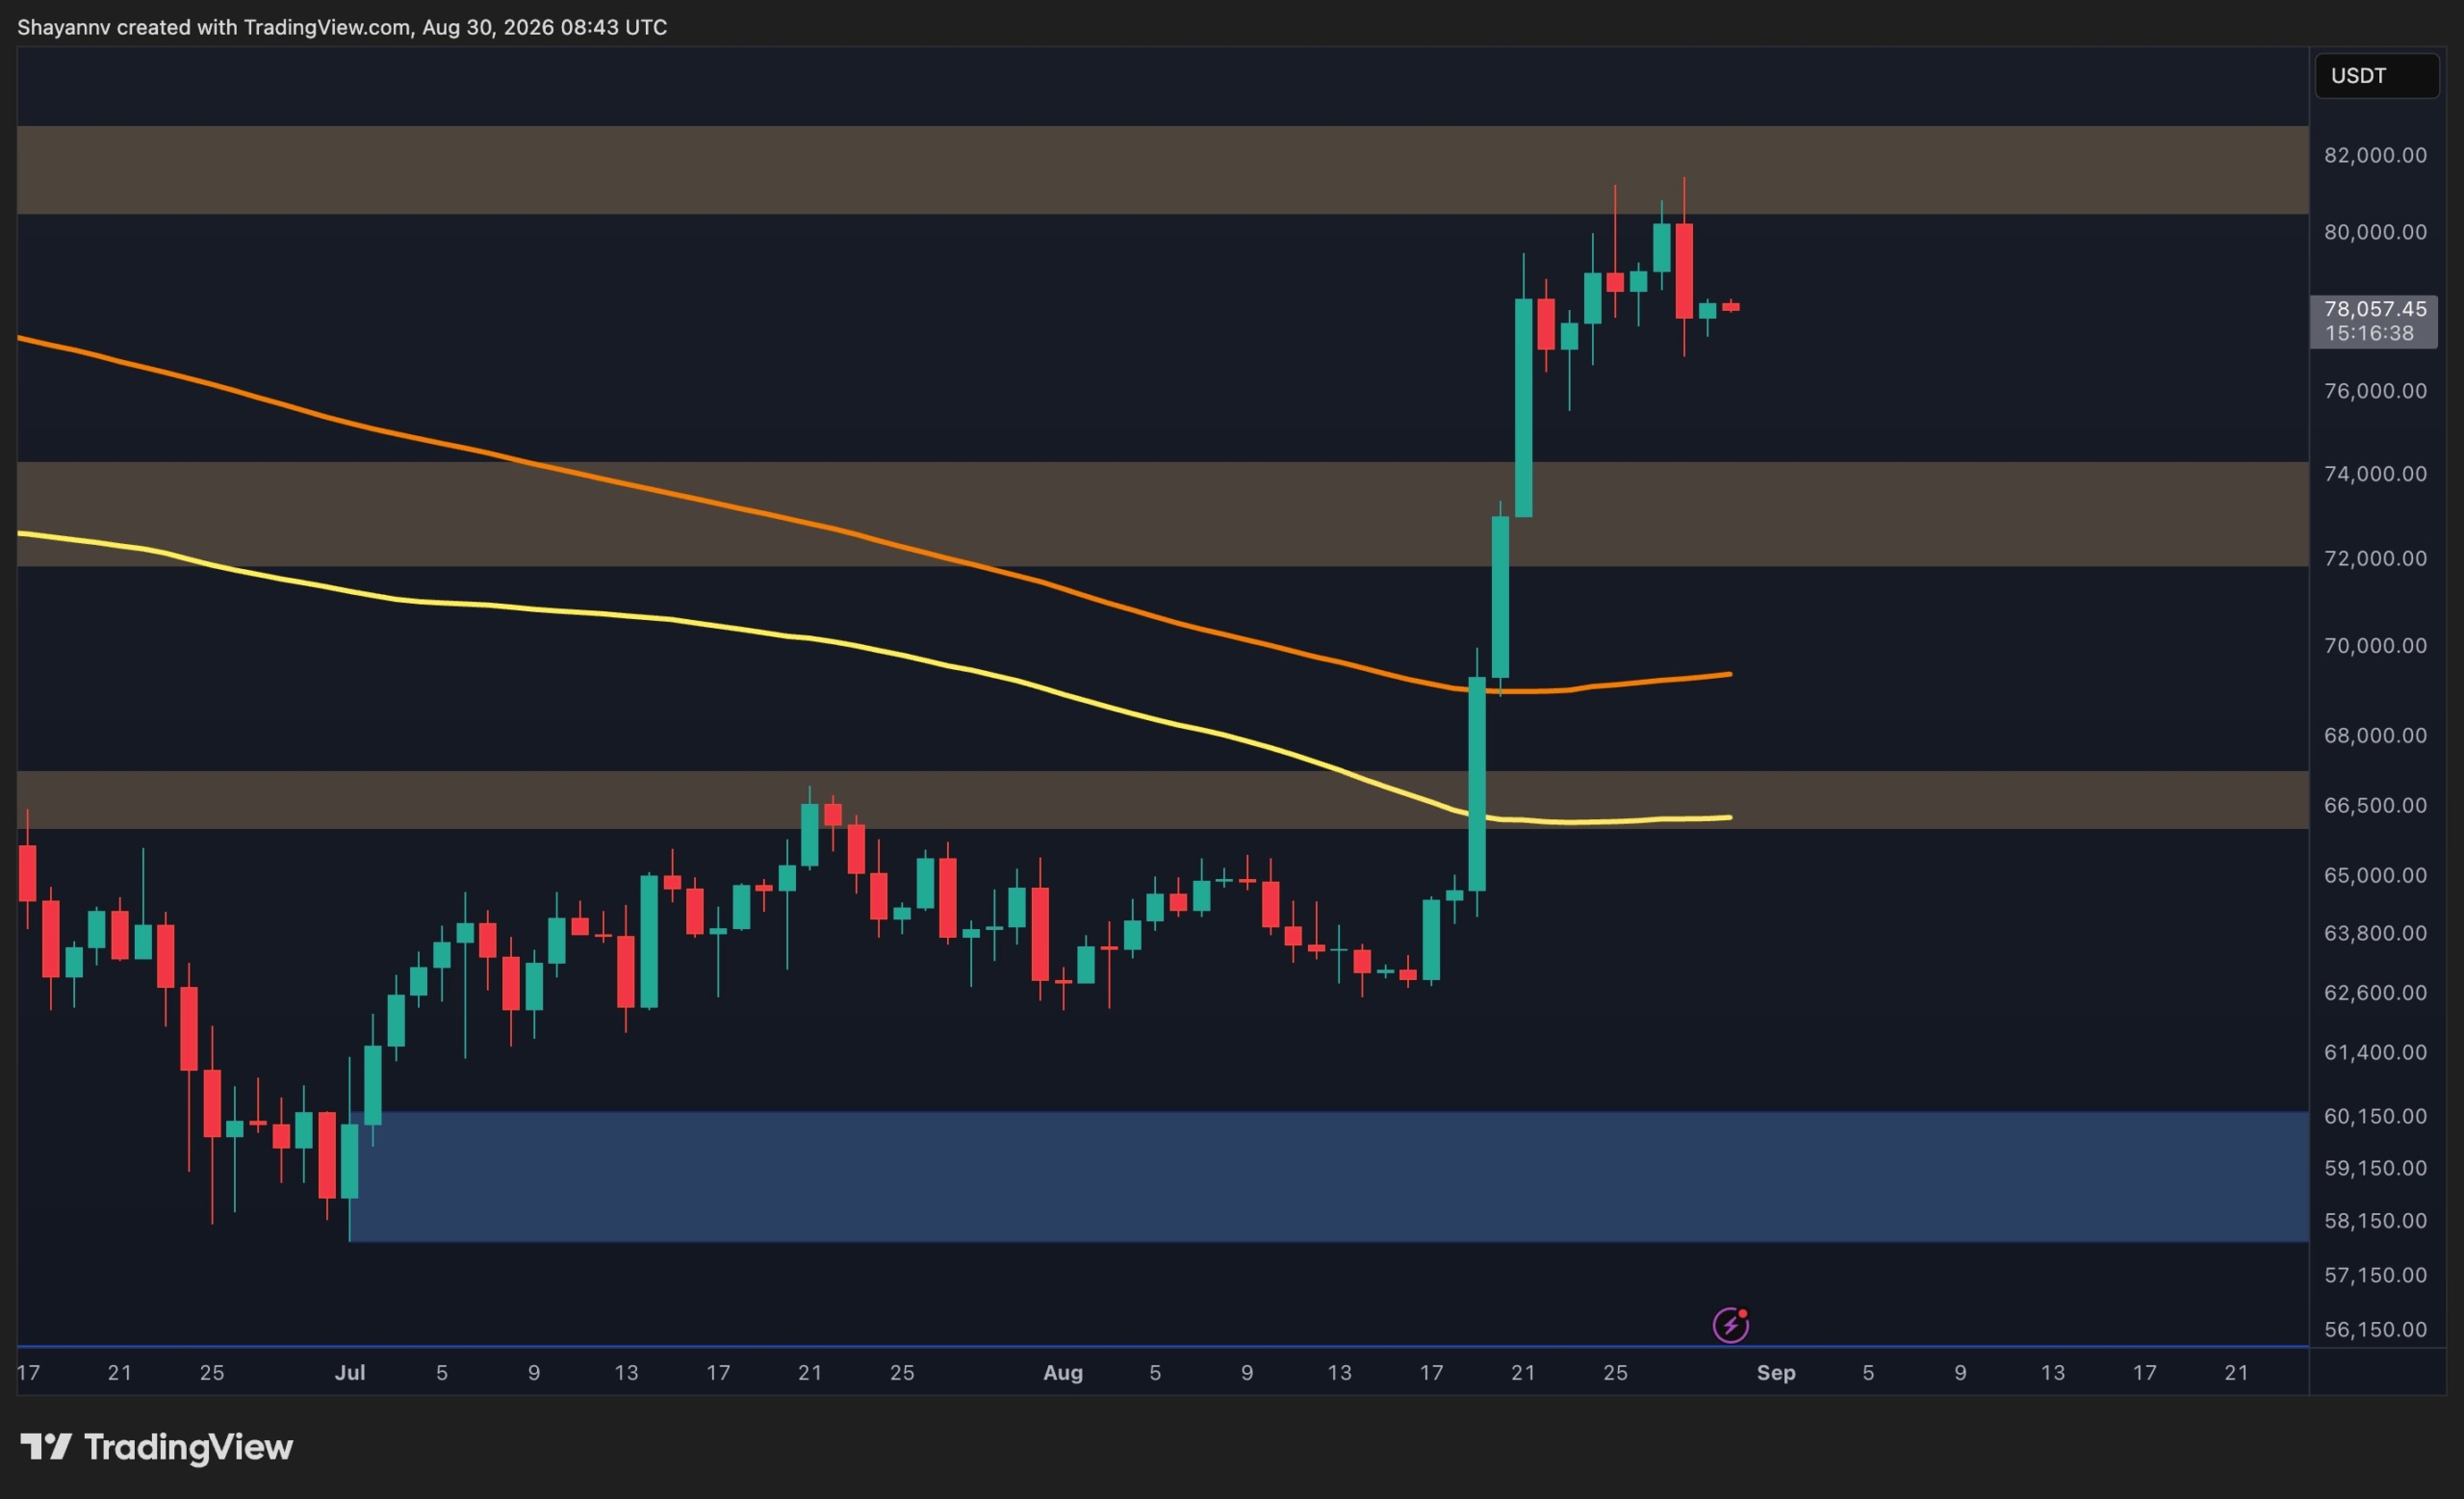
The daily chart shows BTC transitioning from an impulsive breakout into a clear loss of momentum. Following the rapid advance from the mid-$60K region, Bitcoin has spent several sessions fluctuating between roughly $77K and $81K without establishing a fresh high.

This behavior is particularly notable because the price is consolidating directly beneath the major $80.5K-$82.5K resistance zone. The inability to absorb supply around this area, combined with repeated upper wicks, suggests buyers are struggling to maintain the strength seen during the initial rally.

Although the broader structure remains bullish following the breakout above the moving averages and previous resistance levels, the probability of a deeper pullback has increased. The $72K-$74.4K zone is the first major daily support area and represents a logical destination if selling pressure expands.

For the immediate bearish risk to diminish, BTC would need to regain momentum and establish acceptance above $80.5K-$82.5K. Until then, the prolonged hesitation beneath resistance favors caution.

BTC/USDT 4-Hour Chart

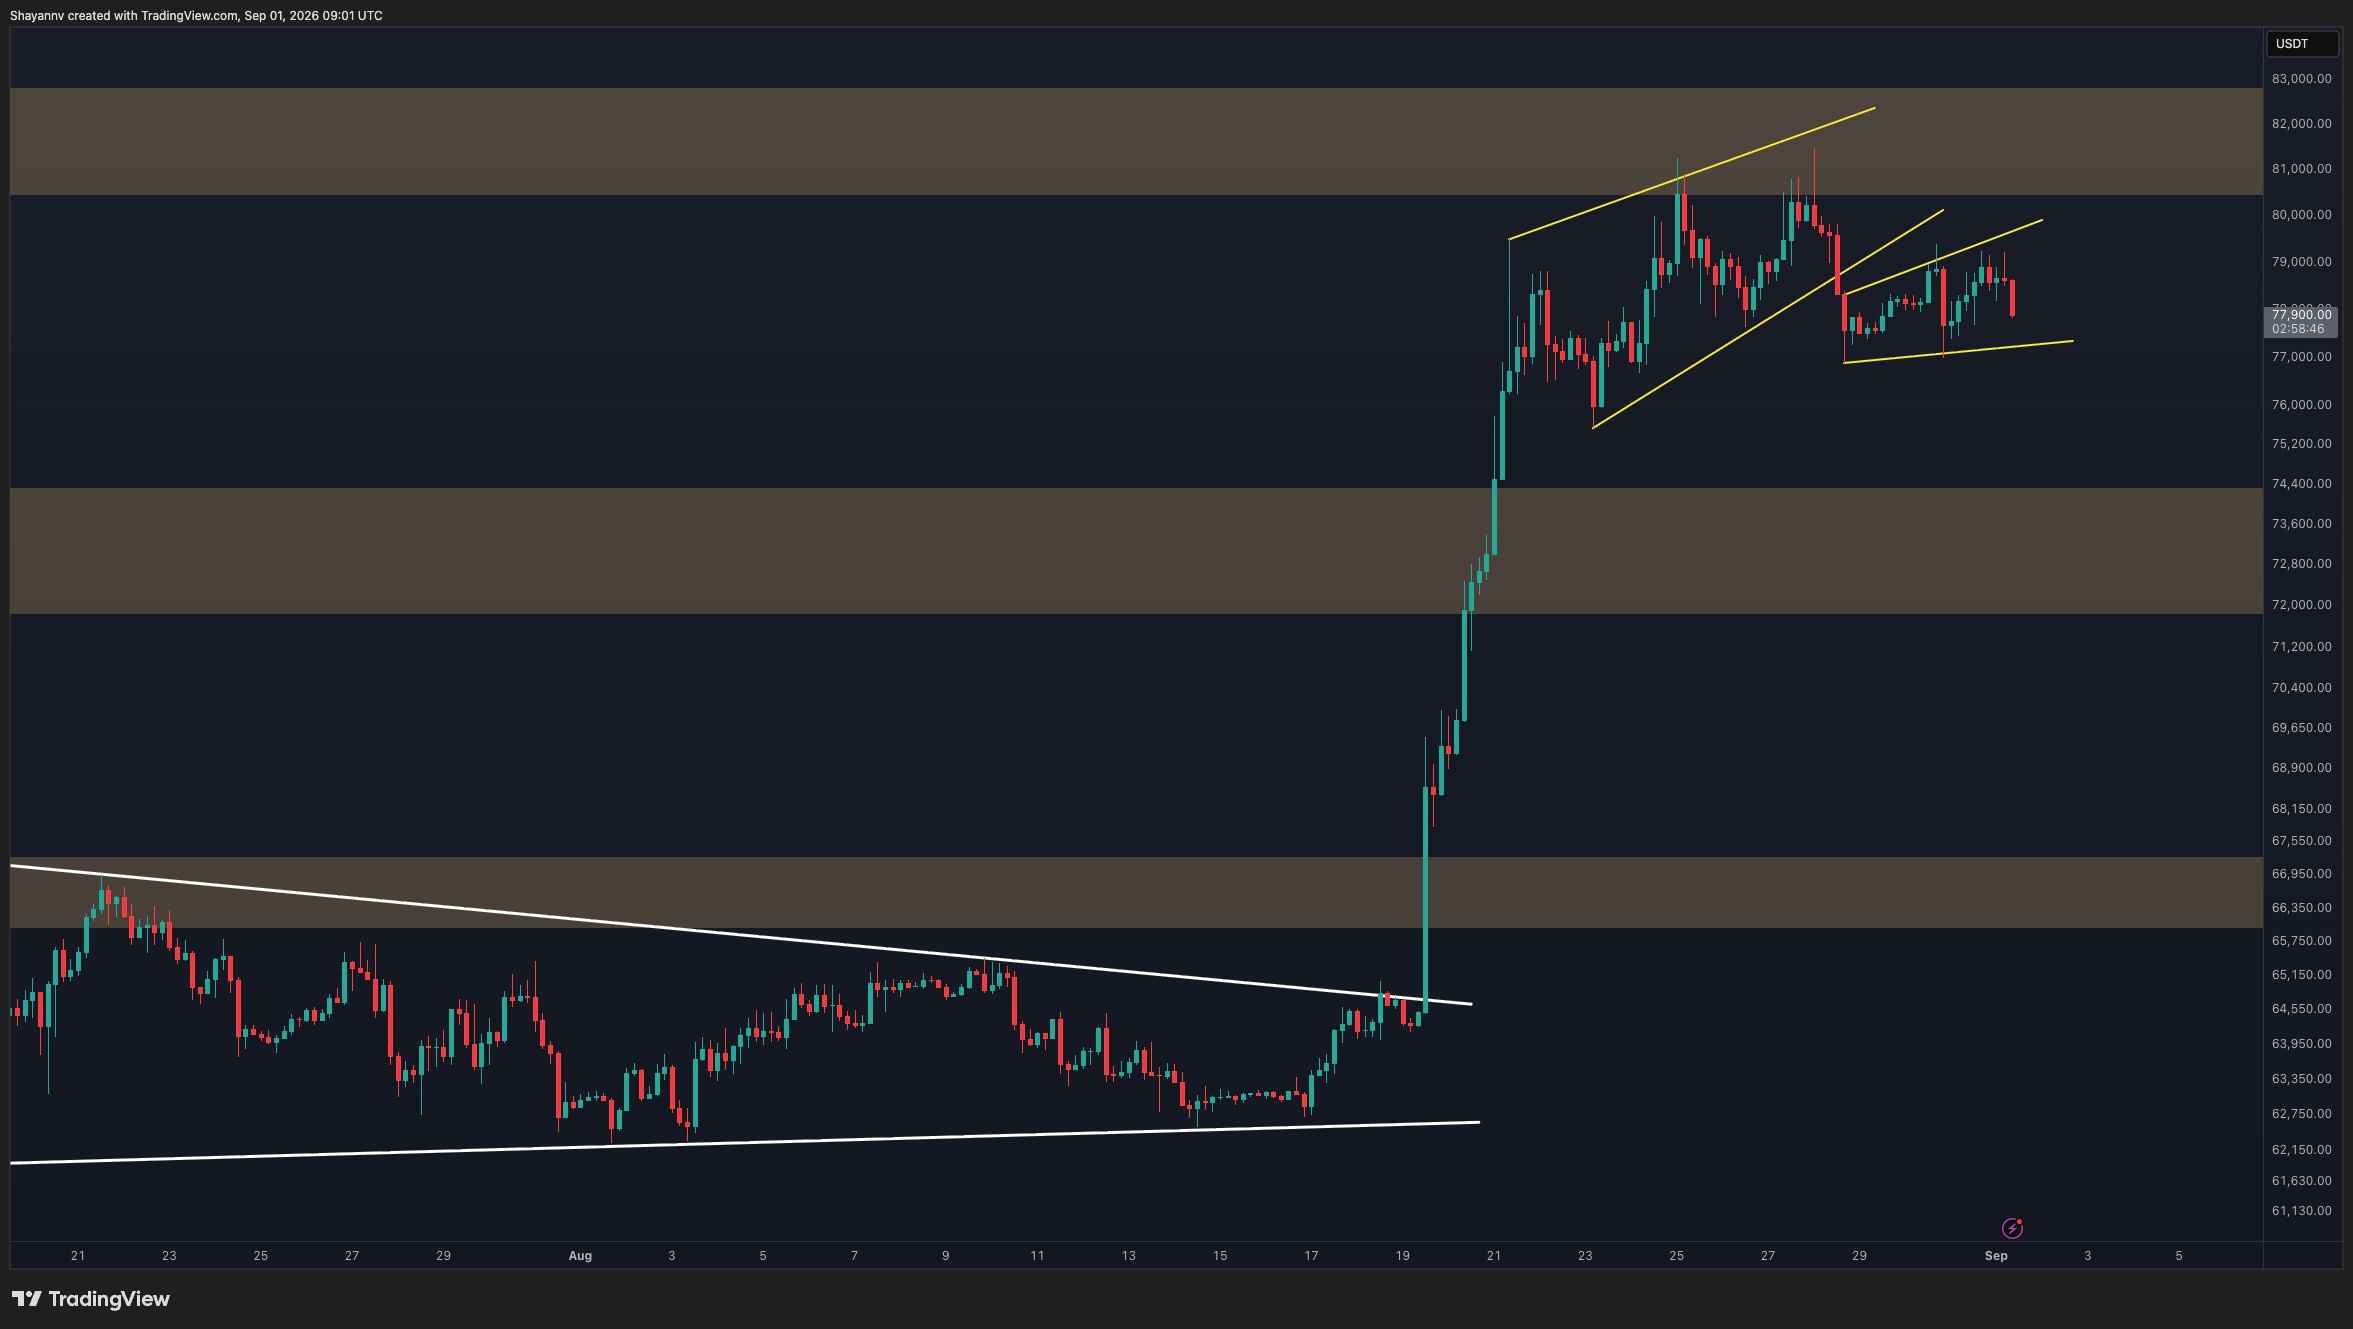
The deterioration is more apparent on the 4-hour timeframe. Bitcoin initially formed an ascending channel following its breakout, but the price subsequently lost the lower boundary and failed to recover it.

The latest consolidation has developed into a smaller rising structure around the $77K-$80K area. However, the recent rejection from its upper boundary has pushed BTC back toward the lower trendline near $77K. This makes the current area an important short-term decision point.

A breakdown below this structure would strengthen the case for a larger correction, particularly given the lack of bullish follow-through over recent sessions. In that scenario, the $72K-$74.4K support zone would become increasingly relevant.

Alternatively, buyers could still invalidate the developing bearish setup by reclaiming $79K-$80K and eventually breaking through the $80.5K-$82.5K resistance zone. Yet, without such a move, the repeated inability to extend the rally suggests that downside risk is gradually building.

Sentiment Analysis

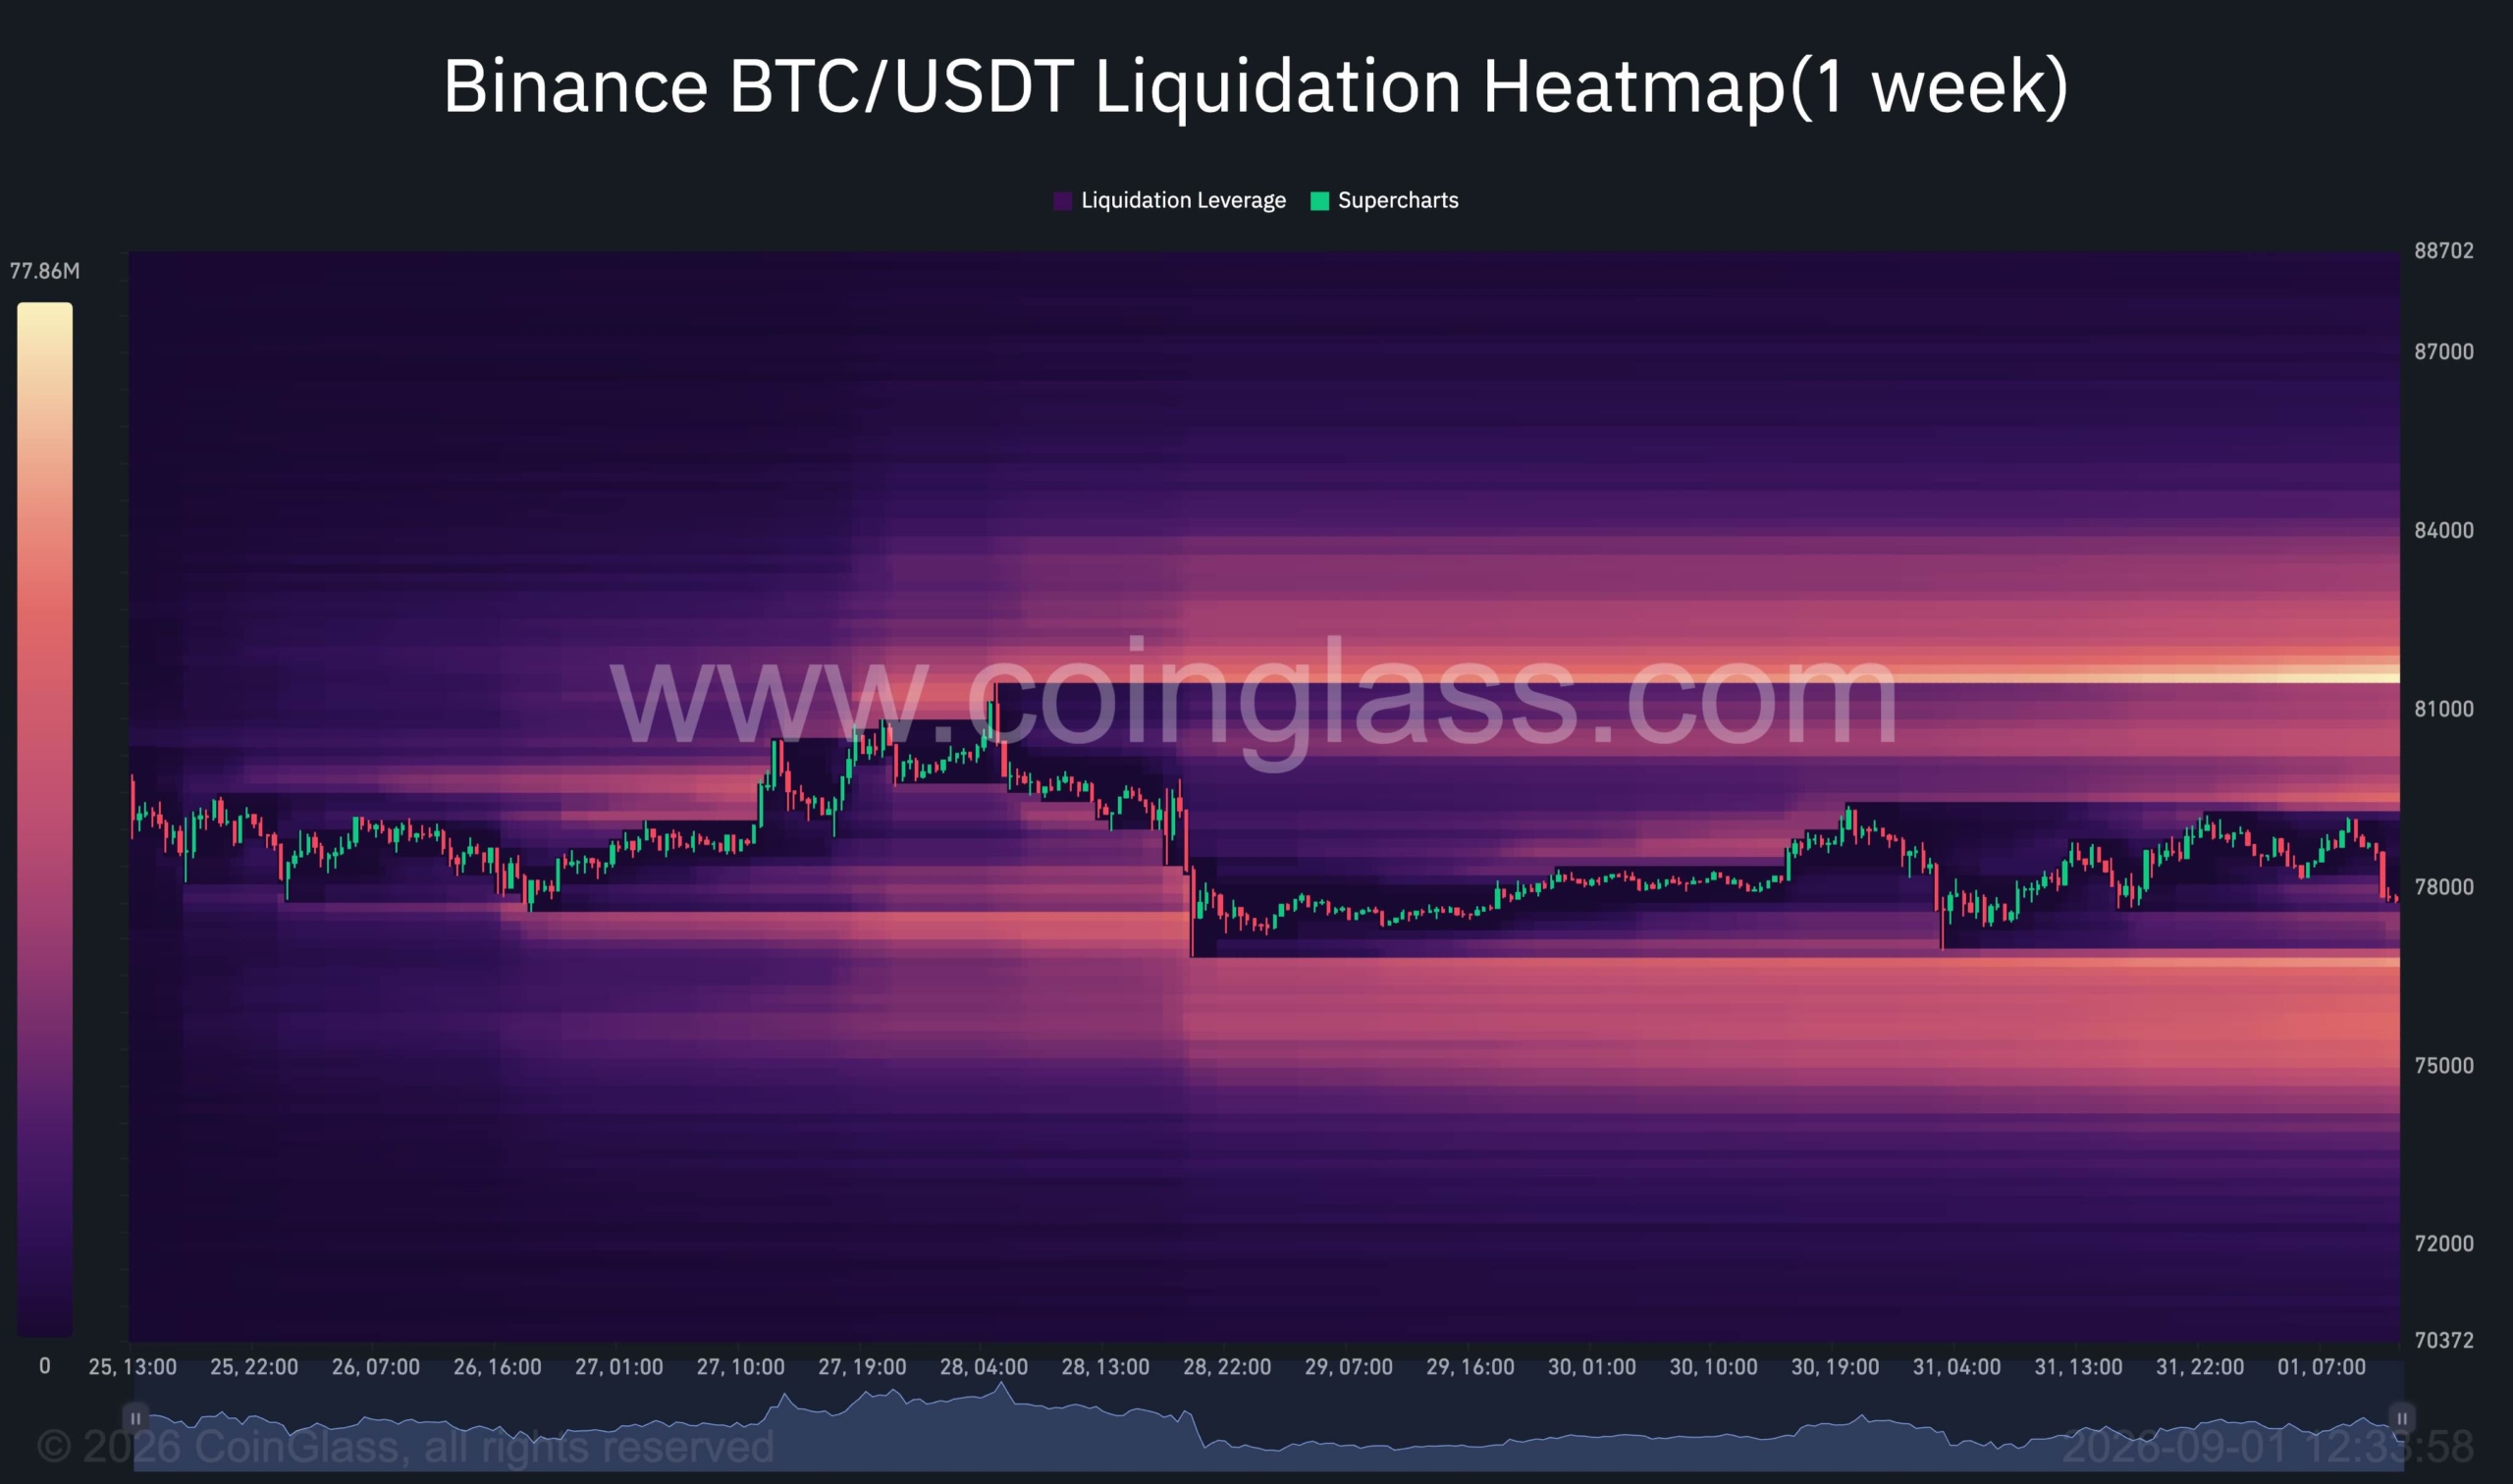
The one-week Binance BTC/USDT liquidation heatmap provides additional support for the possibility of increased volatility. Bitcoin is currently positioned between substantial liquidity concentrations on both sides of the market, but the downside cluster is particularly relevant given the weakening short-term price structure.

A broad concentration of liquidation liquidity is visible below the current price, extending approximately through the $74K-$77K region. If BTC loses its current short-term support, this liquidity could act as a magnet and accelerate a sweep toward lower levels.

There is also substantial liquidity above the market, most notably around $80K-$82K, meaning an upside liquidity hunt remains possible. However, Bitcoin’s repeated inability to sustain advances toward this region reduces the strength of that scenario for now.

Overall, the heatmap and price structure point to an increasingly fragile consolidation. A downside liquidity sweep toward the mid-$70K region, potentially followed by a test of the major $72K-$74.4K technical support zone, appears more plausible than it did previously unless buyers quickly restore momentum above $80K.

The post Bitcoin Price Analysis: Warning Signs Emerge as BTC’s Breakout Loses Momentum appeared first on CryptoPotato.

Ethereum Price Prediction: What’s Next for ETH After Massive Rally From $1.9K to $2.5K?

31 August 2026 at 17:28

Ethereum is consolidating after a sharp breakout from the $1.9K area, with ETH currently trading below $2.5K. The technical structure has improved considerably, while the continued decline in exchange reserves provides a supportive backdrop.

However, ETH’s $2.5K resistance zone is a meaningful one, and a breakout or rejection from this level is key to determining whether the recovery can extend or the recent price surge was just a bull trap.

Ethereum Price Analysis: The Daily Chart

The daily chart shows a significant structural improvement over the past several weeks. ETH broke above the descending channel that had contained the price throughout the past few months, subsequently reclaiming the $1.9K region and then accelerating sharply higher.

The breakout also pushed ETH through the $2.1K resistance zone before the asset surged toward the current $2.5K area. The move also brought ETH above both the 100-day (~$1.9K) and 200-day (~$2.05K) major moving averages. These moving averages are also now sloping upward, which suggests that the broader bearish structure is losing momentum and a structural bullish shift might be occurring.

As already mentioned, ETH is now trading inside a resistance zone around $2.45K-$2.55K. This area has repeatedly attracted selling pressure in recent sessions, with several candles failing to establish a decisive breakout above $2.5K. A daily close above this region would strengthen the bullish continuation scenario and could expose the next major resistance around $3K and potentially higher.

On the downside, the first important support is around $2.1K. This zone is particularly significant because it previously acted as resistance and was decisively reclaimed during the latest rally. A pullback that holds this area would therefore keep the bullish breakout structure intact.

Below it, the $1.9K zone represents another important support region and serves as the initial point of the breakout. Therefore, a sustained move back below it would weaken the current bullish structure and raise the risk that the recent breakout was just a failed recovery preceding a deeper decline.

ETH/USDT 4-Hour Chart

The 4-hour chart provides a clearer view of August’s price action and the current consolidation. Following the vertical breakout from $1.9K, ETH initially pushed above $2.3K and continued toward $2.5K. Since then, the price has been moving sideways within a relatively tight range, with the $2.5K level acting as the upper boundary.

This consolidation can be interpreted constructively as long as ETH continues to hold the higher levels established during the breakout. The market is effectively digesting a very aggressive upward move rather than immediately giving back the entire rally.

Therefore, the immediate resistance remains around $2.5K. A decisive 4-hour breakout and sustained trading above this zone would provide confirmation that buyers are regaining control and could open the way toward higher daily-chart resistance.

Looking below, the first notable support lies around $2.2K-$2.3K. This zone coincides with a bullish order block, where the latest acceleration higher began, and could therefore attract buyers if ETH undergoes a deeper retracement.

The next support is around $2.05K-$2.1K, and holding this area would be particularly important, as a drop below it would also lead to a decline below the $2K psychological level and could quickly damage market sentiment.

Meanwhile, the 4-hour RSI has pulled back from overbought territory and is hovering around 50. This is consistent with a cooling-off phase following the breakout rather than an outright momentum breakdown. A renewed move above the $2.5K area while RSI expands again would strengthen the continuation setup, but this scenario will likely materialize after further consolidation or correction, as the market seems over-extended in the short-term.

Sentiment Analysis

The exchange-reserve chart provides a notably constructive signal for Ethereum. ETH held on exchanges has declined steadily from above 21M ETH in 2025 to approximately 14.9M ETH at the latest reading shown on the chart. The decline has even become steeper over the past couple of months.

At the same time, ETH’s price has recovered from $1.5K to approximately $2.4K. The divergence is important because the declining exchange reserve suggests that a smaller quantity of ETH is sitting on exchanges and potentially immediately available for selling. While exchange reserves alone cannot determine future price direction, sustained withdrawals can reduce readily available sell-side supply if the trend reflects longer-term accumulation or movement into self-custody and other non-exchange venues.

The chart also shows that the decline in exchange reserves has persisted even through periods of significant price volatility. This makes the current supply-side backdrop more constructive than if reserves were rising alongside the latest rally.

As a result, the technical and on-chain pictures are currently aligned. ETH has broken its longer-term descending trend, reclaimed the key $2K area, and is consolidating near the next resistance while exchange reserves continue to fall. This shrinking supply might just need a slight demand push from the spot or the futures market to result in a breakout and a further rally.

Β 

The post Ethereum Price Prediction: What’s Next for ETH After Massive Rally From $1.9K to $2.5K? appeared first on CryptoPotato.


Ripple Price Analysis: XRP Hits Critical Decision Point as Key Support Comes Under Pressure

31 August 2026 at 17:23

Ripple’s XRP is undergoing a corrective phase after its explosive breakout from the $1 region. While the broader structure has improved substantially, fading momentum below the $1.45-$1.55 resistance zone suggests the market may need a deeper pullback or additional consolidation before attempting another sustained advance.

XRP Price Analysis: The Daily Chart

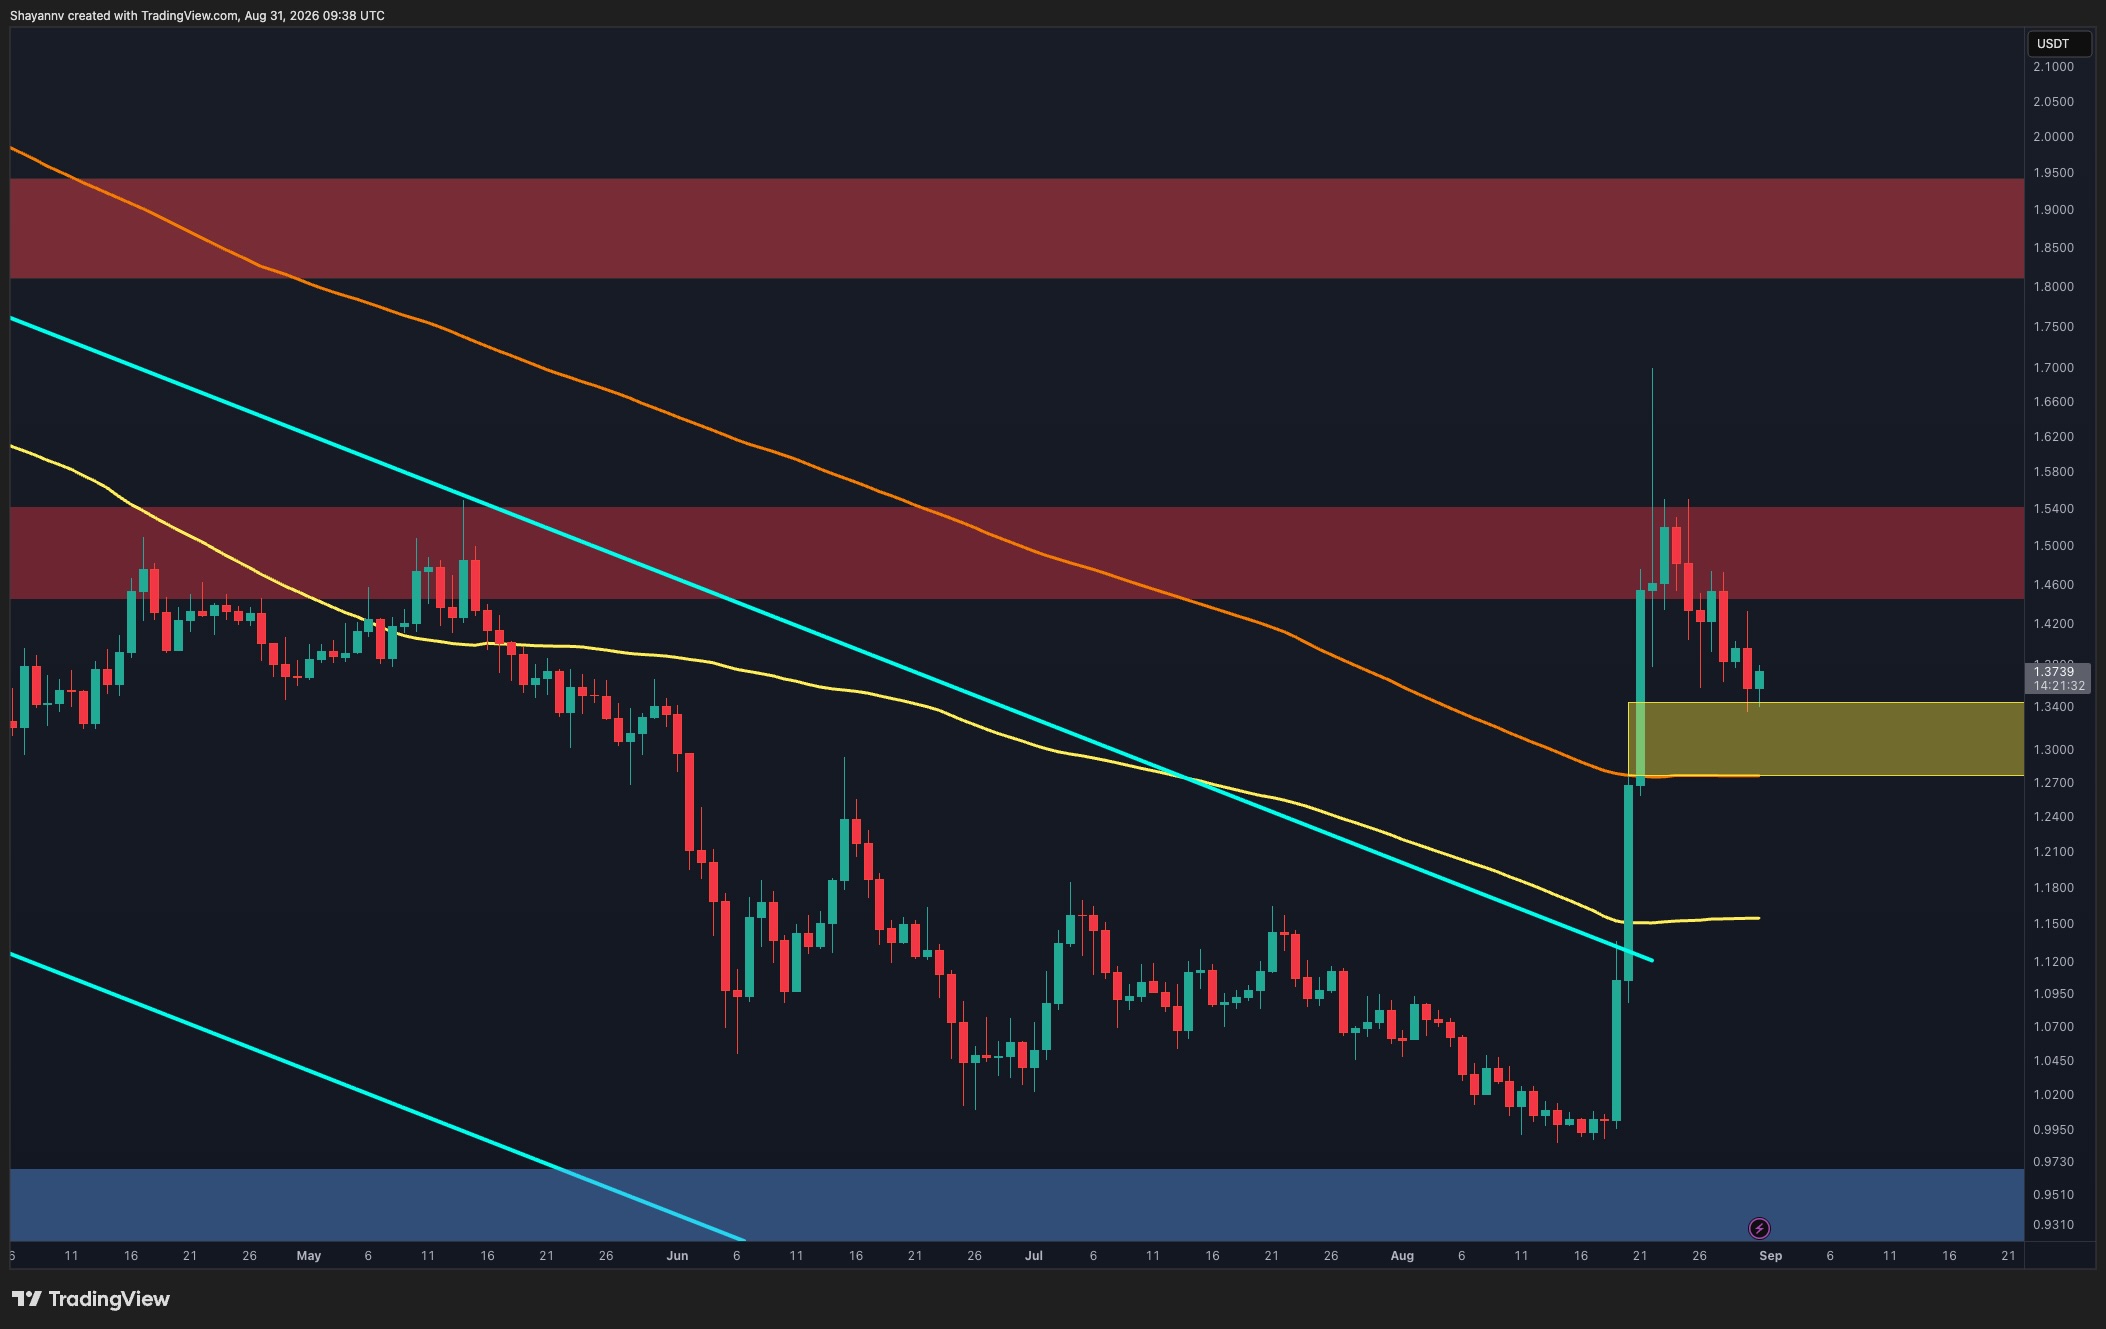
On the daily timeframe, XRP’s breakout represented a major structural shift, with the price escaping the prolonged descending channel and surging through both moving averages. However, the rally encountered substantial selling pressure inside the $1.45-$1.55 resistance zone, while the long upper wick toward $1.70 highlights the rejection of higher prices.

The token has since retraced toward $1.37, with the sequence of lower highs and lower lows following the rejection indicating that short-term momentum has turned corrective.

The first important support is the $1.27-$1.34 zone. This area also overlaps with the higher moving average shown on the chart, strengthening its technical significance. A successful reaction from this region could allow XRP to stabilize before another attempt at the $1.45-$1.55 resistance zone.

However, a daily breakdown below $1.27 would weaken the post-breakout structure and increase the probability of a deeper correction. In that case, the lower moving average around $1.15 could become relevant before the broader $0.93-$0.97 demand zone comes back into consideration.

XRP/USDT 4-Hour Chart

The 4-hour chart shows XRP consolidating after the initial rally from approximately $0.99 to $1.70. The subsequent rejection from the $1.43-$1.55 supply zone has gradually pushed the price back toward the 0.5 Fibonacci retracement at $1.34.

This makes the $1.33-$1.34 area an important near-term decision point. The asset has already tested this level and produced a modest reaction, but buyers have yet to generate a convincing recovery. Holding above it could lead to continued sideways consolidation and potentially another attempt at the $1.43-$1.55 resistance zone.

If the $1.34 level fails, however, the correction could extend toward the next Fibonacci levels. The 0.618 retracement at $1.26 sits inside the first notable pullback zone, while the 0.702 level near $1.20 provides another support reference. A more substantial correction would bring the 0.786 retracement at $1.14 and the broader $1.09-$1.14 support zone into focus.

For now, the short-term structure remains corrective below $1.43-$1.55. A sustained reclaim of this resistance zone would be needed to shift momentum decisively back toward the bulls and reopen the possibility of challenging the $1.70 high.

The post Ripple Price Analysis: XRP Hits Critical Decision Point as Key Support Comes Under Pressure appeared first on CryptoPotato.

Bitcoin Price Analysis: Is BTC Entering a Consolidation Phase After Its Explosive Rally?

30 August 2026 at 19:27

Bitcoin’s powerful breakout has lost some of its initial momentum after reaching the $80K region. With both spot price action and futures activity showing reduced conviction, BTC appears increasingly likely to enter a choppy consolidation phase before establishing its next major directional move.

Bitcoin Price Analysis: The Daily Chart

Bitcoin’s daily structure remains substantially stronger following the impulsive breakout from the $64K-$65K region. The rally pushed the price above both major moving averages shown on the chart and decisively cleared the $65.9K-$67.1K and $72K-$74.4K resistance zones.

However, bullish momentum has faded after BTC reached the major $80.5K-$82.5K supply zone. Several recent candles show hesitation beneath this area, with Bitcoin currently hovering above $78K. This suggests that buyers have not yet generated enough follow-through to force another decisive expansion.

The broader structure remains bullish while BTC stays above the reclaimed $72K-$74.4K zone, but the immediate outlook appears more neutral. Continued weakness in momentum could result in sideways and volatile price action between this support area and the $80.5K-$82.5K resistance zone.

A decisive break above $82.5K would favor bullish continuation. Conversely, losing the $72K-$74.4K region would represent a more meaningful deterioration in the post-breakout structure.

BTC/USDT 4-Hour Chart

The 4-hour timeframe provides a clearer indication that short-term momentum is weakening. Following the initial surge, Bitcoin formed a rising channel beneath the $80K-$82K resistance area. The asset has now broken below the channel’s lower boundary, interrupting the sequence of higher lows.

Despite this breakdown, BTC has not accelerated significantly lower and is instead stabilizing around $77K-$78K. This lack of bearish follow-through reinforces the possibility of choppy consolidation rather than an immediate large correction.

For buyers to regain short-term control, Bitcoin would need to reclaim the broken channel and push back through the $80K region. Until that occurs, the recent highs around $80K-$82K remain the primary resistance zone.

On the downside, the $72K-$74.4K area represents the most important nearby support. With momentum fading on both sides, BTC could continue fluctuating between these broader boundaries while the market searches for sufficient liquidity to establish its next trend.

Sentiment Analysis

The Bitcoin Futures Average Order Size chart supports the lack-of-momentum scenario. The metric categorizes futures activity according to the relative size of orders, providing insight into whether whales, smaller participants, or more ordinary flows are dominating trading.

The latest readings are predominantly classified as normal orders, with no sustained cluster of large whale activity visible at the end of the chart. This indicates that major futures participants are not showing particularly strong directional conviction despite Bitcoin trading near $78K.

Combined with the hesitation visible in spot price action, the absence of notable large futures orders suggests participation is currently insufficient to support another highly impulsive move. Neither aggressive demand nor overwhelming supply appears dominant.

As a result, Bitcoin may remain vulnerable to low-momentum, volatile consolidation in the short term. A renewed concentration of large whale orders alongside a breakout from the current spot range would provide a stronger indication that directional momentum is returning.

The post Bitcoin Price Analysis: Is BTC Entering a Consolidation Phase After Its Explosive Rally? appeared first on CryptoPotato.

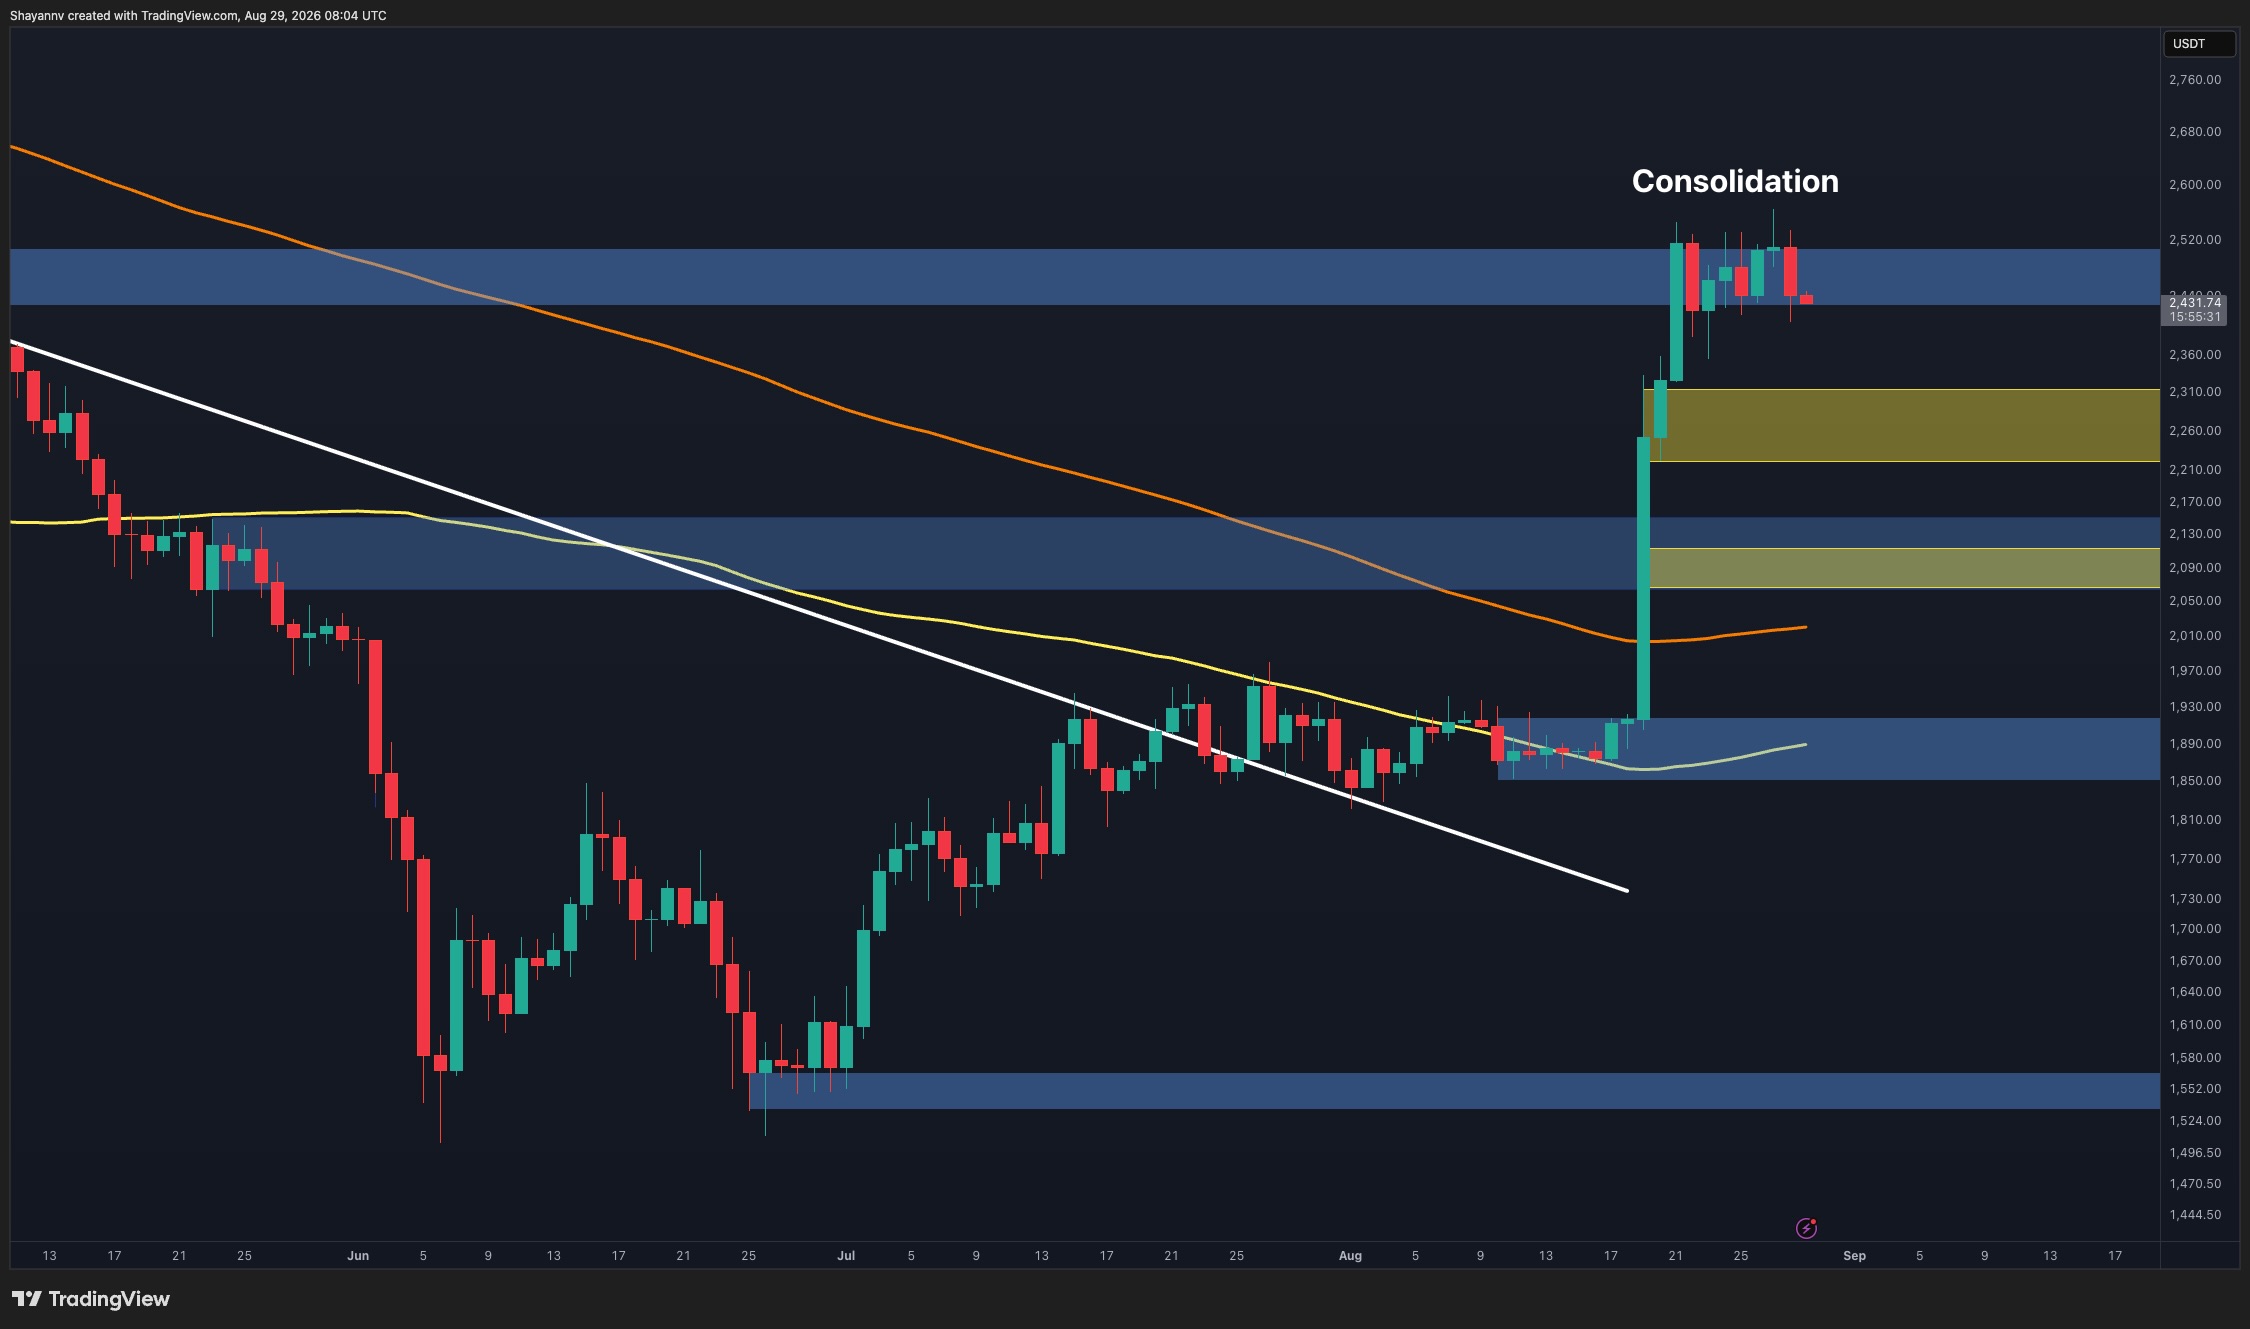
Where Will ETH Find Support After the $2.5K Rejection? (Ethereum Price Analysis)

29 August 2026 at 16:16

Ethereum’s explosive rally has stalled around a major resistance area, with price action now turning increasingly choppy near $2.5K. The broader recovery remains intact, but weakening short-term structure and a more hawkish macro backdrop raise the probability of consolidation or a corrective pullback before another sustained advance.

Ethereum Price Analysis: The Daily Chart

Ethereum is consolidating after its powerful breakout from the $1.85K-$1.92K base. The price has now reached the major $2.4K-$2.52K supply zone, where buyers have so far struggled to generate another impulsive continuation. The repeated rejection around this region suggests that supply is becoming increasingly relevant following the near-vertical advance.

As a result, choppy consolidation appears likely in the short term, while a corrective move should not be ruled out. The first notable support sits around the $2.21K-$2.31K zone. Below it, the $2.06K-$2.14K area represents the next important support region and could become relevant if selling pressure accelerates.

The macro environment is also adding pressure. Federal Reserve Chair Kevin Warsh’s latest Jackson Hole remarks emphasized that inflation remains too elevated and suggested that rates may need to remain restrictive or potentially move higher if inflation fails to make sufficient progress toward the Fed’s 2% objective.

Markets interpreted the comments as hawkish, with expectations for another rate increase rising after the speech. This backdrop appears to be weighing on risk sentiment and could make an immediate Ethereum breakout more difficult.

ETH/USDT 4-Hour Chart

The short-term picture is showing clearer signs of exhaustion. Ethereum has repeatedly tested the upper portion of the $2.4K-$2.52K resistance zone, producing three successive peaks around the same broad area.

This price action creates the potential for a three-drive pattern. Such a structure typically signals that the preceding directional move is losing momentum and can precede either a sideways range or a temporary reversal. More importantly, Ethereum has now slipped below the ascending trendline connecting the recent higher lows, adding weight to the possibility that the immediate bullish impulse is weakening.

The first downside area to monitor remains the $2.21K-$2.31K pullback zone. A correction into this region would still be compatible with the broader bullish structure and could allow the market to establish a healthier base. If that support fails, the second pullback zone around $2.07K-$2.11K becomes the next significant target.

Alternatively, holding the current $2.4K area and reclaiming the rising trendline would reduce the immediate bearish pressure. A convincing breakout through the $2.52K region would also invalidate the developing reversal setup and favor continuation of the broader bullish trend.

Sentiment Analysis

Ethereum’s Spot Average Order Size chart provides additional context for the current indecision. The metric distinguishes periods dominated by larger whale-sized spot orders from more ordinary market activity.

Most recent observations appear to be classified as normal orders, with no notable concentration of large whale transactions at the latest readings. This suggests that neither exceptionally strong whale demand nor aggressive whale supply is currently dominating the spot market.

The absence of substantial large-player participation fits the technical consolidation scenario. With limited evidence of strong directional conviction and relatively subdued participation, Ethereum may remain vulnerable to volatile swings within a range rather than immediately establishing another sustained trend. A meaningful return of large whale orders could therefore provide a more useful signal that stronger demand or supply is entering the market.

The post Where Will ETH Find Support After the $2.5K Rejection? (Ethereum Price Analysis) appeared first on CryptoPotato.

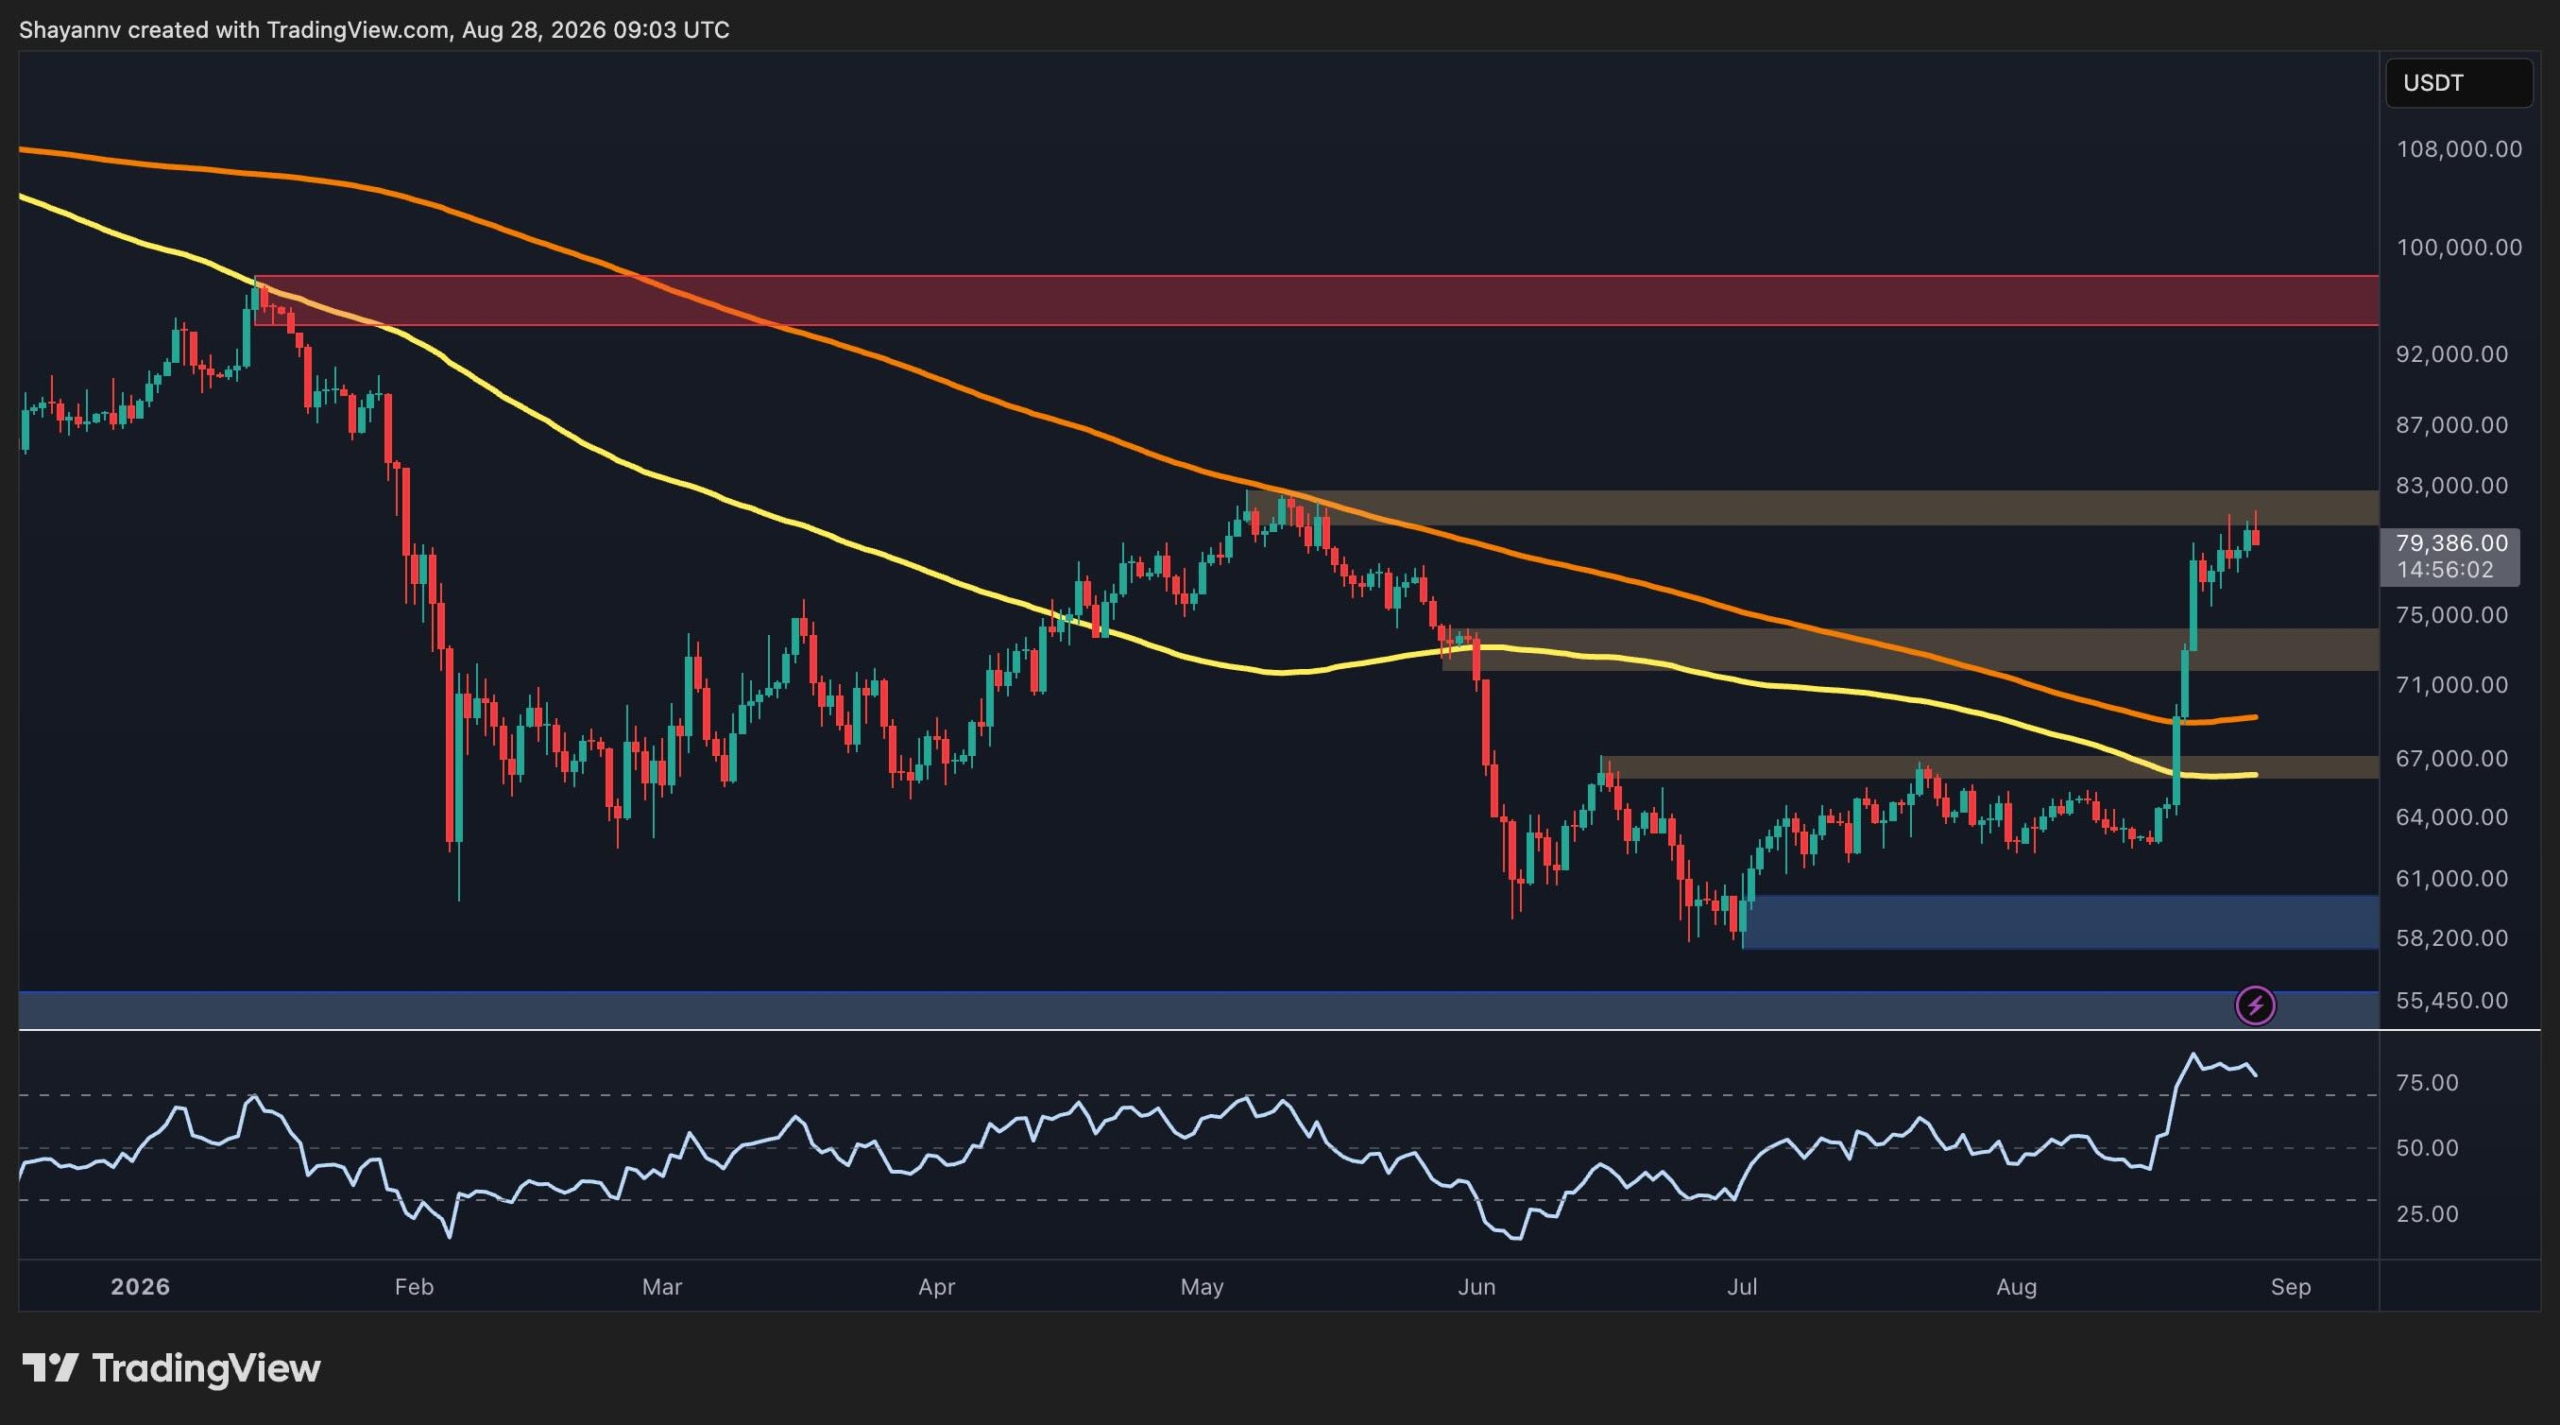
Bitcoin Price Analysis: BTC Fails at $81K Again – Is a Bigger Pullback Coming?

28 August 2026 at 18:26

Bitcoin is consolidating near $79K after a sharp breakout from a multi-week consolidation structure. The move has significantly improved the broader technical picture, although momentum is now showing some signs of cooling as BTC approaches a major resistance area around $80K.

Bitcoin Price Analysis: The Daily Chart

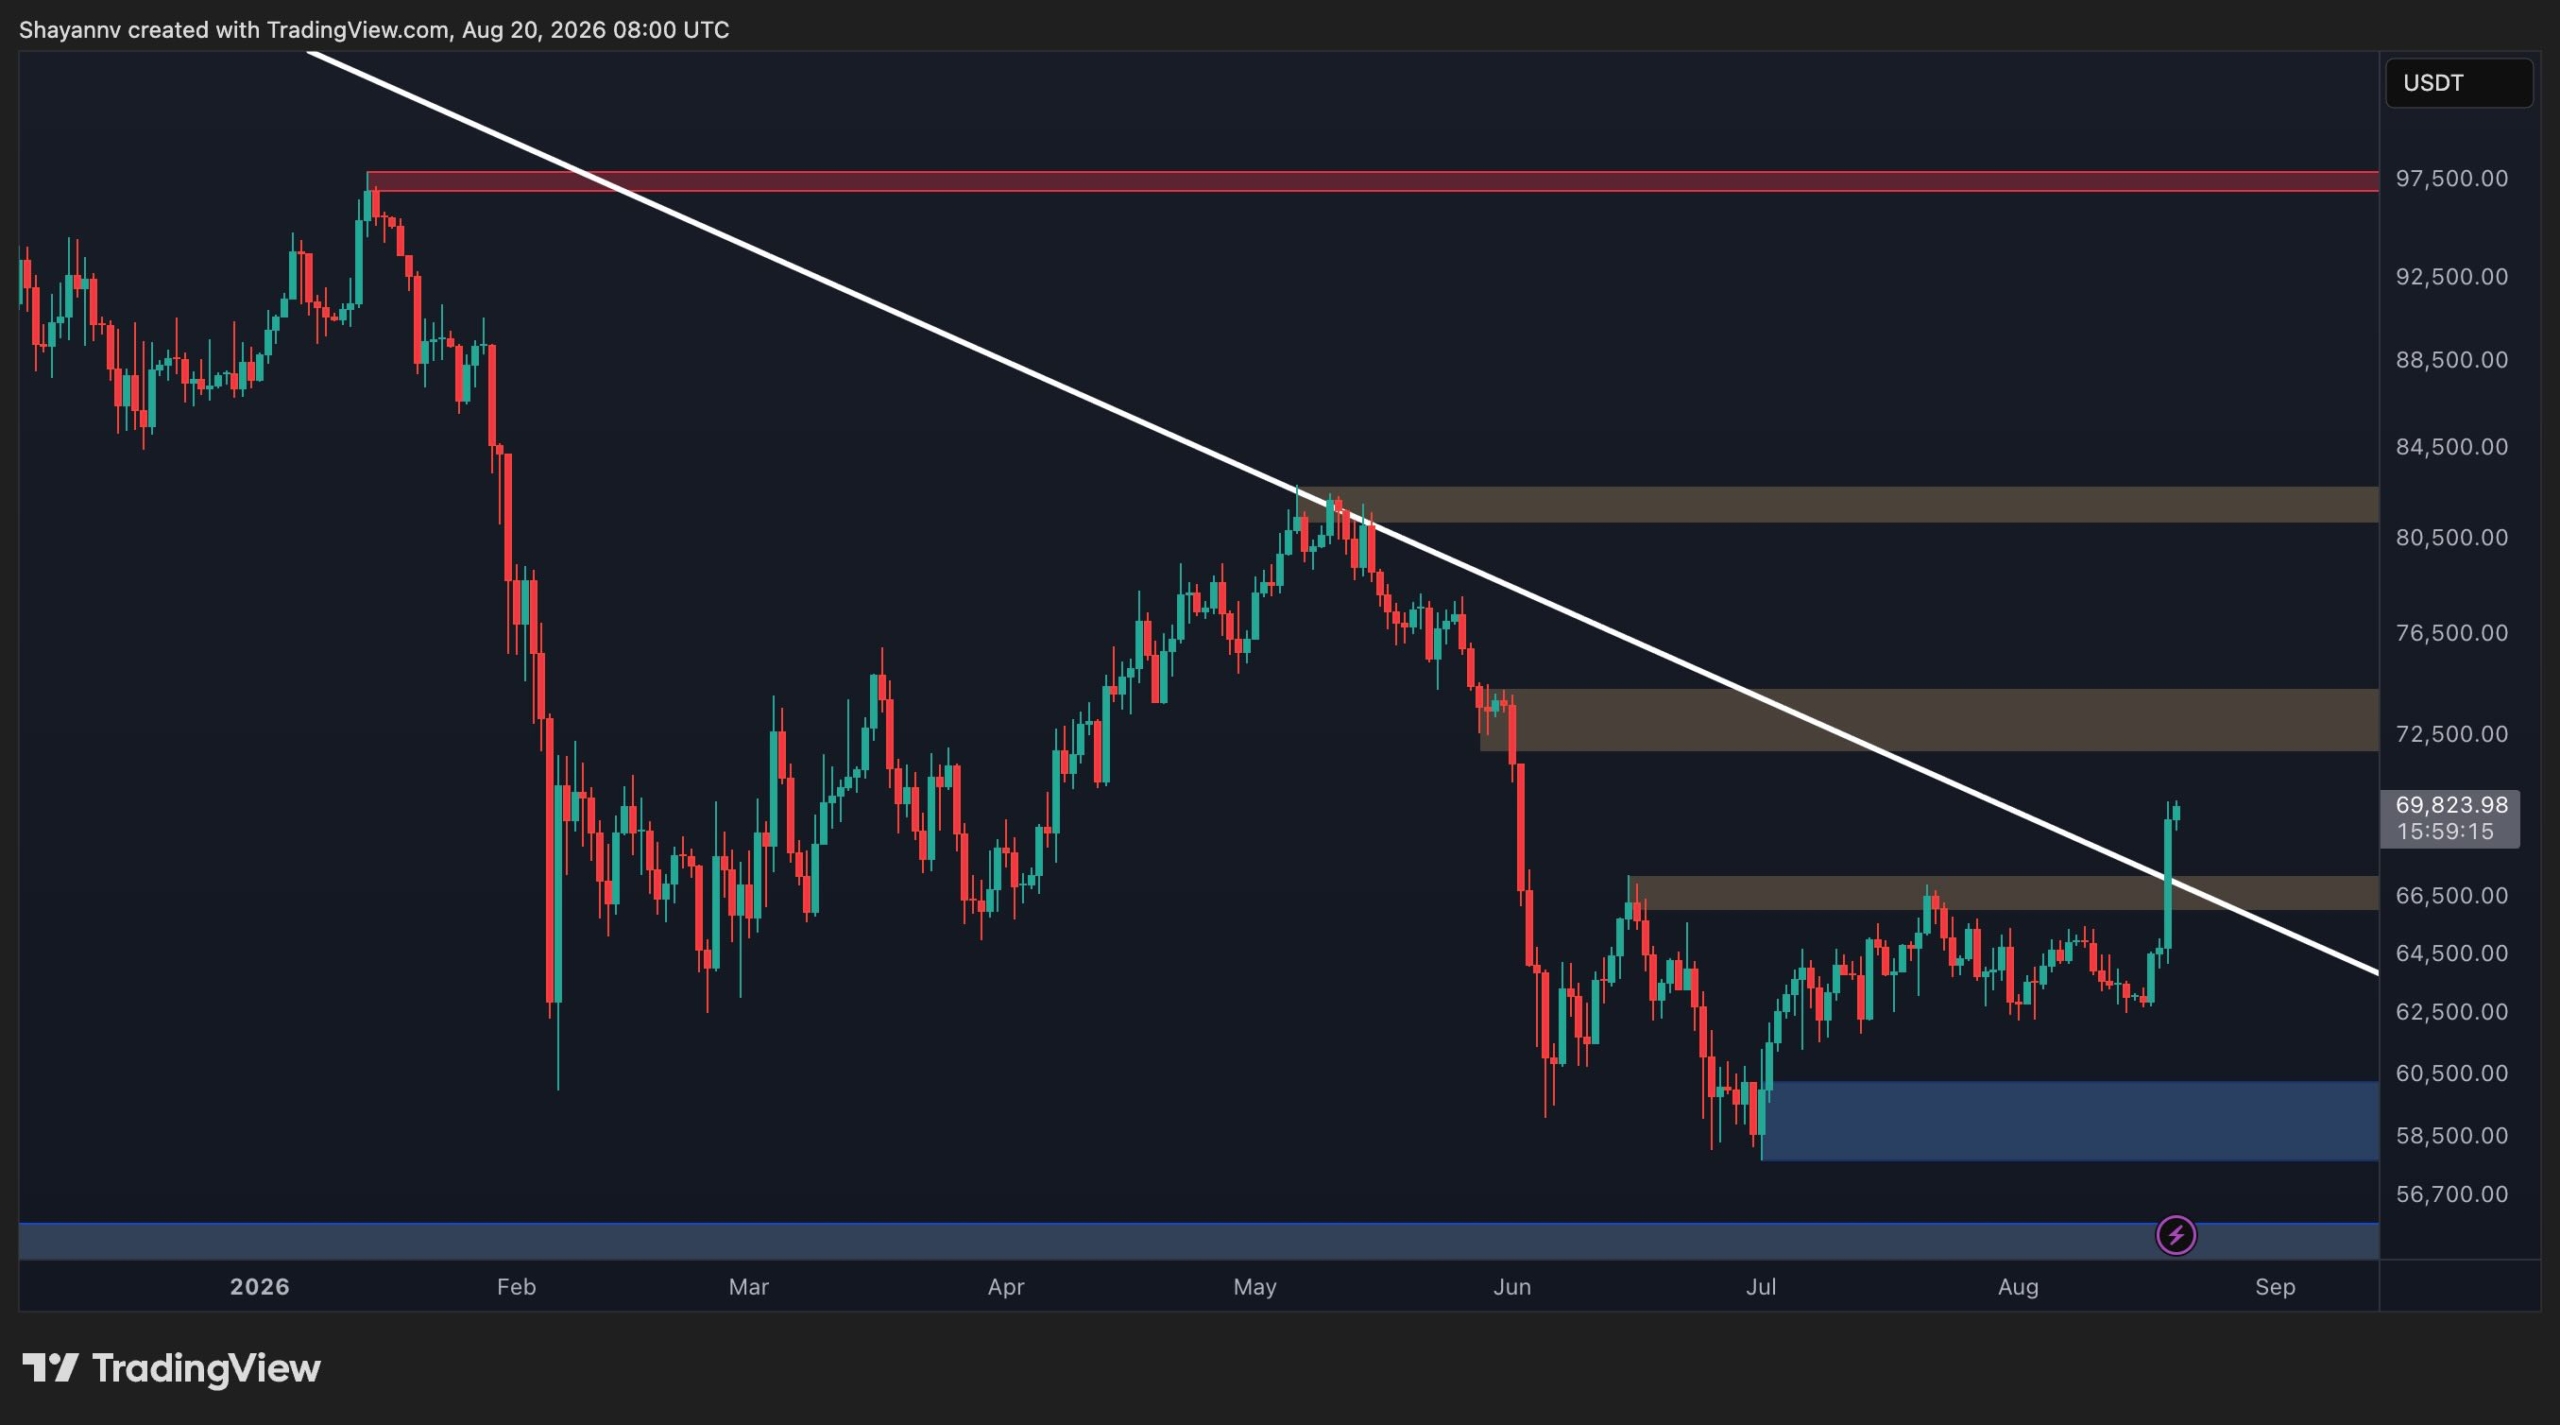
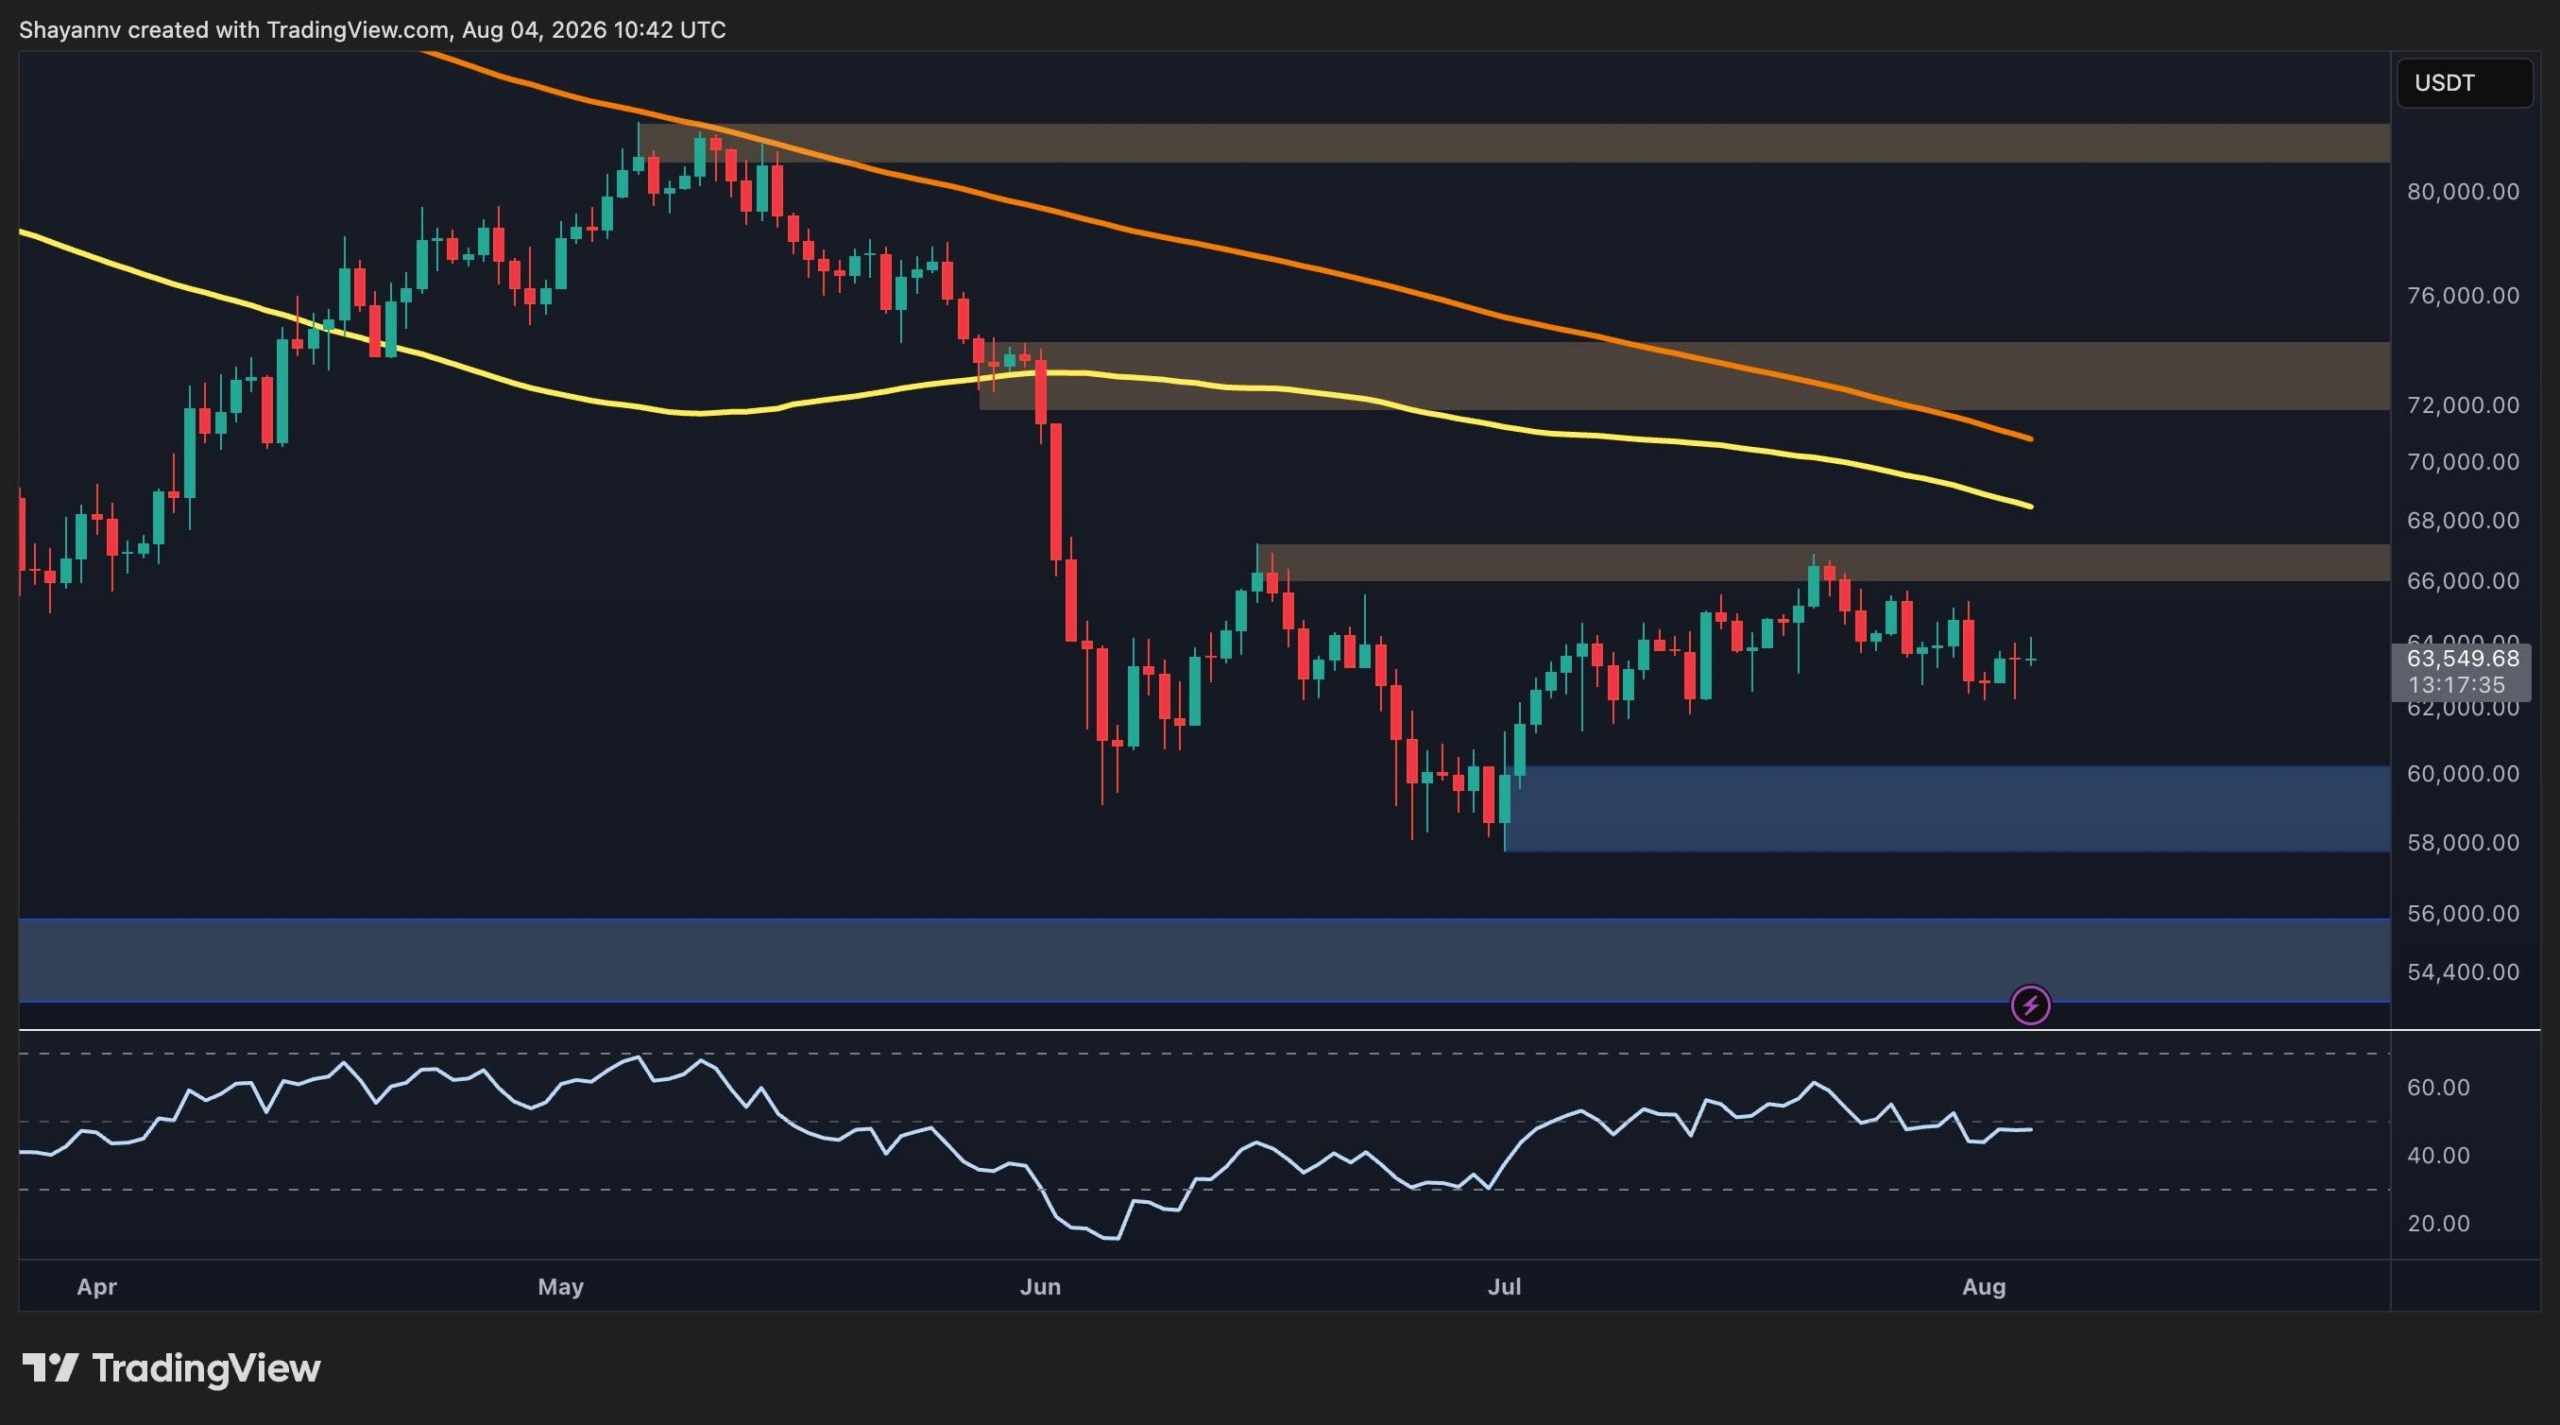
The daily chart shows a decisive breakout from the consolidation range below $67K that had contained Bitcoin for the past couple of months. The asset first reclaimed the $67K resistance zone and then accelerated higher, pushing through the $72K-$74K area before reaching the current region near $80K.

The breakout is technically significant because the price has also moved back above both the 100-day (~$67K) and 200-day (~$70K) moving averages shown on the chart. These moving averages are already turning upward, suggesting that the medium-term structure is improving after months of a downtrend.

Bitcoin is now testing the $80K resistance zone. A daily close above this zone would form a long-term higher high and could open the way toward the $95K resistance region.

On the downside, the $72K-$74K area has become the first major support zone following the breakout. If this zone breaks, a deeper correction could bring BTC back toward $67K, which is another important former resistance area and now a potential support region. As long as the price remains above these zones, the recent breakout structure remains broadly constructive.

BTC/USDT 4-Hour Chart

The 4-hour chart provides a more immediate view of the current consolidation. Following the explosive move from the $63K-$65K region, BTC is establishing a rising wedge with clear higher lows and higher highs just below the $80K resistance zone. The price is currently trading around $79K and is seemingly declining toward the lower boundary of the wedge after another rejection from the resistance.

The $80K region is therefore the key area to watch. Bitcoin has already tested the lower part of this zone several times, but has not yet produced a convincing breakout. A sustained move above $80K would strengthen the continuation setup and potentially expose the next major resistance around $95K.

On the downside, the rising channel’s lower boundary currently provides dynamic support, with the broader $72K-$74K region also standing out as an important area if the structure breaks. The short-term RSI has also been trending lower while the price was making higher highs.

This bearish divergence between price and momentum suggests that buying pressure is getting exhausted, even though the underlying price structure remains bullish. Consequently, Bitcoin could require a period of sideways consolidation before attempting another breakout.

Sentiment Analysis

The Coinbase Premium Index provides an important additional signal. The metric has spent much of the recent period below zero, indicating weaker relative spot demand on Coinbase, but it has now rebounded sharply and is currently around +0.03.

This recovery is notable because it coincides with Bitcoin’s latest price advance. The move from deeply negative readings toward positive territory after months suggests that U.S.-based spot buying pressure has improved alongside the breakout. If the premium remains positive while BTC holds above $75K, it would provide additional confirmation that the rally is supported by spot demand rather than being driven solely by derivatives activity.

However, the recent spike in the premium should be monitored alongside the price. A renewed move back below zero while BTC struggles to break above $80K would weaken the confirmation and could increase the probability of a short-term correction.

The post Bitcoin Price Analysis: BTC Fails at $81K Again – Is a Bigger Pullback Coming? appeared first on CryptoPotato.

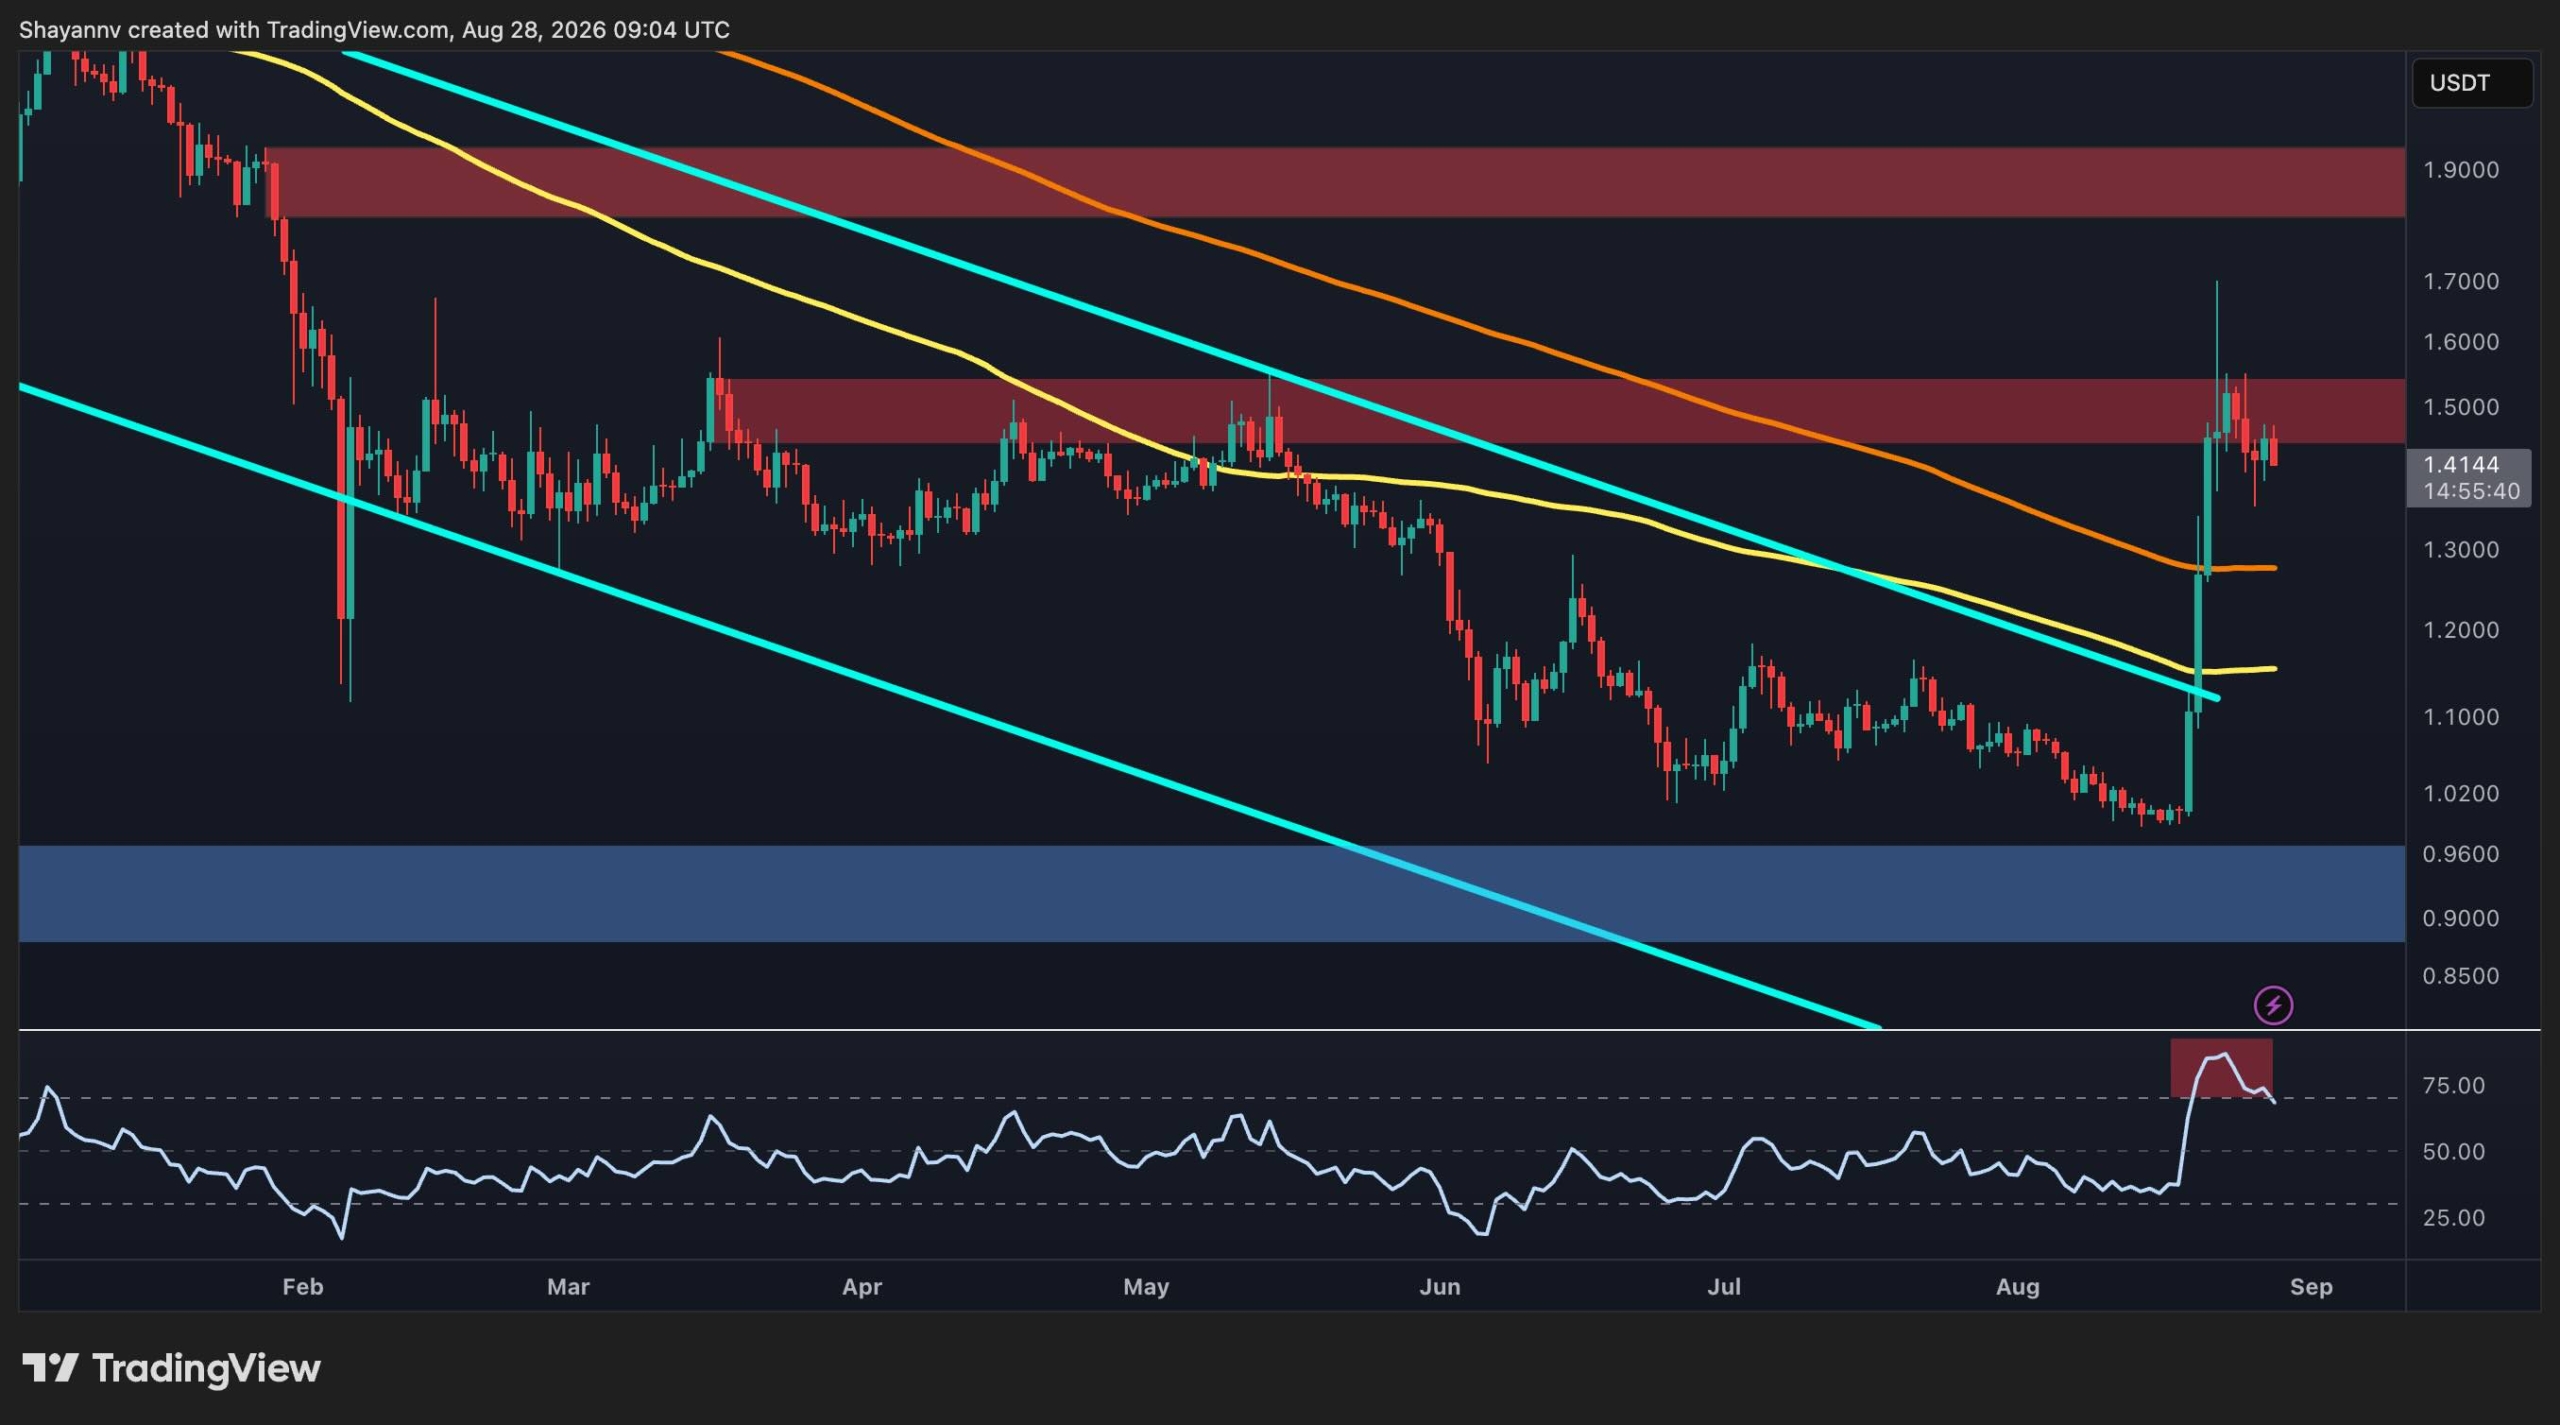
Ripple Price Analysis: XRP Looks Bullish Against USD but the BTC Pair Tells a Different Story

28 August 2026 at 17:09

XRP has staged a sharp recovery from its August lows against USDT, breaking above the descending large channel and reclaiming key moving-average levels. However, the rally has now reached a major resistance area around $1.50, while momentum is beginning to cool down.

The broader structure is therefore improving, but the token still needs a sustained breakout above this supply zone. Meanwhile, the XRP/BTC pair is also lagging behind, which is a notable development to watch.

Ripple Price Analysis: The USDT Pair

XRP spent much of the year trading inside a broad descending structure, with the descending trendlines defining the dominant downtrend. The latest move represents a significant structural shift, as price surged from around $1.00 and decisively broke above the upper descending trendline as well as the 100-day and 200-day moving averages, located around $1.15 and $1.30 levels, respectively.

The breakout pushed XRP to a local high with a long wick near $1.70 before the price retraced sharply. XRP is currently trading around $1.41, meaning the initial breakout impulse has already undergone a meaningful correction.

The main resistance is now concentrated between $1.45 and $1.55. This zone previously acted as a major supply area and has once again capped the recovery. A daily close above $1.55 would strengthen the bullish case and could open the way toward the larger $1.85-$1.90 resistance zone.

On the downside, the 100-day and 200-day moving averages are the dynamic support levels to watch. Holding above them would keep the bullish reversal thesis intact.

Momentum has also improved dramatically. The RSI surged above 75 during the breakout, entering overbought territory, but has since pulled back toward the mid-70s. This cooling is not necessarily bearish by itself, as it could simply indicate that the market is digesting the vertical rally. However, continued RSI deterioration while XRP remains below $1.50 would increase the risk of a deeper retracement.

The BTC Pair

The XRP/BTC chart provides an important additional perspective. XRP also broke sharply higher against Bitcoin after spending months inside a descending channel. The move briefly lifted the pair from roughly 1,500 sats to above 2,000 sats, although a substantial portion of that advance has already been retraced.

The immediate resistance is still around 2,000 sats, where horizontal supply and the upper boundary of the descending channel converge. A sustained breakout above this region would indicate that XRP is beginning to outperform Bitcoin on a more structural basis, which could lead to a structural rally for Ripple in the coming months.

However, as already mentioned, the recent spike above roughly 2,000 sats was rejected, producing a long upper wick and subsequent weakness. The pair has subsequently fallen back below its 200-day moving average, which is located just above 1,800 sats.

This makes the current area important, as holding around 1,700 sats and above the 100-day moving average could allow XRP/BTC to stabilize and attempt another attack on resistance, whereas losing this region would expose the deeper fair-value-gap area below 1,700 sats.

Β 

The post Ripple Price Analysis: XRP Looks Bullish Against USD but the BTC Pair Tells a Different Story appeared first on CryptoPotato.

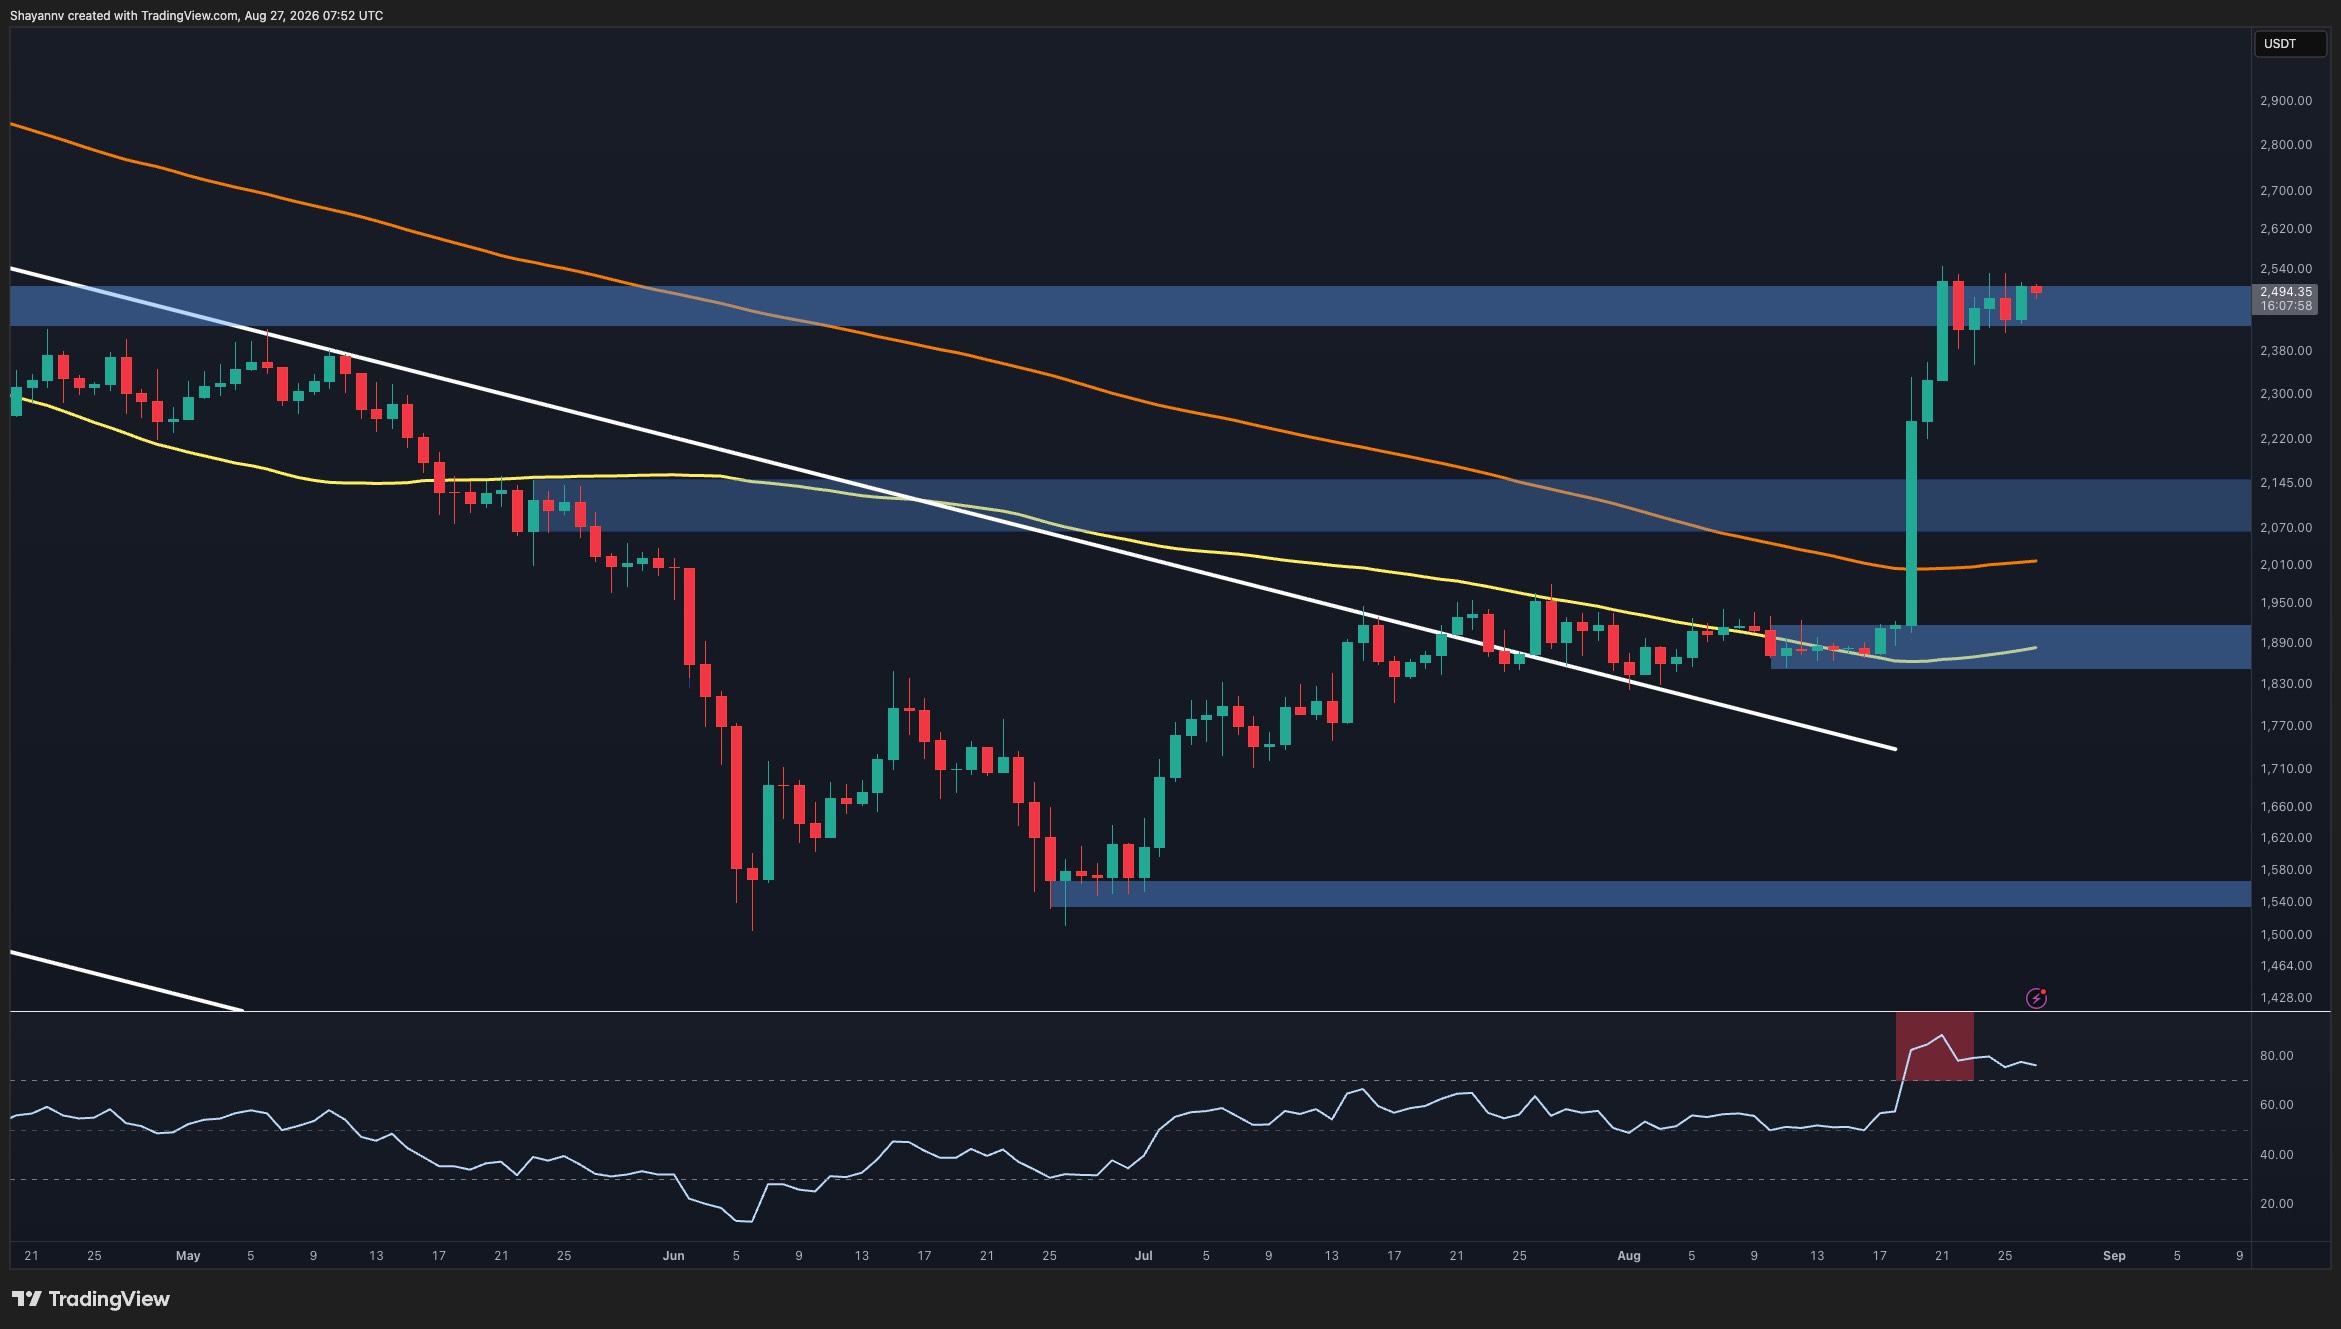
Ethereum Price Analysis: After a 35% Rally, Is ETH Ready for Another Leg Higher?

27 August 2026 at 17:48

Ethereum’s sharp breakout has significantly improved its market structure, with strong momentum carrying the price toward the $2.5K region. While bullish continuation remains possible, the increasingly extended move leaves ETH vulnerable to a temporary pullback or sideways consolidation if supply begins to increase.

Ethereum Price Analysis: The Daily Chart

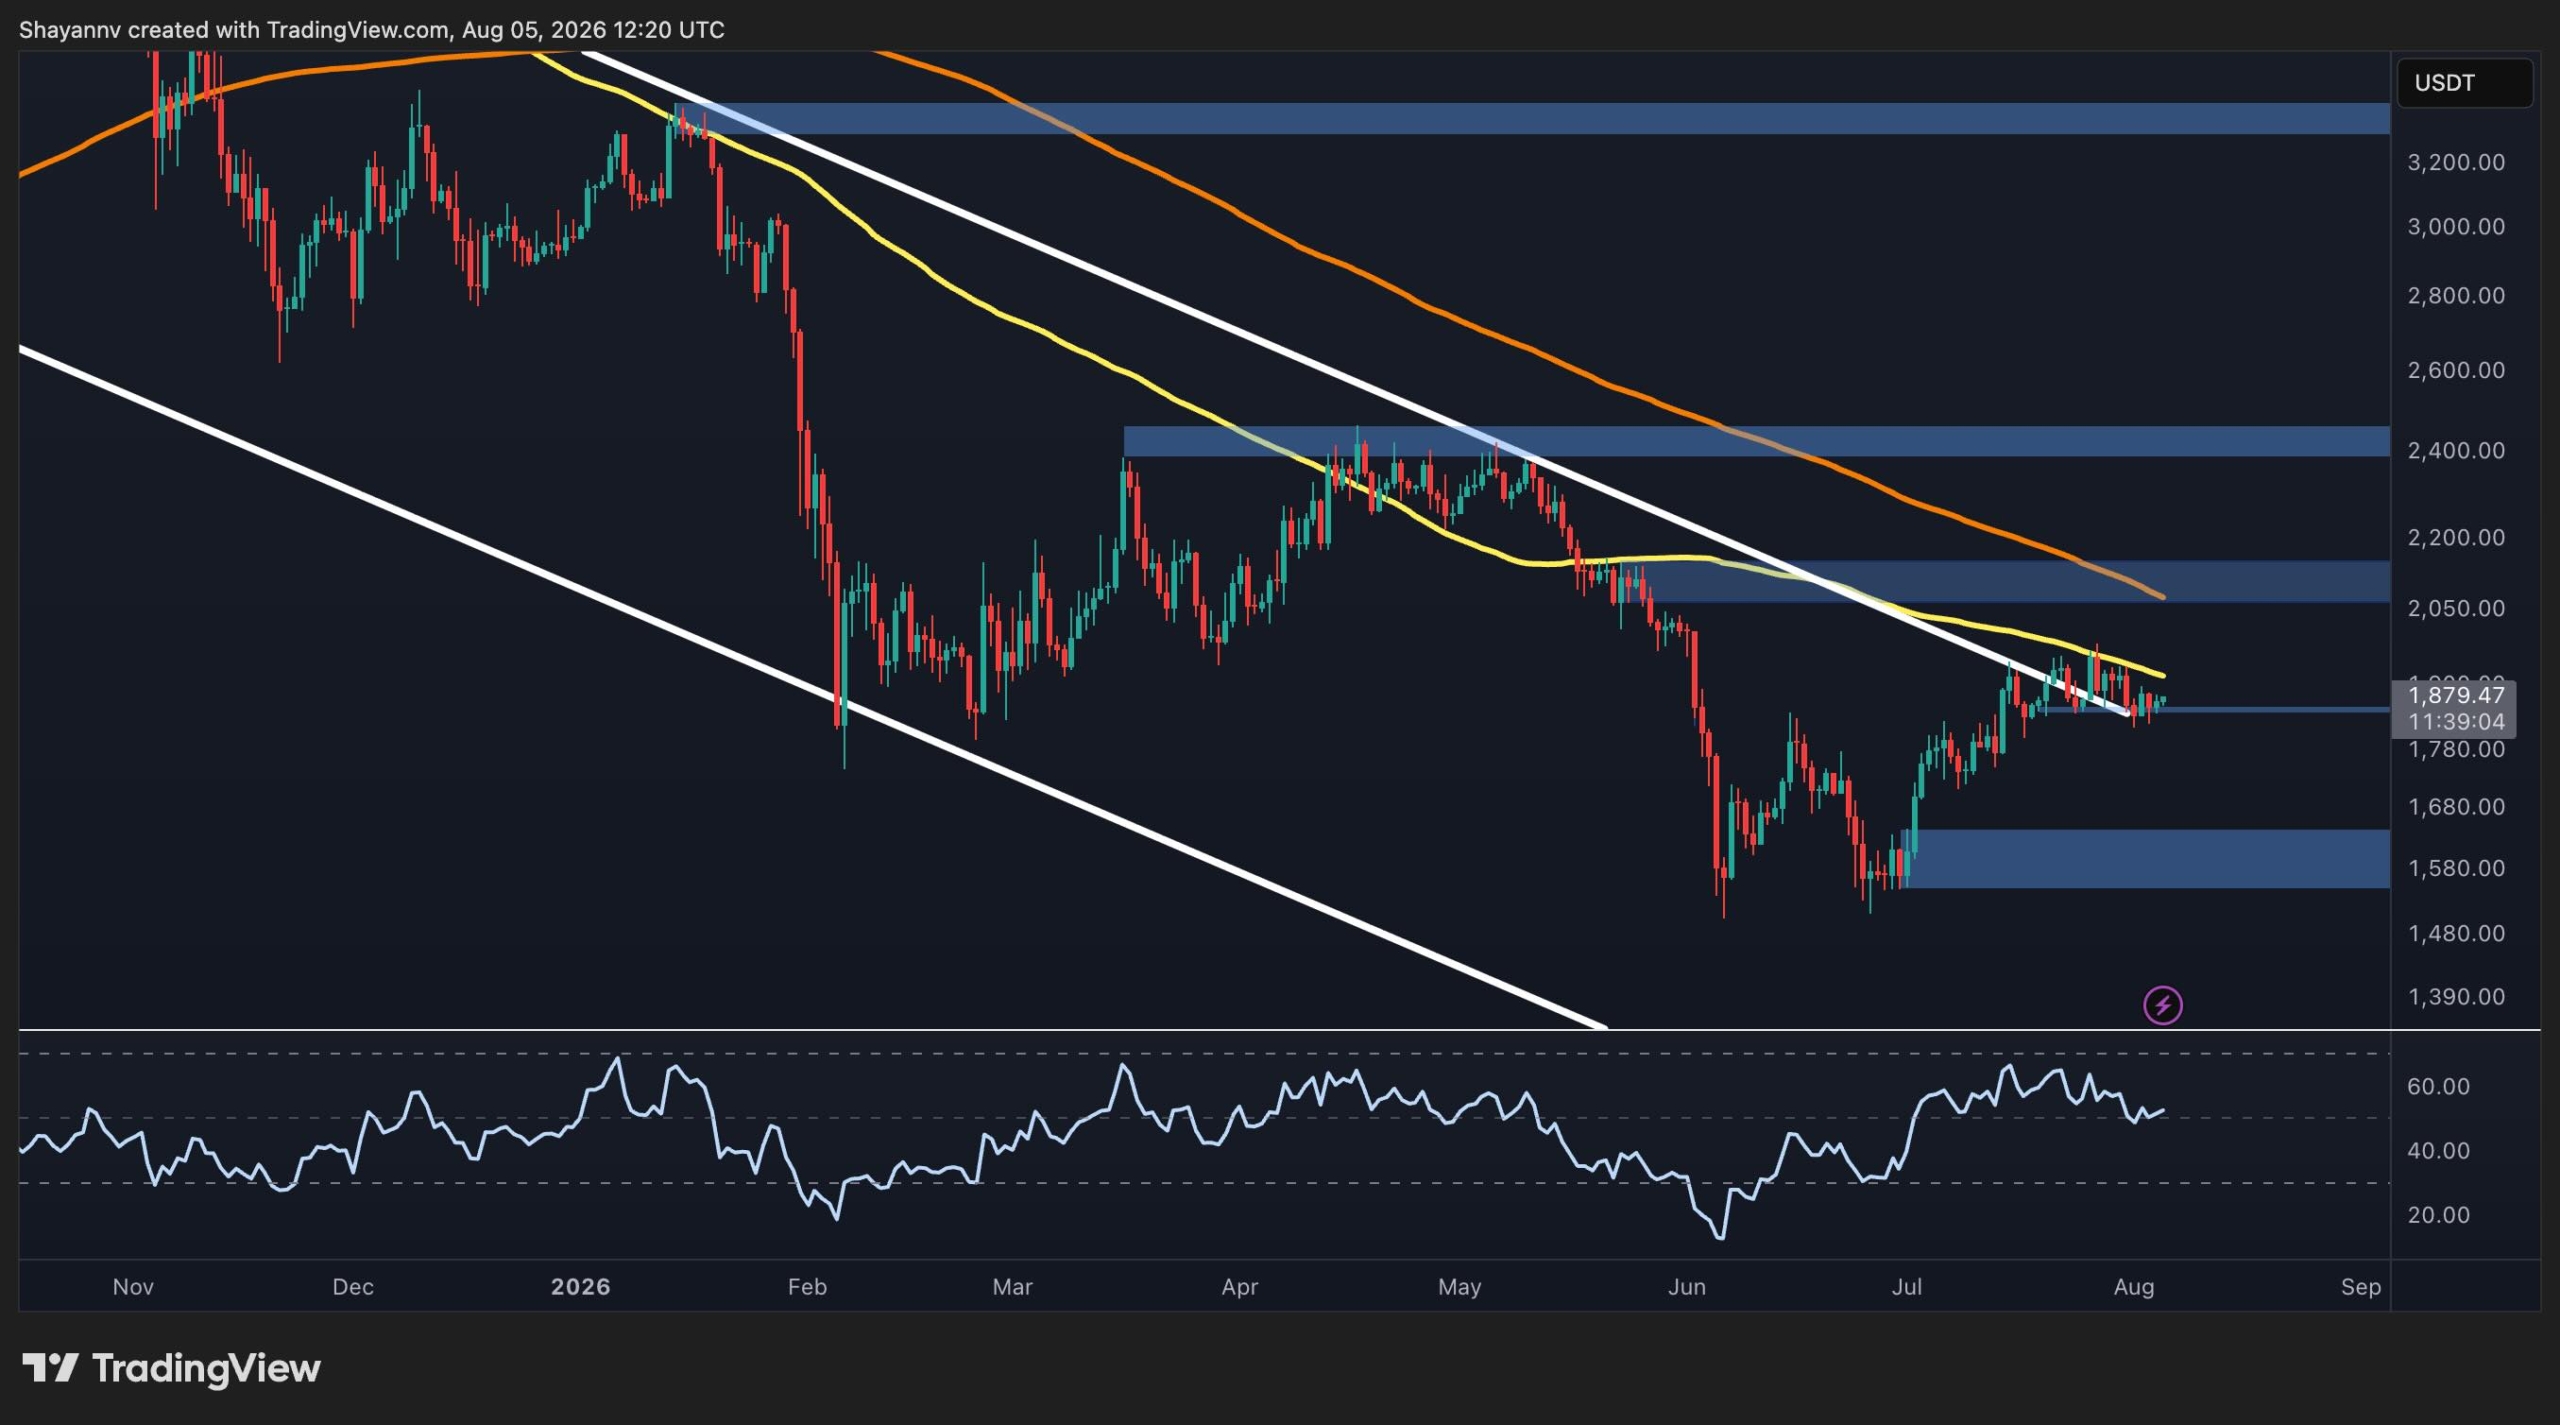
On the daily timeframe, Ethereum has decisively broken out of its prolonged bearish structure. The impulsive rally from the $1.85K-$1.92K demand zone pushed the price through the descending trendline, the major moving averages, and the $2.07K-$2.15K resistance zone with considerable strength.

ETH is now trading around $2.5K and testing the major $2.4K-$2.5K resistance zone. Momentum remains firmly bullish, supporting the possibility of continuation if buyers can absorb the available supply around this area.

However, the RSI has recently entered overbought territory following the vertical advance. This does not necessarily signal an immediate reversal, but it does indicate that the market is becoming increasingly extended. If supply increases around $2.5K, ETH could enter a period of sideways consolidation or begin a corrective pullback before attempting another leg higher.

The $2.07K-$2.15K zone represents an important support area in the event of a deeper correction, while the former $1.85K-$1.92K consolidation range remains the broader structural support.

ETH/USDT 4-Hour Chart

The 4-hour chart highlights the strength of the recent expansion more clearly. Ethereum surged almost vertically from around $1.9K and has since begun consolidating inside the $2.43K-$2.51K resistance zone.

Despite the lack of immediate follow-through above $2.5K, the short-term structure remains bullish. A decisive breakout and acceptance above the $2.51K region could indicate that buyers remain in control and open the door to further upside.

Nevertheless, after such an aggressive rally, a retracement would be technically reasonable. The first notable pullback target is the $2.22K-$2.31K zone. If selling pressure becomes more substantial, the second support region around $2.07K-$2.12K could become relevant.

Therefore, the primary scenario remains a bullish continuation based on the strength of momentum. Yet, increasing supply around the current resistance could first produce either a temporary correction toward these pullback zones or a sideways consolidation phase that allows the market to cool down.

Sentiment Analysis

The liquidation data adds another reason to expect potentially choppy price action in the short term. Liquidity is present on both sides of Ethereum’s current price, indicating that neither buyers nor sellers have established complete control.

This balanced positioning increases the possibility of sideways consolidation accompanied by liquidity sweeps in both directions. Price could temporarily move above or below the developing range to clear leveraged positions before establishing its next sustained trend.

Combined with the technical picture, this suggests that ETH’s broader momentum remains favorable for bullish continuation, but the path higher may not be straightforward. A period of consolidation or a temporary pullback could occur first as the market absorbs supply following the recent impulsive rally.

The post Ethereum Price Analysis: After a 35% Rally, Is ETH Ready for Another Leg Higher? appeared first on CryptoPotato.

Bitcoin Price Analysis: Is BTC’s Rally in Trouble After Failing to Reclaim $80K?

26 August 2026 at 17:49

Bitcoin has staged a sharp recovery from the $60K demand zone, breaking above several major technical barriers and reclaiming the $72K-$74K area. The latest move has pushed BTC toward the $80K resistance zone, where momentum is beginning to show signs of exhaustion. At the same time, the on-chain picture has improved materially, with the average market participant taking profits again.

Bitcoin Price Analysis: The Daily Chart

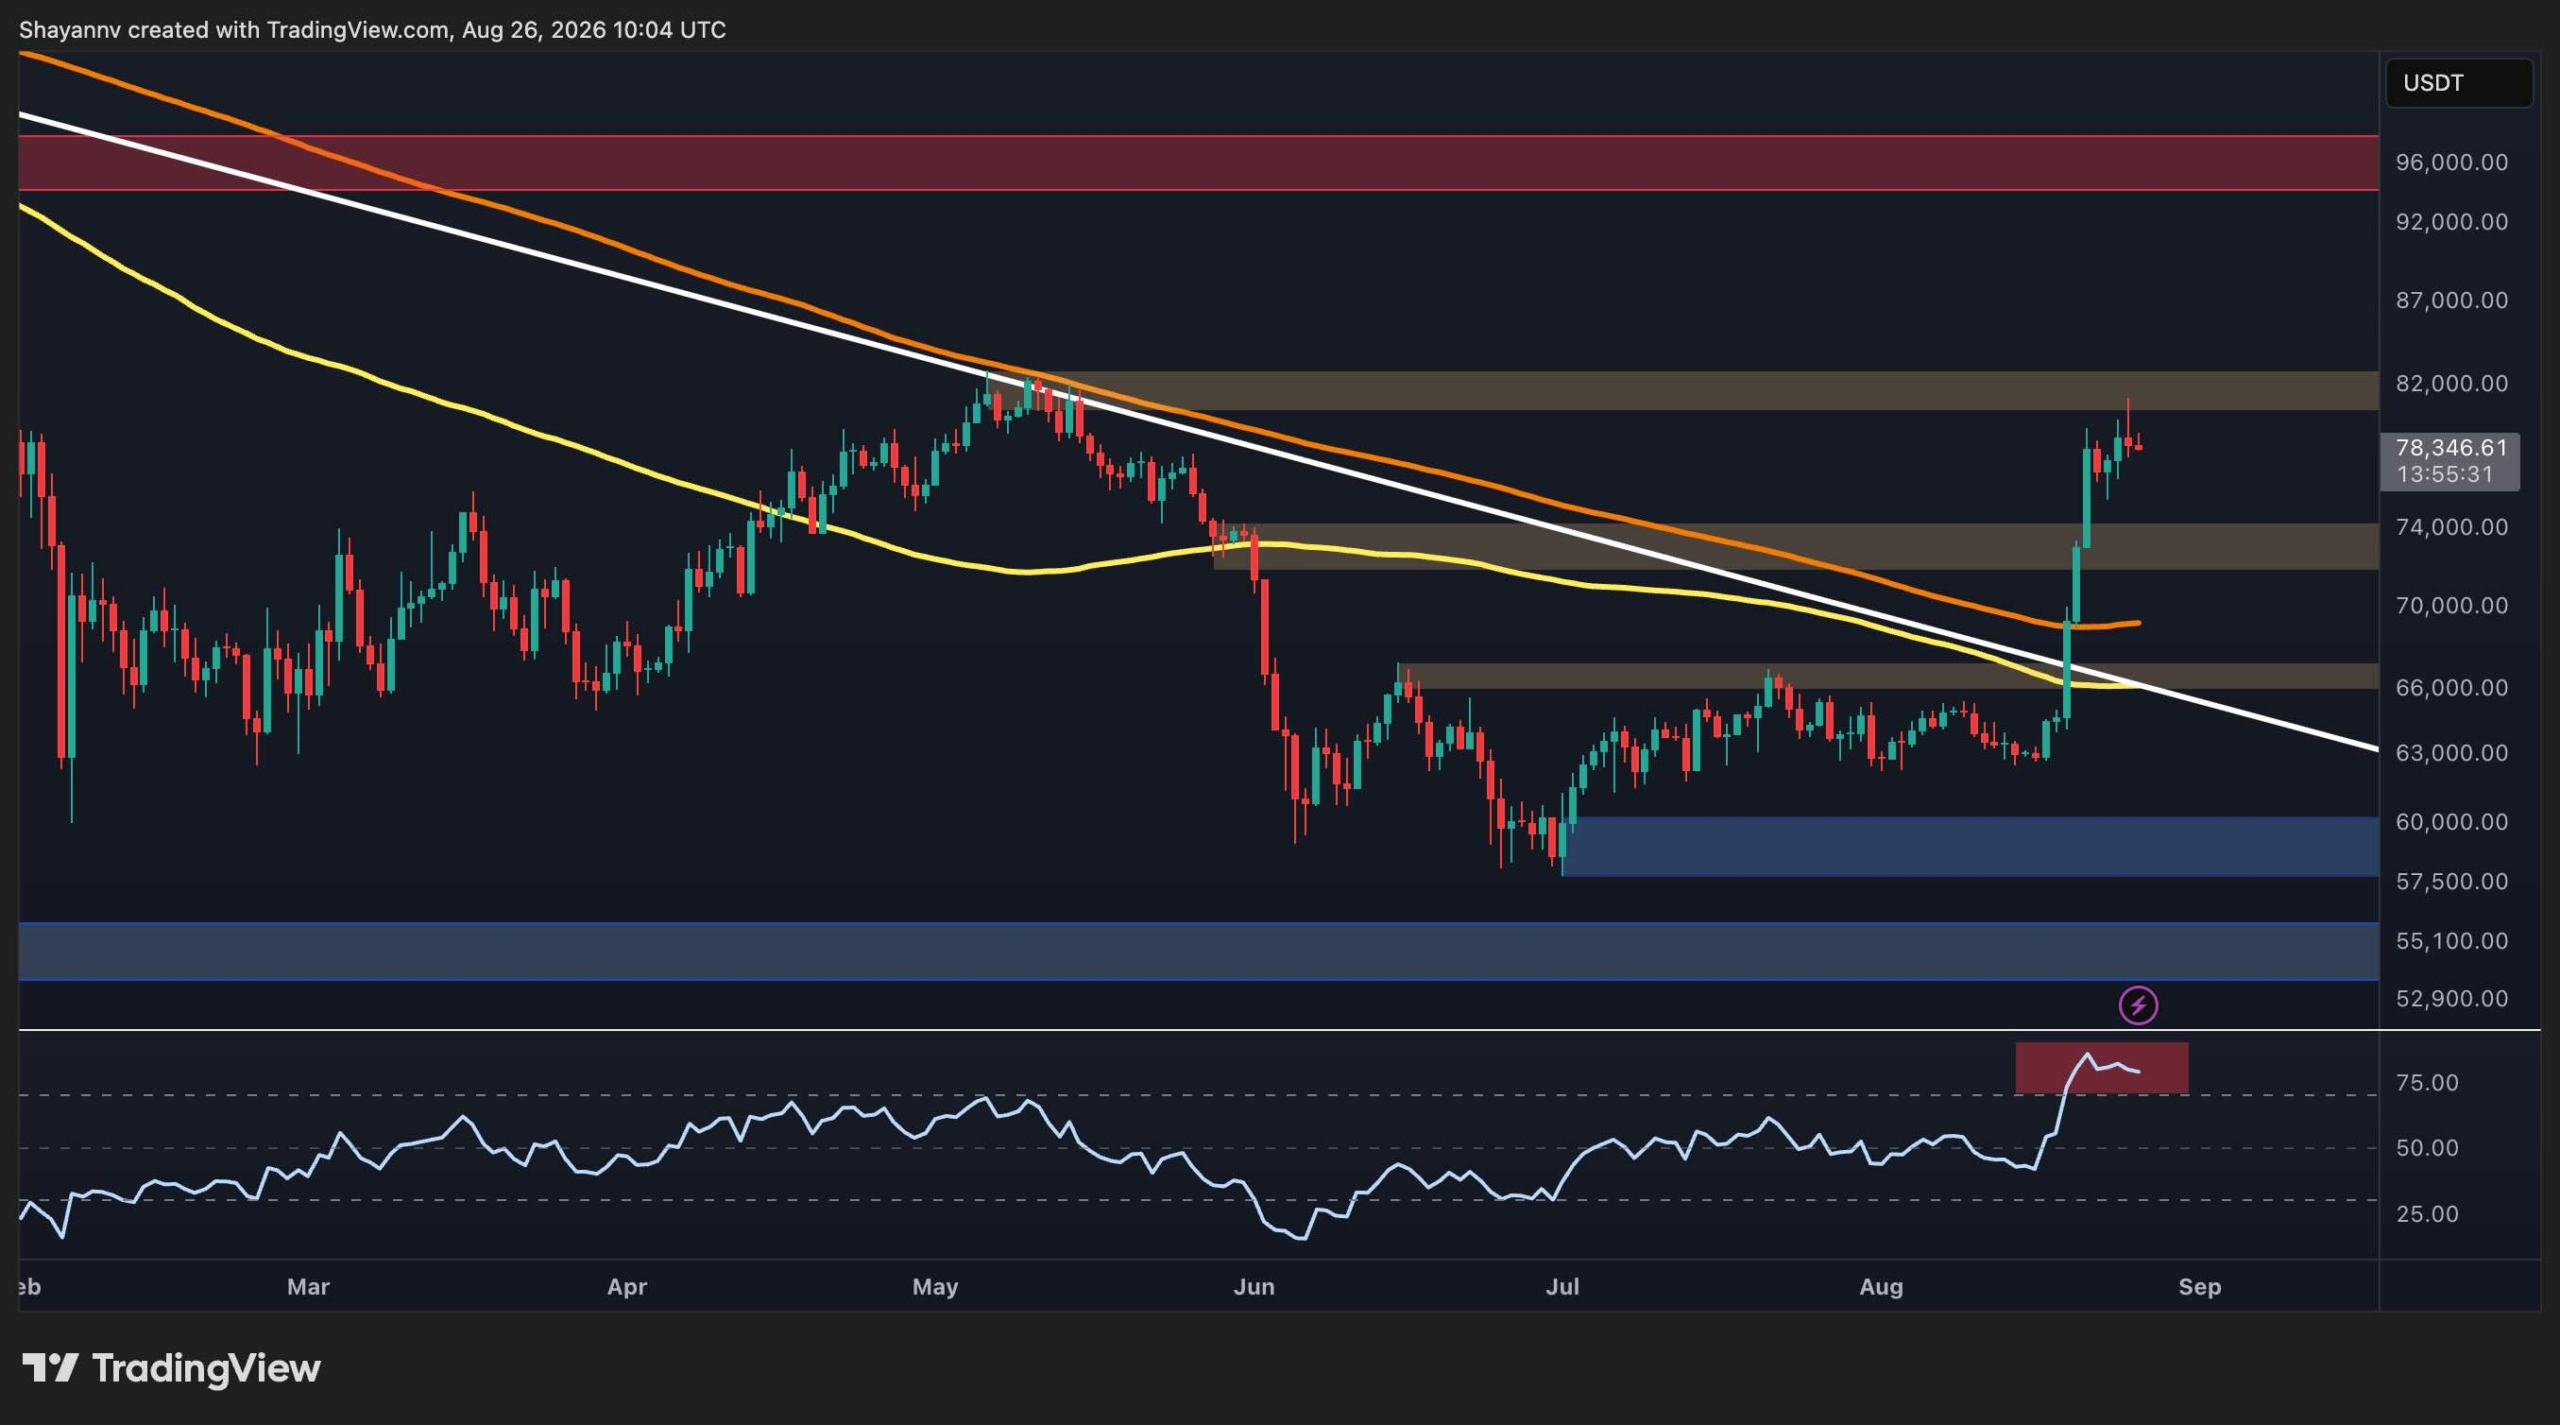
The daily chart shows a significant structural improvement. BTC spent several months consolidating below a descending trendline, with the $60K-$67K area acting as the main range. The breakout above the trendline and the $67K resistance zone was followed by an aggressive move higher, first through $72K-$74K and then toward the current $80K area.

Bitcoin is also now trading above the 100-day (~$66K) and 200-day (~$70K) moving averages shown on the chart, which have also started to flatten or turn higher. This suggests that the broader structure has shifted from consolidation toward a more constructive trend. The previous resistance around $72K-$74K could therefore become the first major support zone if the market enters a pullback.

However, the $80K-$82K region is an important obstacle. It corresponds to the upper resistance zone visible on the chart and is close to the recent local highs. A decisive daily breakout above this area would strengthen the bullish structure and could open the door toward the next major resistance around $95K.

Momentum is the main near-term concern. The daily RSI has surged into the overbought region following the vertical rally. This does not necessarily signal an imminent reversal, as strong trends can remain overbought for extended periods, but it does suggest that BTC may need to consolidate or retrace before attempting another sustained leg higher.

BTC/USDT 4-Hour Chart

The 4-hour chart provides a clearer picture of the recent breakout. BTC spent most of July and August inside a broad contracting structure, bounded by a descending upper trendline and a gradually rising lower boundary. The eventual breakout around $66K was decisive, producing a near-vertical advance through the $72K-$74K resistance zone.

After reaching $80K, Bitcoin has started to consolidate below the latest high. The price is currently around $78K, while the RSI has pulled back substantially from its previous peak. There is also a visible bearish divergence, with the price making a higher high while the RSI forms a lower high. This suggests that short-term momentum is weakening even though the broader breakout structure remains bullish.

The immediate resistance is therefore the $80K zone. A clean 4-hour close above it, followed by a successful retest, would provide stronger confirmation that the breakout is continuing rather than simply producing a local relief rally.

On the downside, $72K-$74K is the key near-term support. Holding above this zone would keep the breakout structure intact. If BTC loses it, the next important area is around $64K, which was the original consolidation zone and should now act as a major test of whether the overall trend reversal is genuine.

On-Chain Analysis

The adjusted SOPR chart provides an encouraging confirmation of the recent price recovery. Adjusted SOPR measures whether spent Bitcoin is, on average, being realized at a profit or a loss. The 1.0 level is particularly important: readings above 1 indicate that coins are generally being spent at a profit, while readings below 1 indicate that losses dominate.

The metric spent a prolonged period below 1 during Bitcoin’s previous correction, reflecting persistent loss realization. More recently, aSOPR has rebounded sharply, and its 30-day EMA has also turned higher and moved above the 1.0 threshold.

This is an important improvement because it suggests that profitable spending has returned alongside the price recovery. Historically, a sustained move above 1 can support a transition toward a healthier bullish market structure, particularly when the metric’s trend is also rising.

That said, the latest jump is quite steep, meaning some short-term cooling would not necessarily invalidate the broader signal. If aSOPR remains above 1 during any BTC pullback, it would suggest that holders are still realizing profits rather than capitulating. Conversely, a return below 1 would weaken the bullish interpretation and could indicate that the recent recovery is losing underlying strength.

The post Bitcoin Price Analysis: Is BTC’s Rally in Trouble After Failing to Reclaim $80K? appeared first on CryptoPotato.

Ethereum Price Analysis: What Are ETH’s Key Levels After the Breakout?

25 August 2026 at 19:35

Ethereum has staged a decisive breakout from the multi-week consolidation structure, with ETH now trading just below $2.5K after reclaiming several important resistance levels. The move has significantly improved the higher-timeframe structure, although momentum has become stretched and ETH is currently testing a major resistance zone.

Ethereum Price Analysis: The Daily Chart

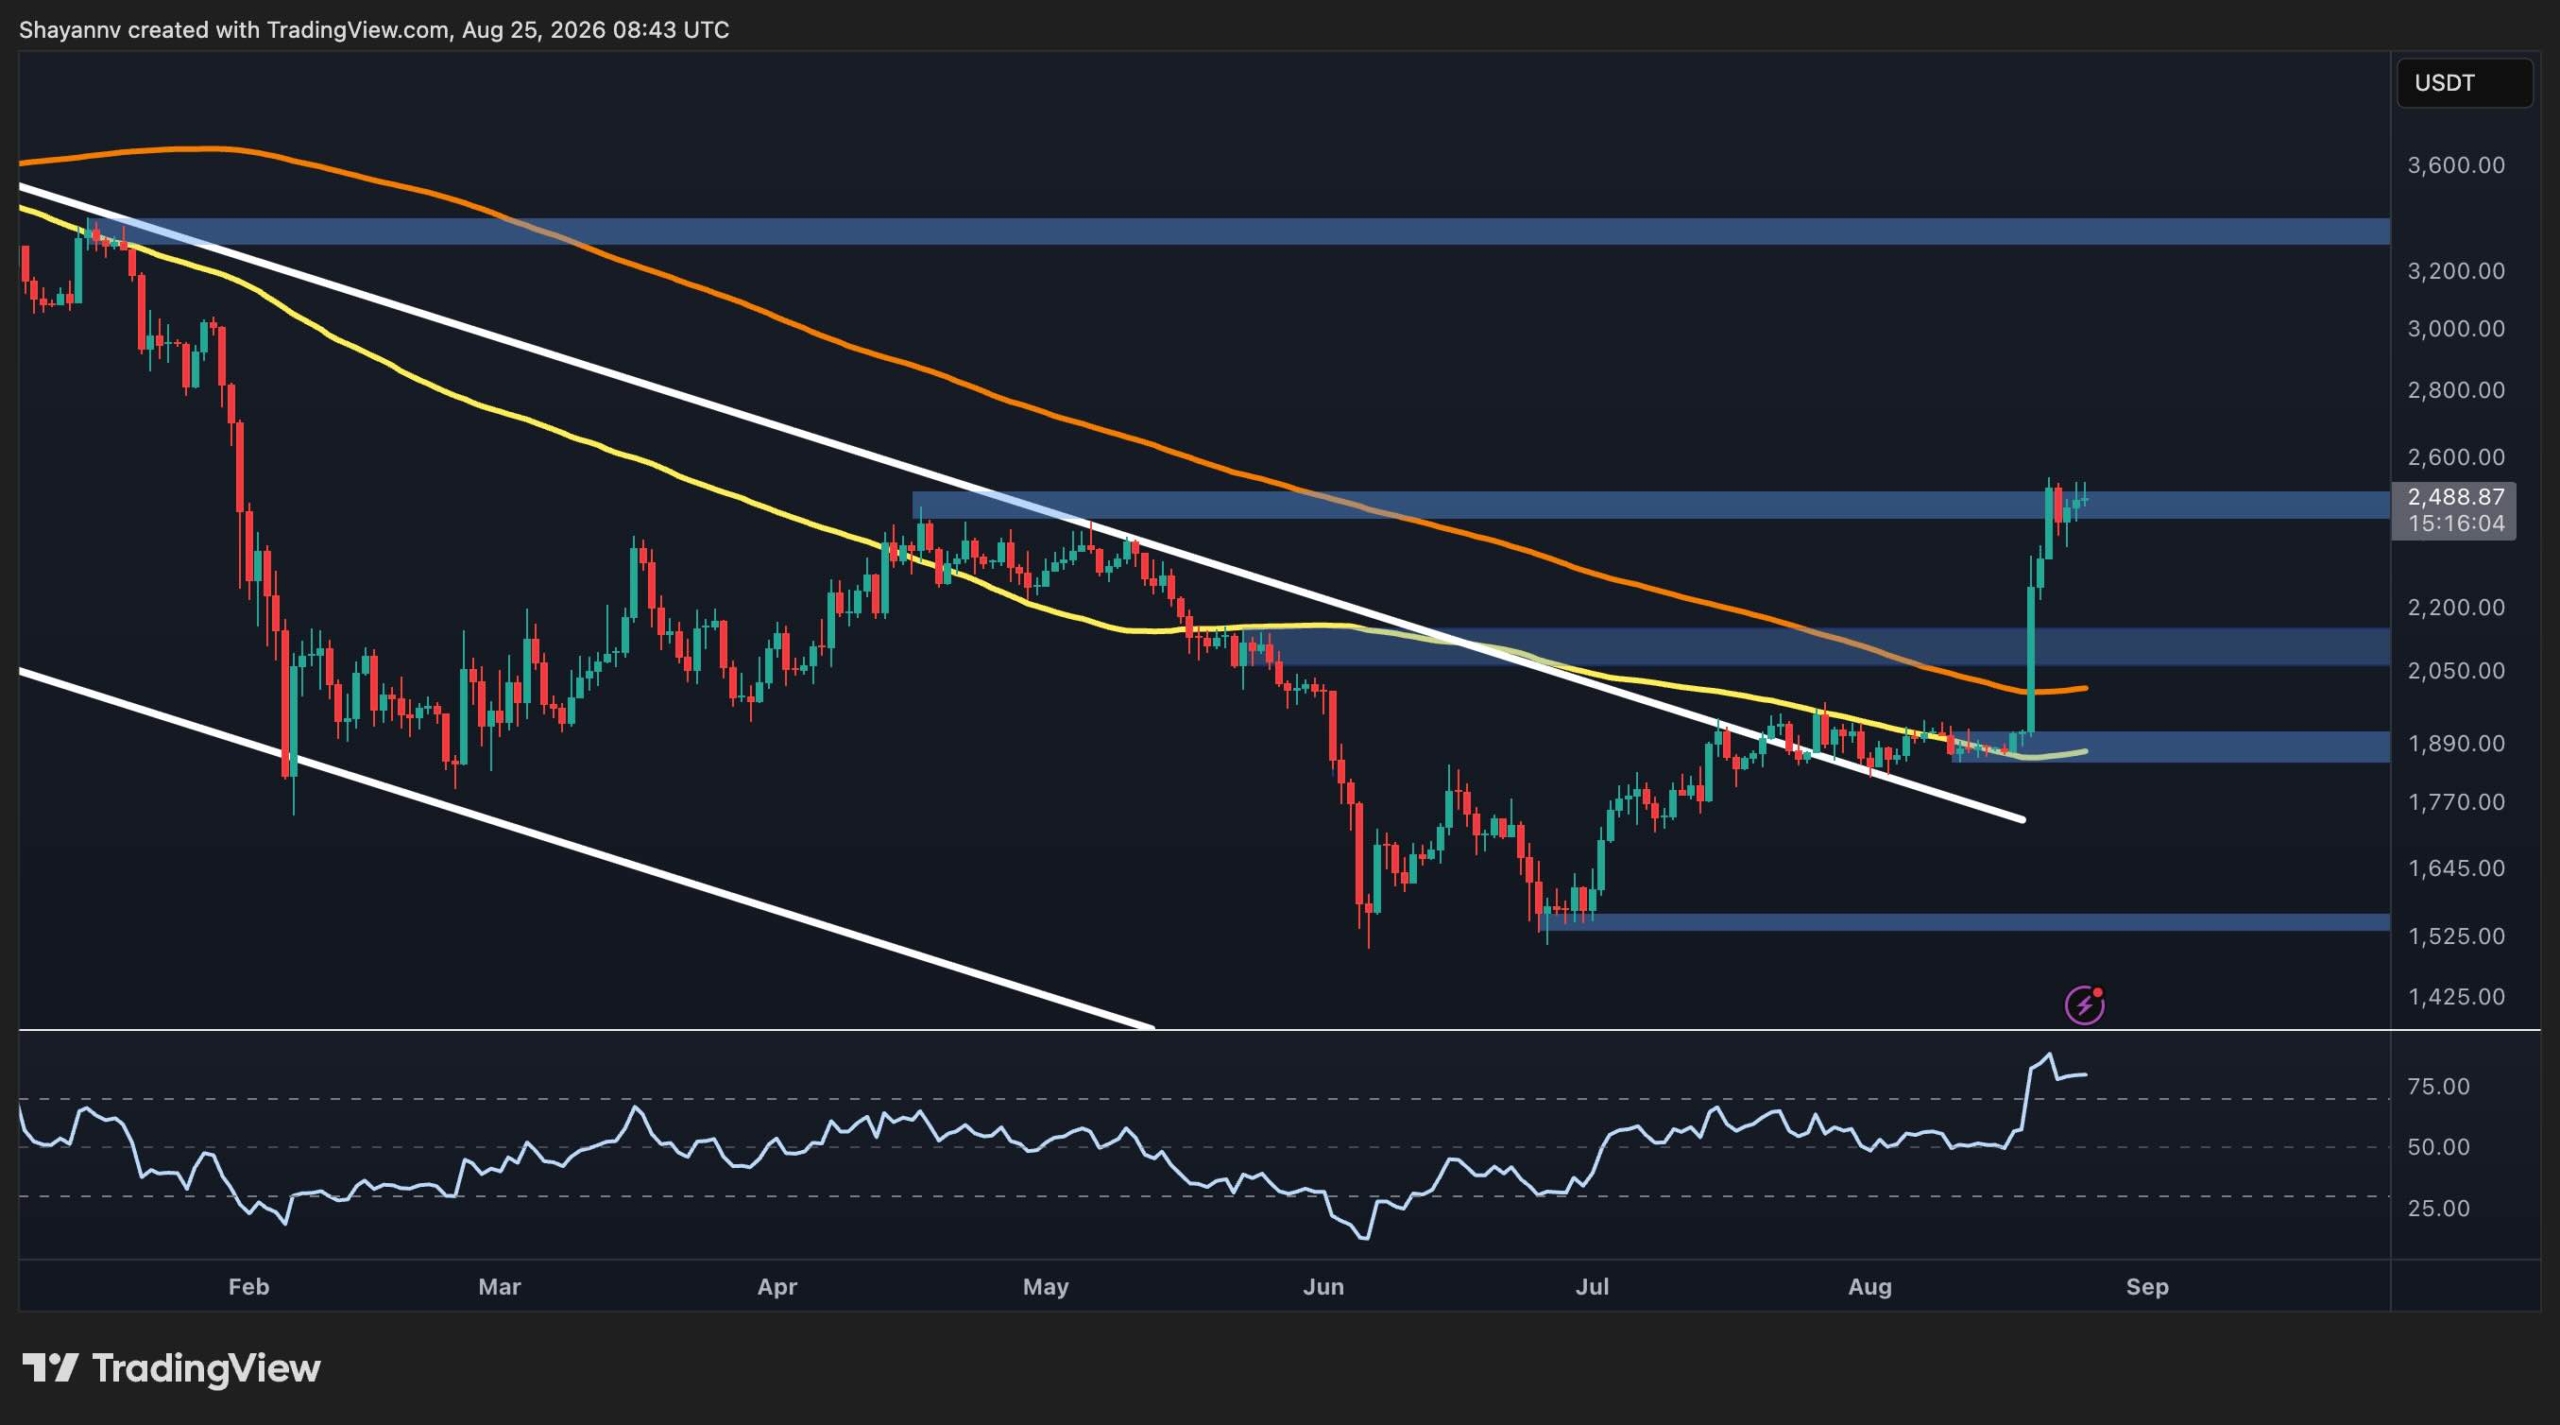
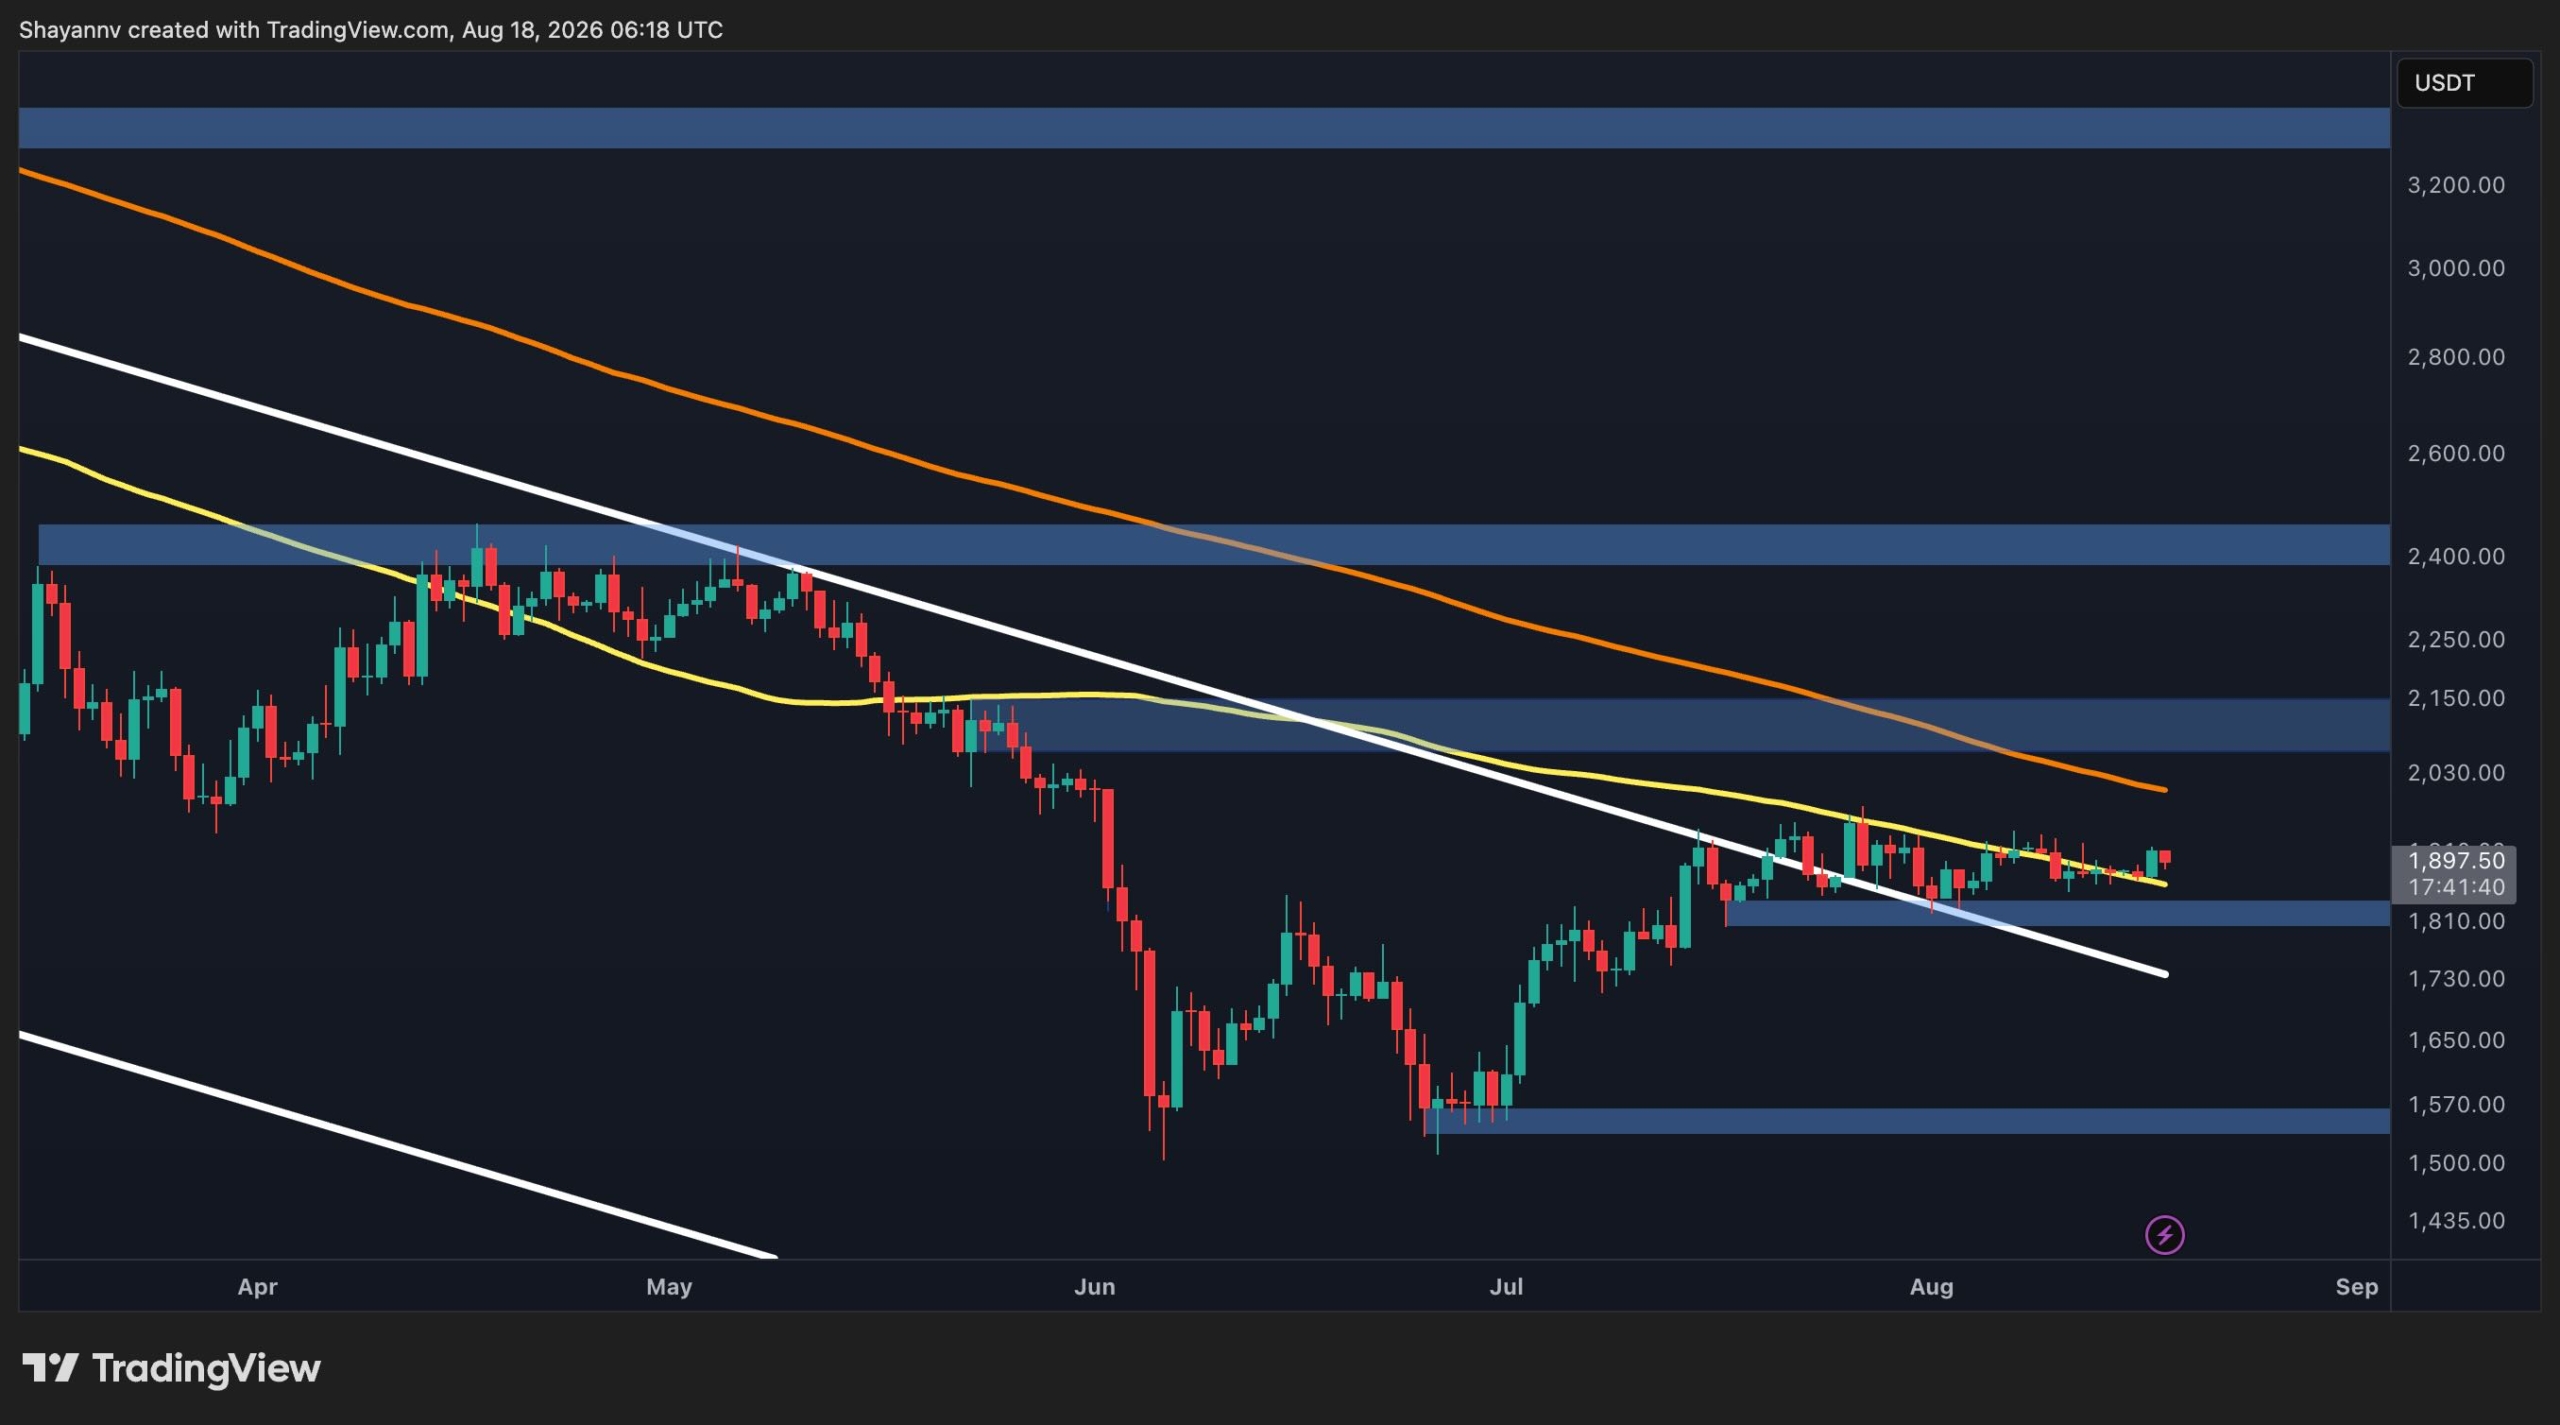
The daily chart shows a clear structural improvement. ETH spent much of the summer consolidating between roughly $1.5K and $2K while remaining inside a descending channel. The recent breakout above the upper trendline, the $2.1K resistance zone, and the 100-day and 200-day moving averages represent an important shift in market structure.

The breakout was followed by an exceptionally strong impulsive move toward the $2.5K area. ETH is now trading around $2.49K and testing the major resistance zone extending approximately from $2.45K to $2.5K. This area is particularly important because it has previously acted as a major resistance and is currently being tested after a steep vertical advance. A sustained daily breakout above $2.5K would strengthen the bullish case and could expose the next major resistance region around $3.3K.

On the downside, the former $2.1K resistance area has become the first major support zone. A deeper correction could bring ETH toward the $1.9K region, which previously served as an important consolidation area. The lower $1.5K zone remains the major structural support visible on the chart, although a move there would represent a substantial deterioration from the current setup.

ETH/USDT 4-Hour Chart

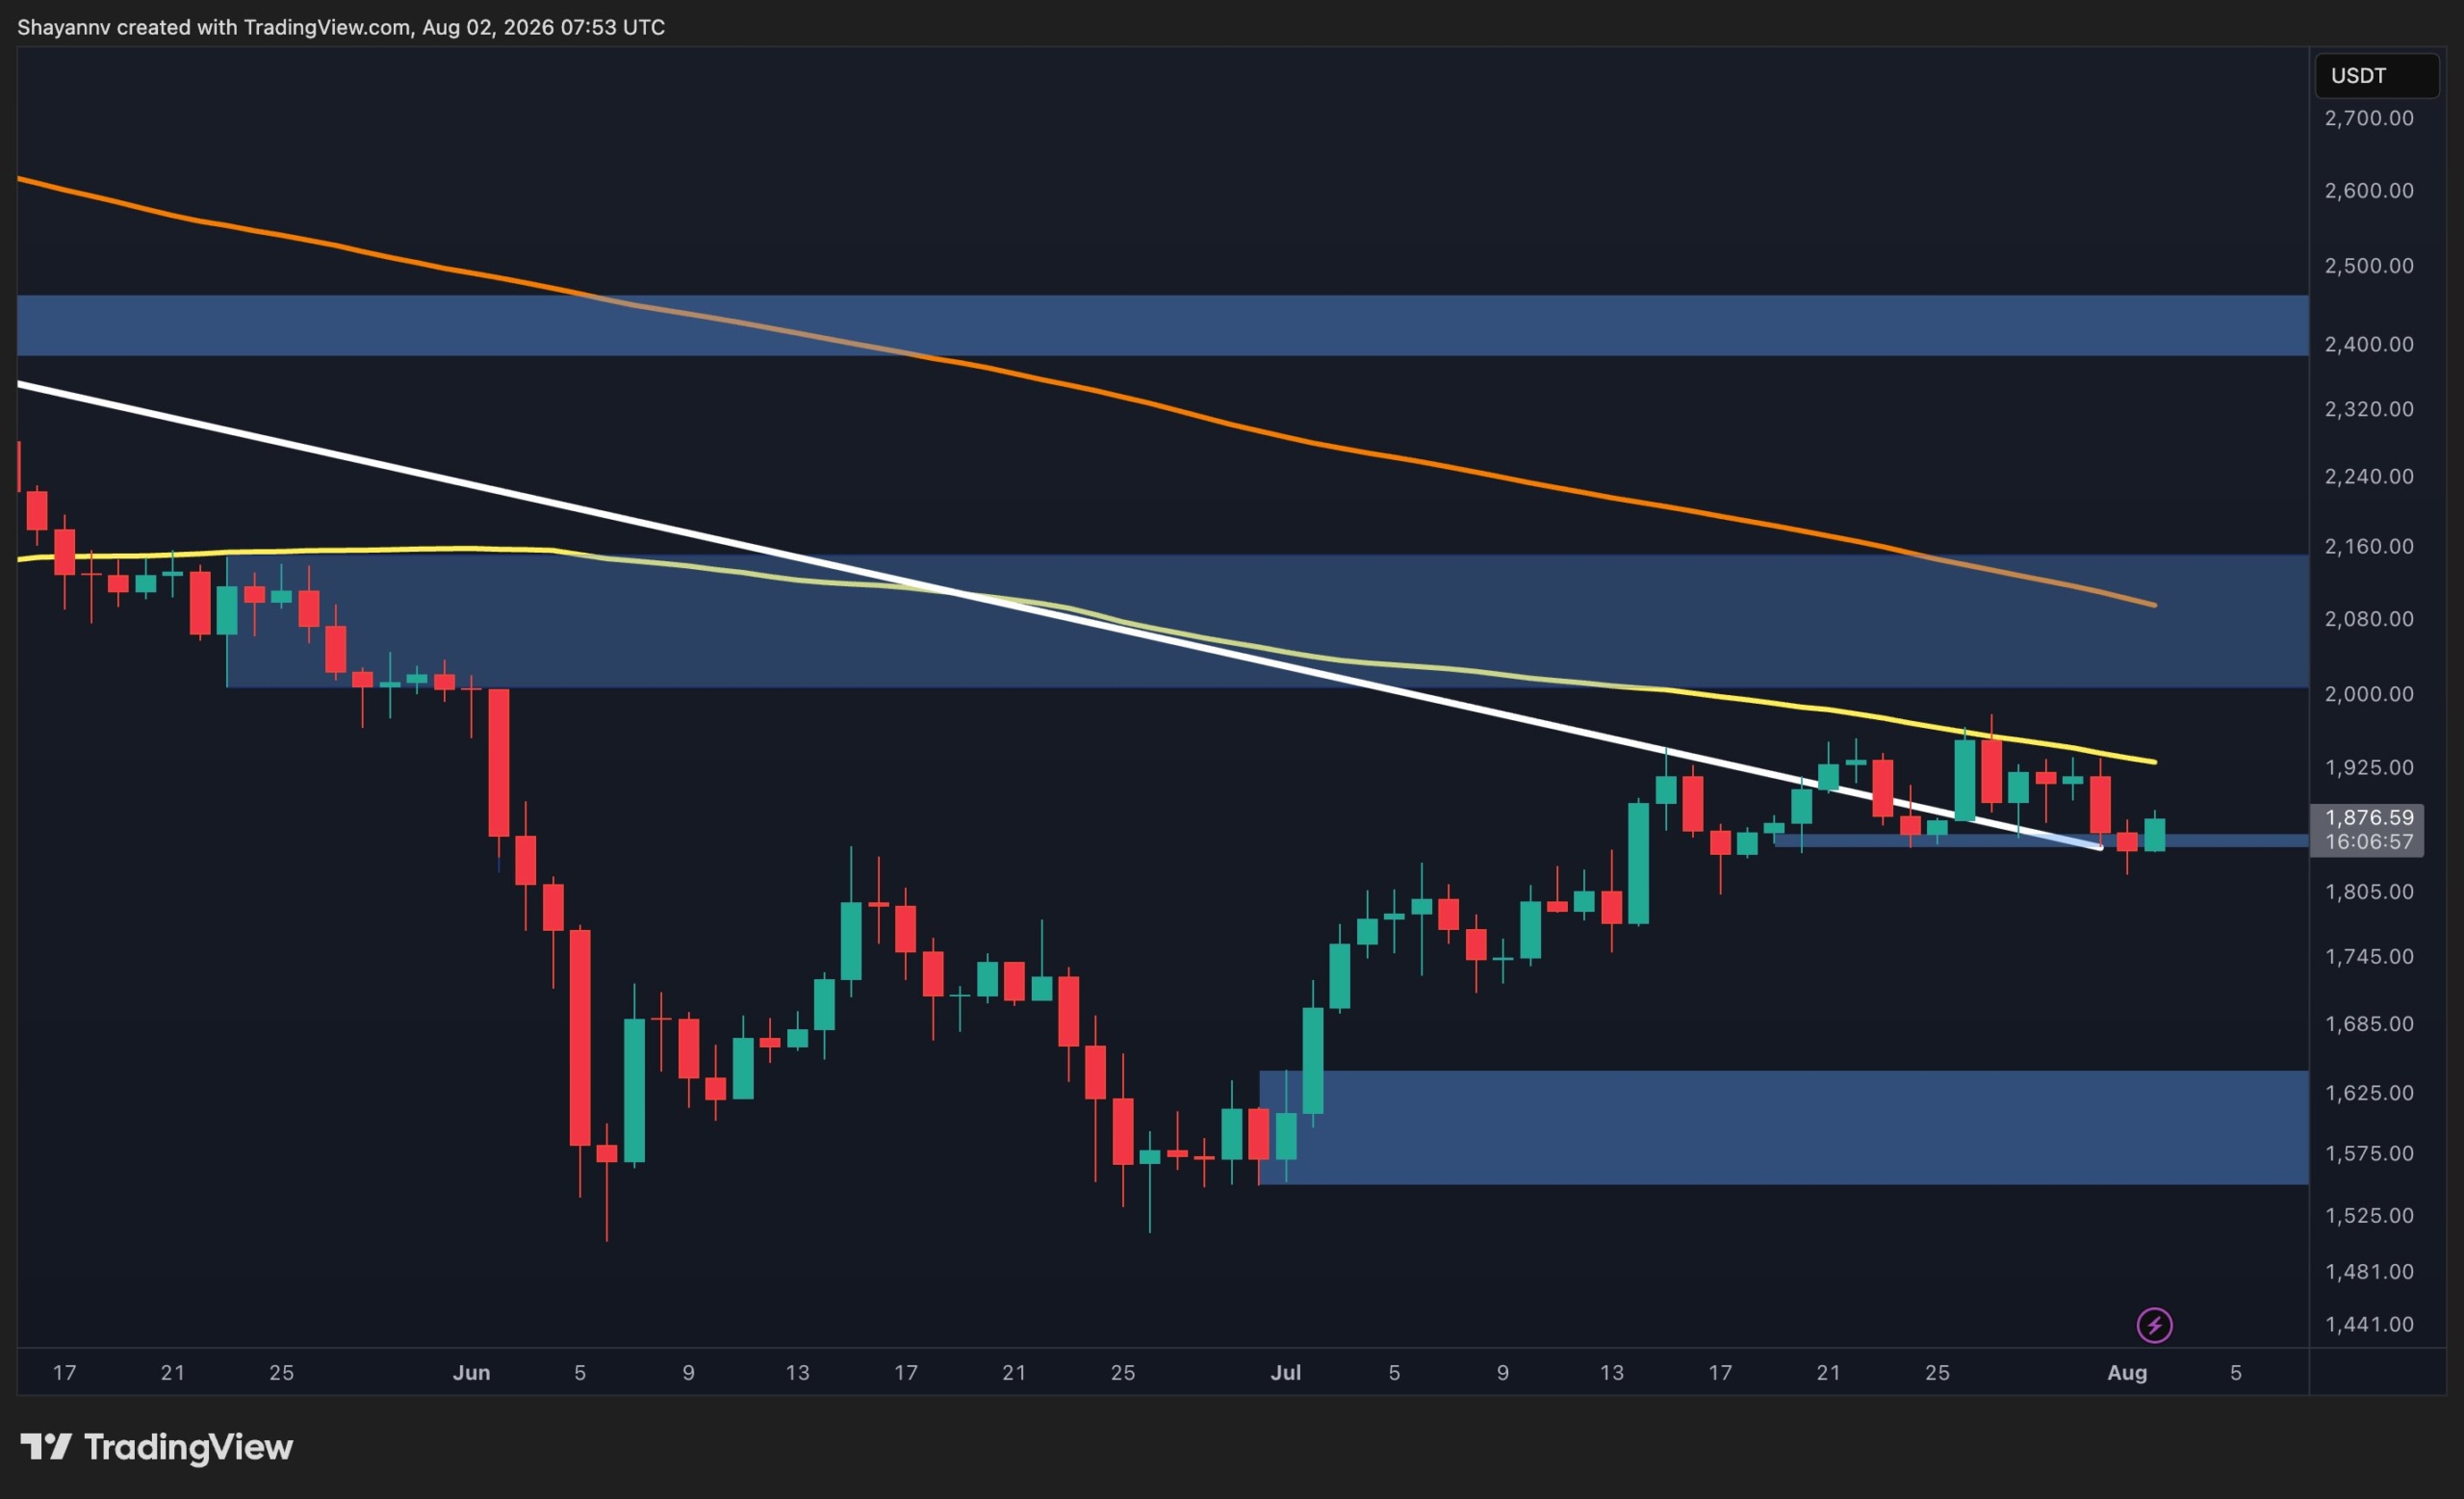
The 4-hour chart provides a clearer picture of the breakout itself. ETH had been moving sideways around the $1.85K-$1.9K area while gradually pressing against the rising trendline near $2K. The eventual breakout produced a very strong expansion in price, taking ETH through the $2.1K zone and then toward $2.5K.

The former consolidation around $1.85K-$1.9K is now the most obvious lower support area. Above it, the $2.1K zone should be considered the primary breakout-support region. As long as ETH remains comfortably above this area, the 4-hour structure remains strongly bullish.

Momentum, however, has cooled considerably from the initial breakout. The 4-hour RSI pushed into extremely overbought territory during the vertical advance before falling back toward 70. This is generally healthier than maintaining an RSI near extreme levels, but it also means that ETH could spend more time consolidating before attempting another breakout.

Overall, the bullish setup would become less convincing if ETH fails to reclaim the $2.5K area. In that case, a retracement toward $2.1K would appear increasingly likely. A deeper loss of that region would shift attention back toward the $1.85K-$1.9K breakout base.

Sentiment Analysis

The Ethereum Coinbase Premium Index adds an important nuance to the rally. The metric has remained predominantly negative through much of the recent price recovery, indicating that ETH’s advance was not accompanied by consistently strong US-based spot demand. The premium recently recovered sharply from deeply negative readings and is now approaching the neutral line, while ETH trades around $2.4K-$2.5K.

This improvement is constructive because the deterioration in the Coinbase Premium appears to be reversing as the price pushes higher. However, the index has not clearly moved into sustained positive territory on the provided chart. Therefore, the current rally does not yet show the strongest confirmation of aggressive US spot-market buying.

If the Coinbase Premium turns decisively positive while ETH holds above $2.4K-$2.5K, it would provide additional confirmation for a continuation of the breakout. Conversely, renewed deterioration in the premium alongside rejection from the current resistance zone could increase the probability of a short-term correction.

The post Ethereum Price Analysis: What Are ETH’s Key Levels After the Breakout? appeared first on CryptoPotato.

Ripple Price Analysis: Has XRP Run Out of Steam After the $1.70 Rejection?

25 August 2026 at 19:20

XRP has staged a sharp recovery from the $1.00 area, breaking above its long-standing descending structures on both the USD and BTC charts. However, the rally has now reached major resistance, making the current levels critical for the next directional move.

Ripple Price Analysis: The USDT Pair

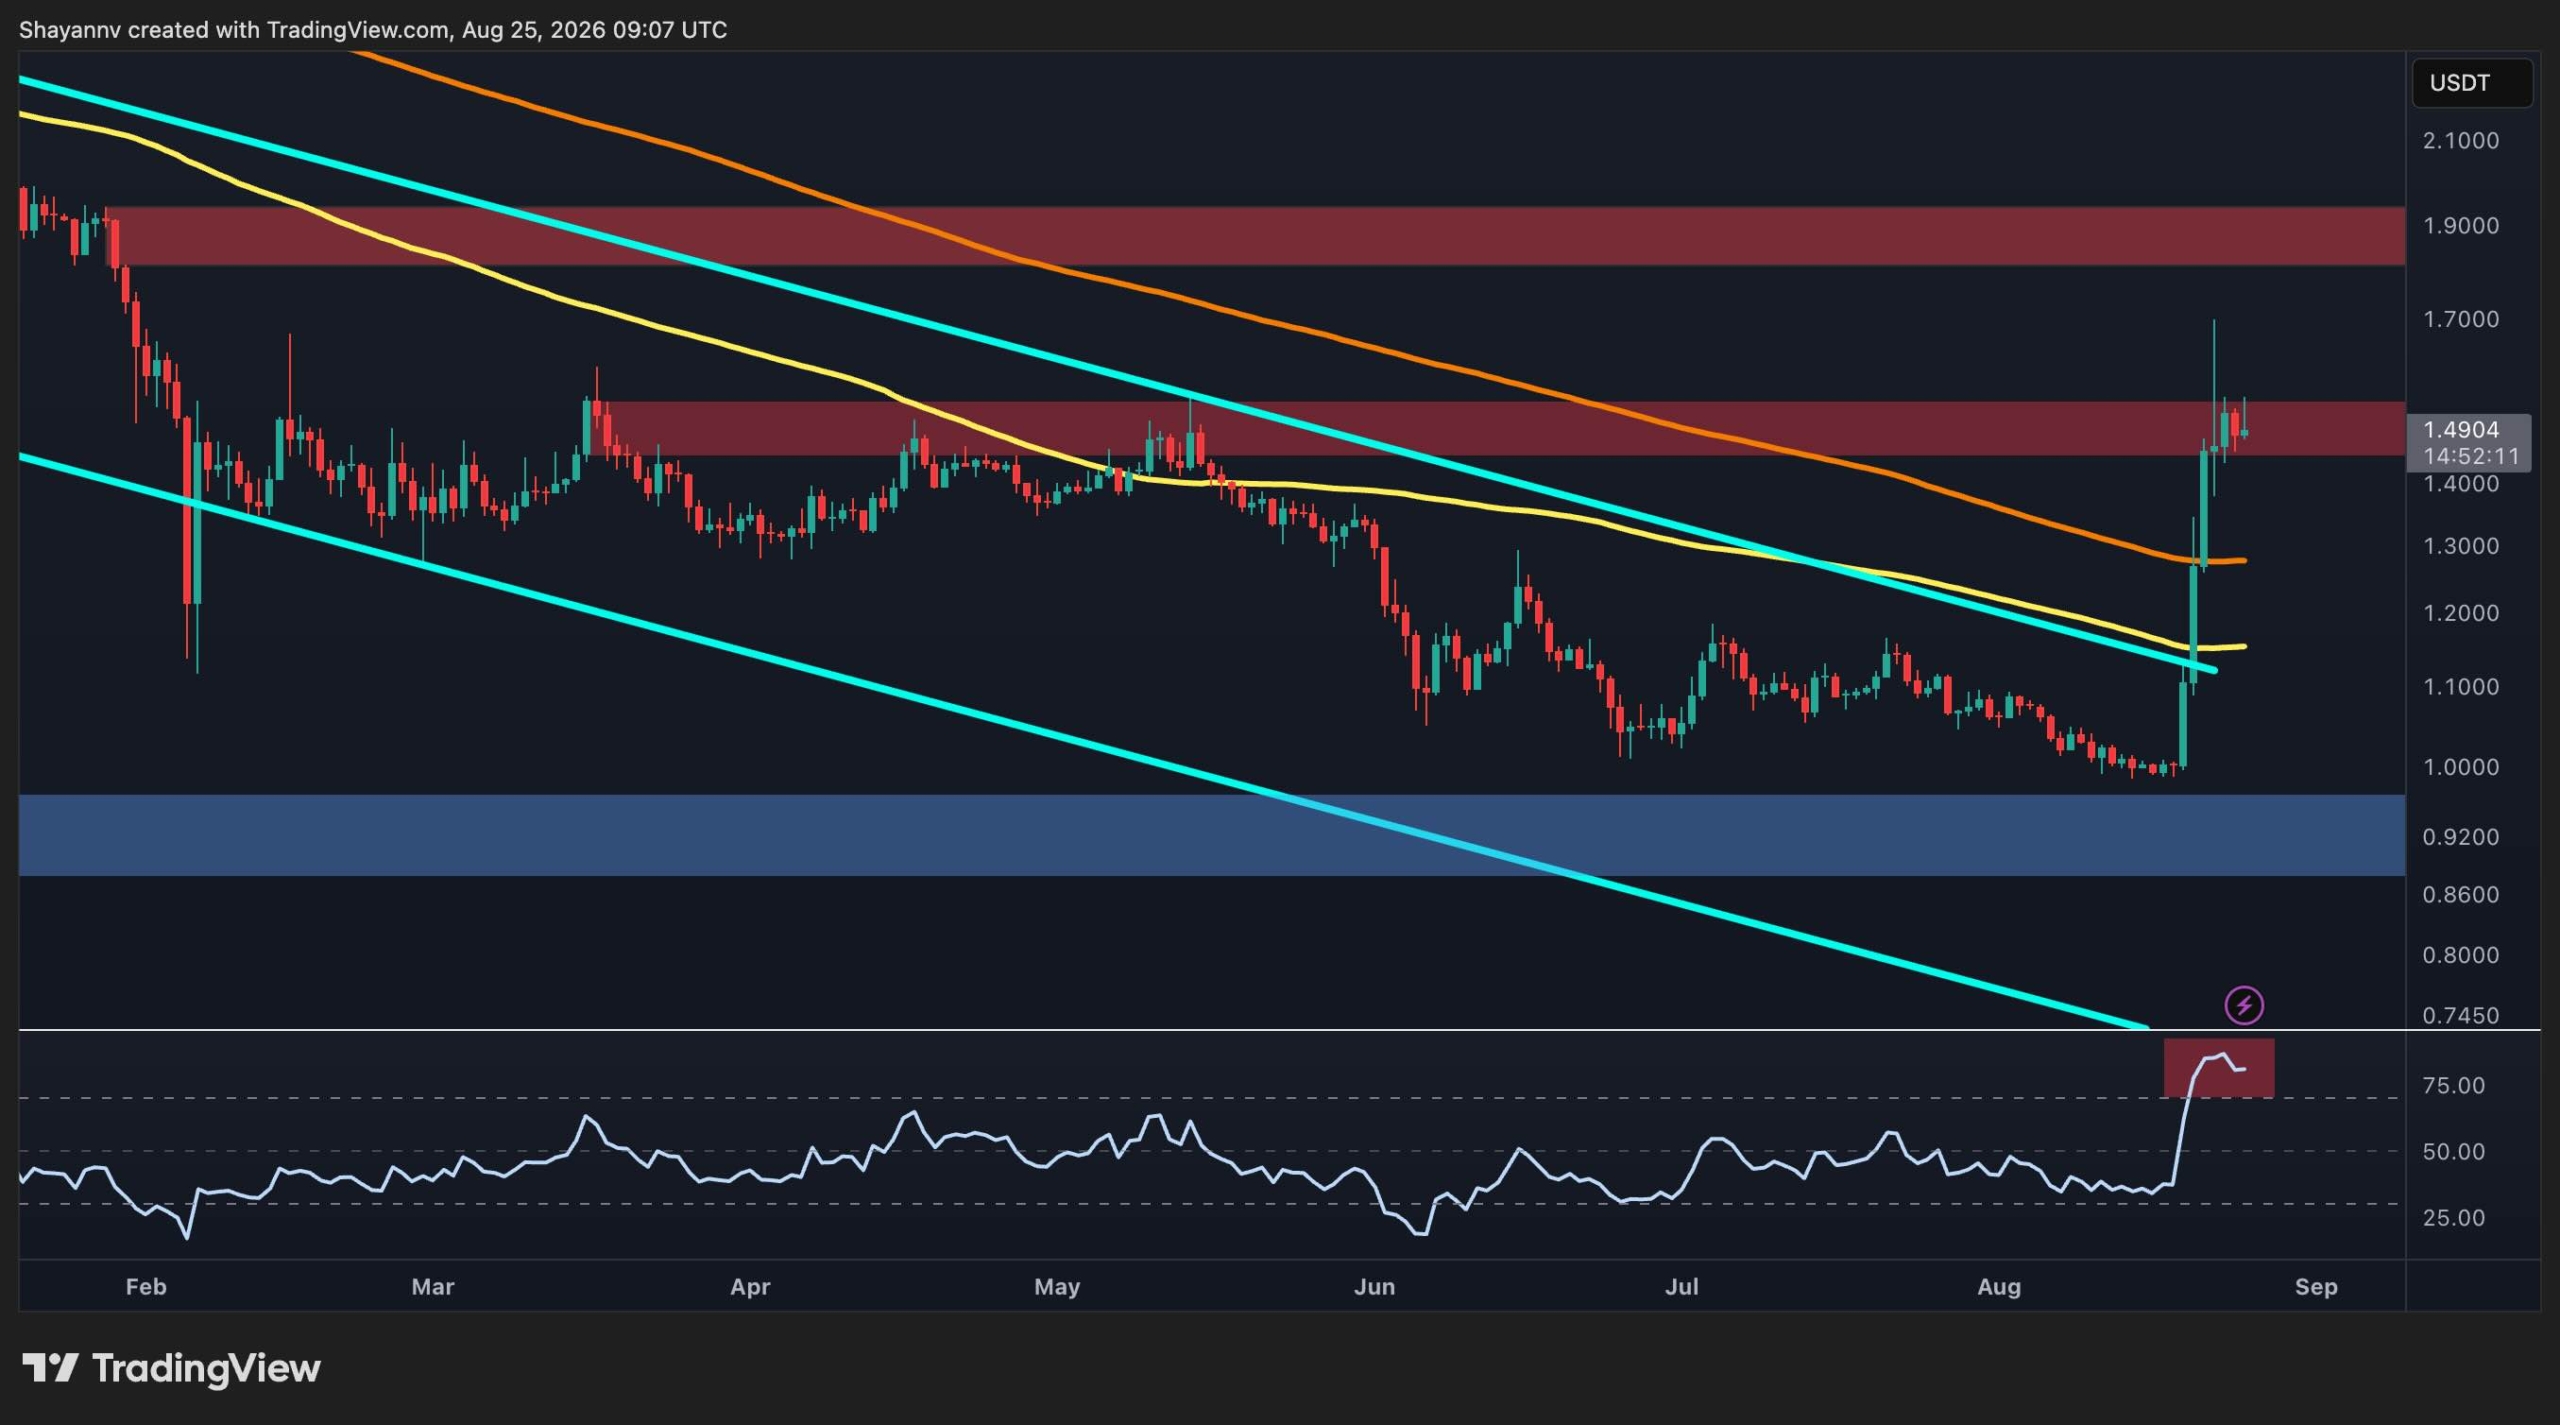
The asset broke above its broad descending channel after finding support around $1.00. It has since reclaimed the 100-day and 200-day moving averages, located around $1.2 and $1.3, respectively. The move above $1.3 has turned both of these former resistance elements into near-term support.

The rally is now testing the critical $1.50 resistance zone, where the price has started to consolidate. A daily breakout above $1.50 could open the door toward the $1.80-$1.90 area. Conversely, a rejection followed by a move below $1.30 would weaken the breakout structure and raise the risk of a deeper correction, and even potentially back toward the $1 area.

The RSI has also surged above 70 and still remains extremely elevated in the overbought region. This highlights strong momentum but also leaves room for a short-term cooldown, which could lead to a retest of the 200-day moving average.

The BTC Pair

On the XRP/BTC daily chart, it is evident that the price has attempted to break out of its broad descending channel after bottoming near 1,500 sats. However, unlike the USDT pair, the breakout has so far failed. The pair briefly pushed above the channel’s upper boundary before printing a large rejection wick, signaling that sellers remain active around this resistance.

XRP/BTC is now retracing toward the previously broken 200-day moving average, which is being tested as potential support. The reaction around this moving average could be important for the next move. If XRP/BTC manages to hold above it and establishes the former breakout area as support, another attempt at the 2,000 sats resistance zone could follow.

A successful break above 2,000 sats would strengthen the relative-strength outlook, while a decisive loss of the 200-day moving average would suggest that the recent breakout attempt was a false move and could expose the pair to further downside. The RSI has also pulled back after briefly moving above 70, reflecting the loss of momentum following the failed breakout, and indicating that a further consolidation or correction could materialize in the coming weeks.

Β 

The post Ripple Price Analysis: Has XRP Run Out of Steam After the $1.70 Rejection? appeared first on CryptoPotato.

Bitcoin Price Analysis: BTC Surges Toward $80K Again – Can It Break Through This Time?

24 August 2026 at 17:33

Bitcoin’s explosive breakout has transitioned into a period of consolidation between $77,000 and $79,000. Despite the sharp expansion from the previous range, the price is now struggling to extend higher immediately, suggesting that the market may need to digest the move before choosing its next direction.

Bitcoin Price Analysis: The Daily Chart

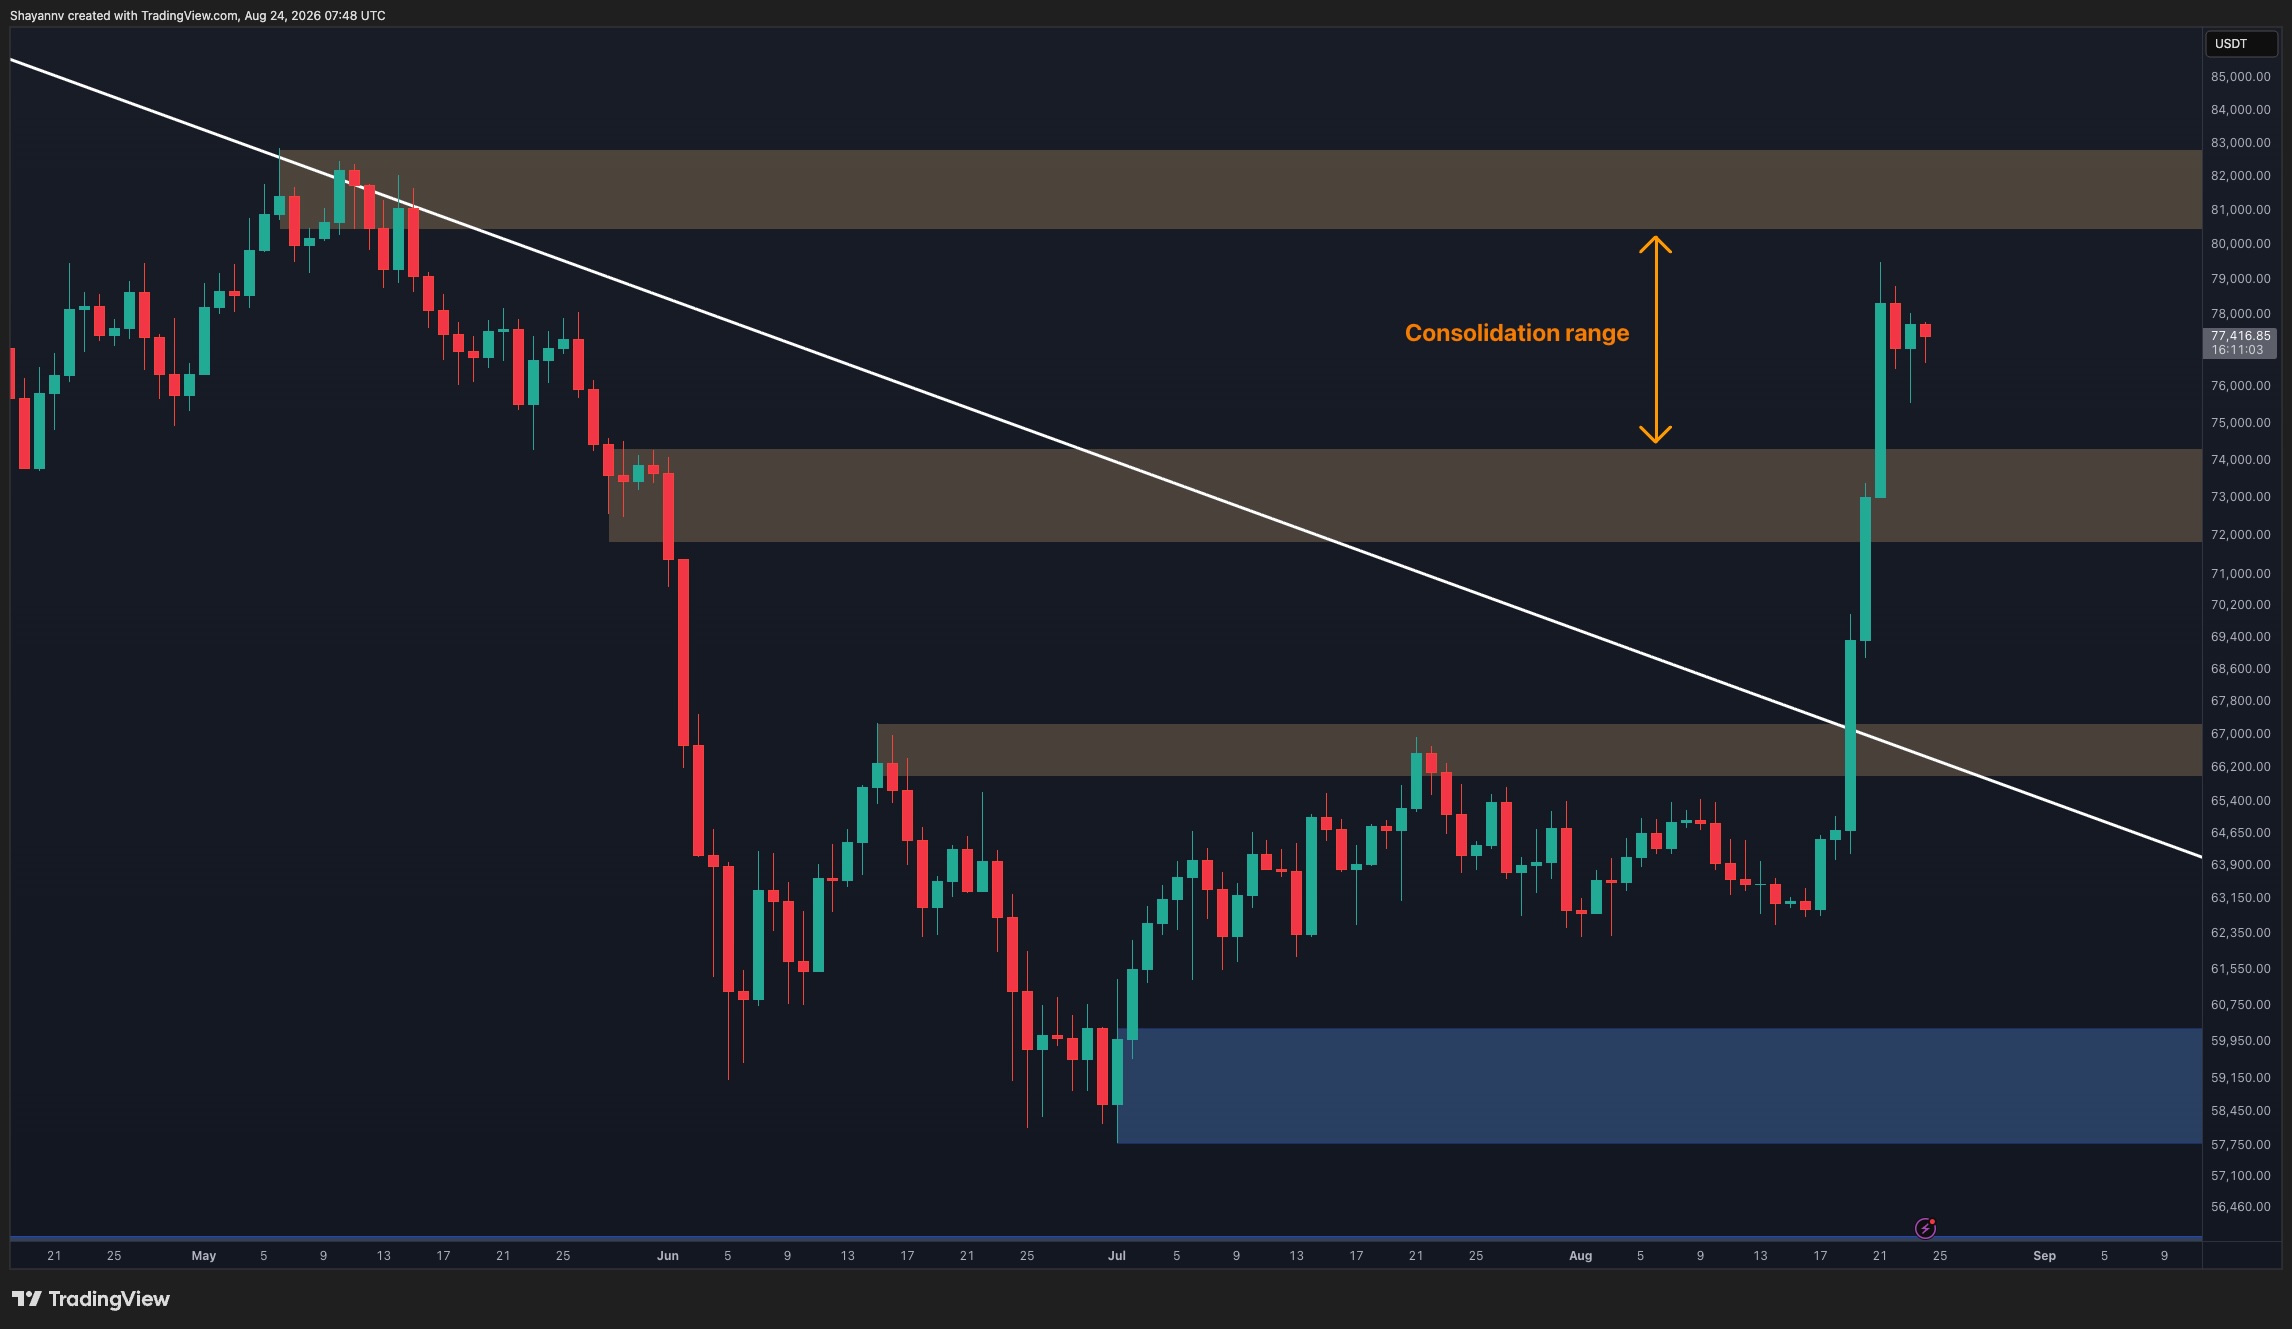
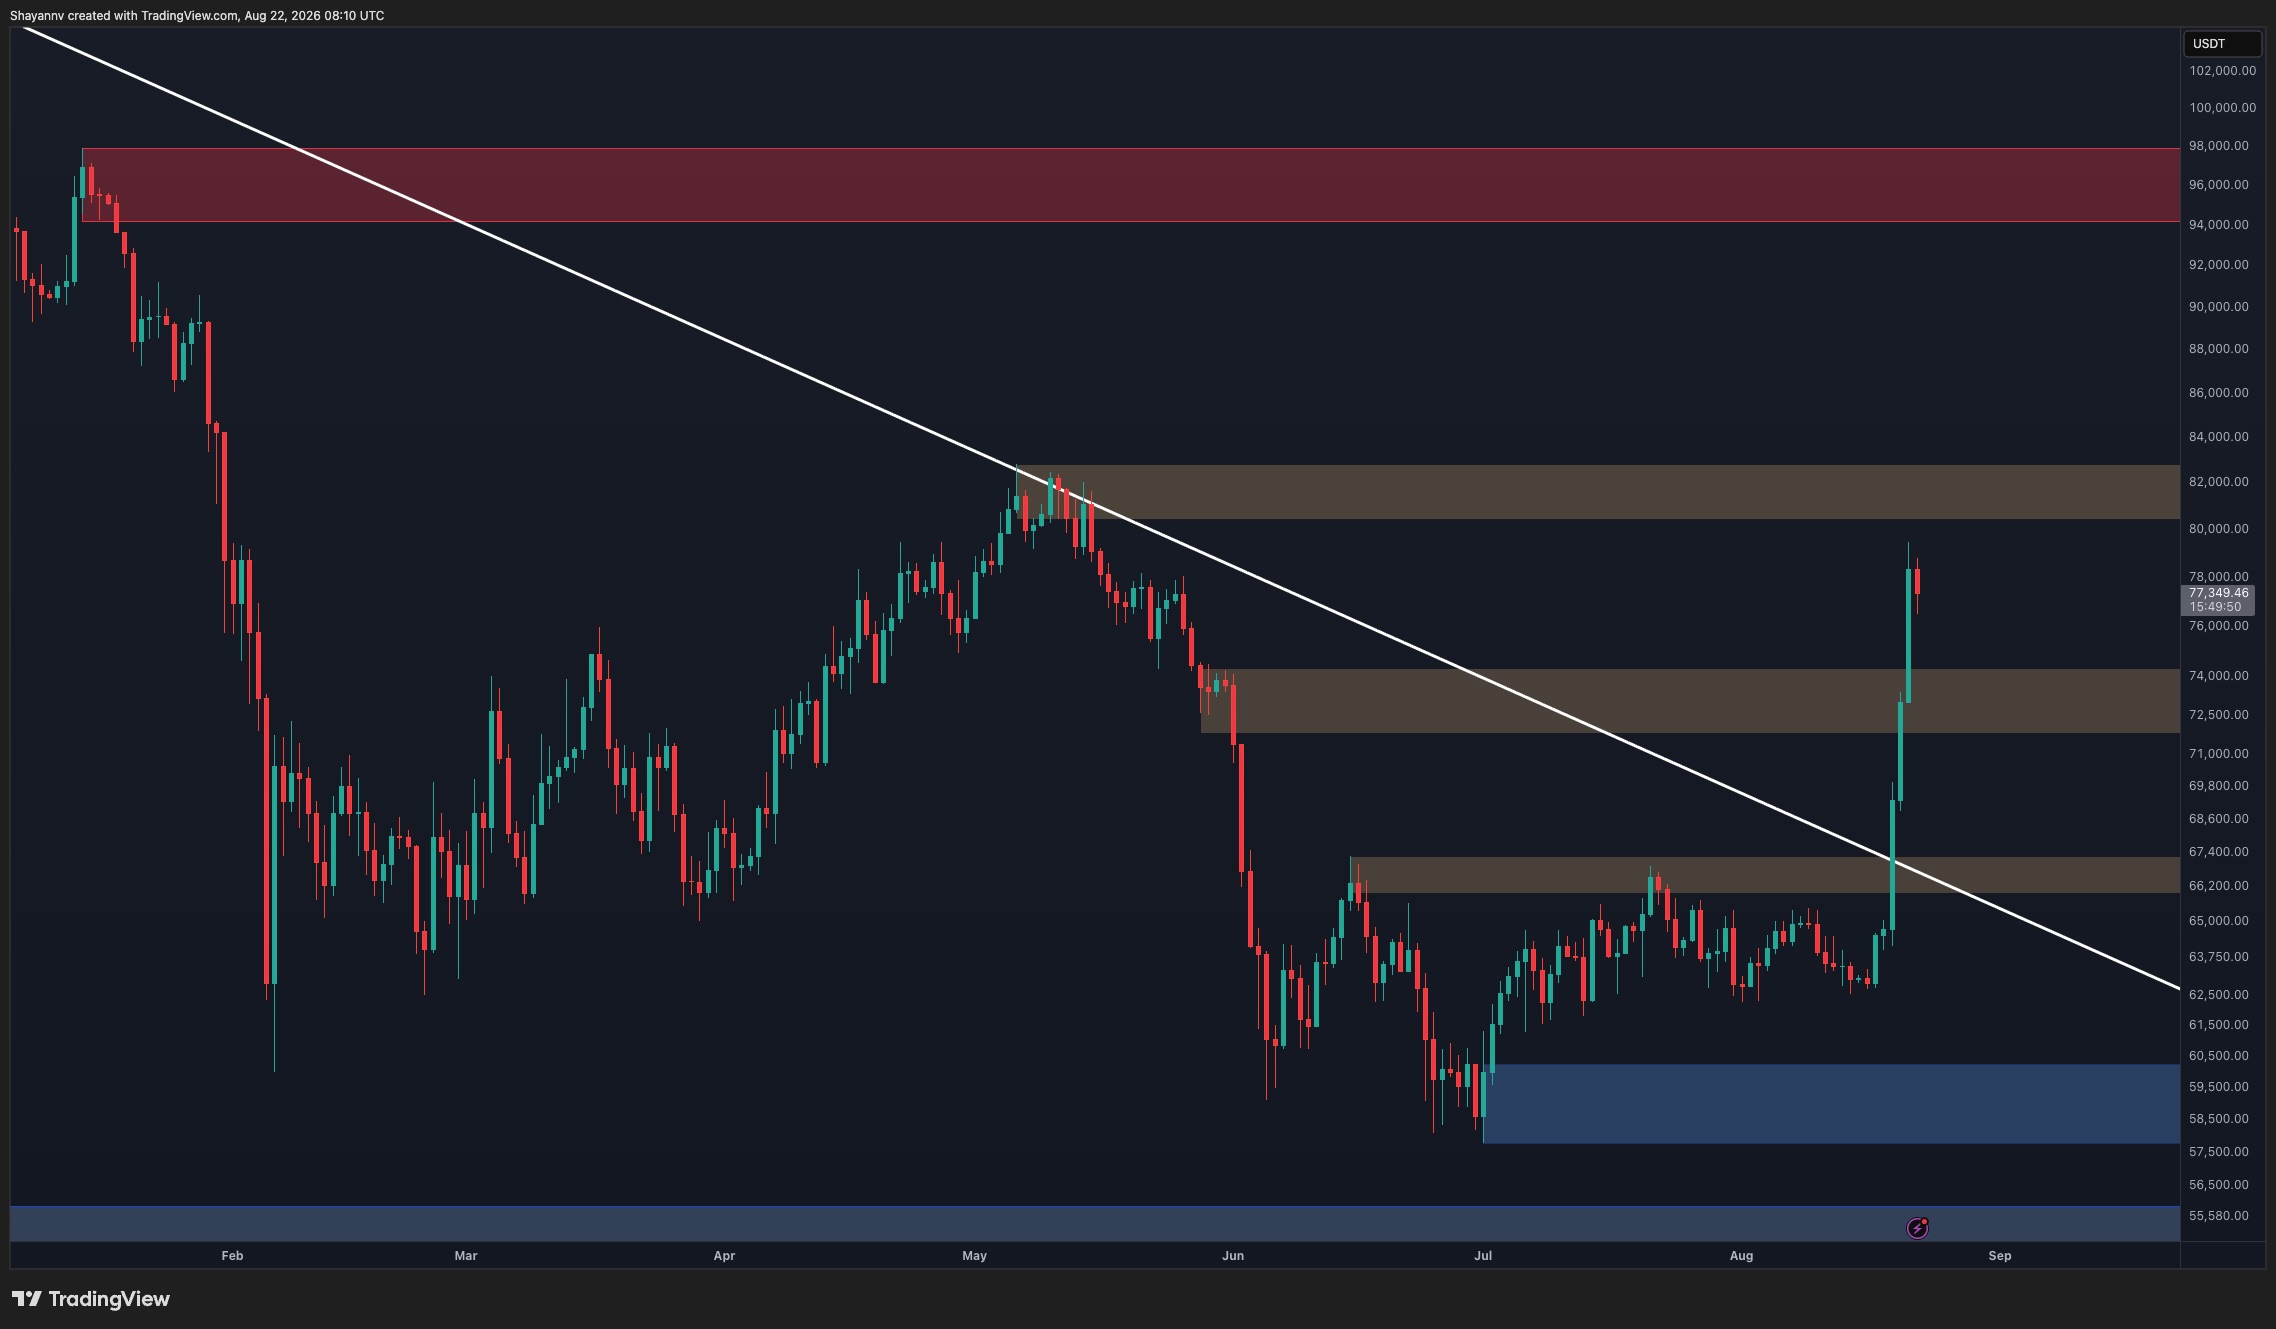
On the daily chart, BTC has undergone a significant structural shift after breaking above the long-standing descending trendline and the $65.9K-$67.1K resistance zone. The breakout triggered an aggressive rally through the $72K-$74.4K supply area, with BTC subsequently reaching almost $80K.

The price is now trading around $79K, placing it between the recently reclaimed $72K-$74.4K zone and the next major resistance area around $80.7K-$82.7K. This creates a relatively wide region in which consolidation could develop following the vertical advance.

The broader structure remains constructive while BTC holds above the $72K-$74.4K support zone. A sustained breakout above $80.7K-$82.7K would provide the next confirmation of bullish continuation. Conversely, losing $72K would weaken the current structure and raise the possibility of a deeper retracement toward the previous breakout areas.

BTC/USDT 4-Hour Chart

The 4-hour timeframe provides clearer evidence that momentum has temporarily cooled. Following the near-vertical advance from roughly $64K, BTC has formed a short-term descending channel around the $75K-$79K region.

The asset is currently positioned near the middle-to-upper portion of this structure. The channel appears more consistent with a corrective consolidation after the breakout than with a confirmed bearish reversal at this stage.

A clean breakout above the channel’s upper boundary and the recent highs around $79K would strengthen the case for another move toward the $80.7K-$82.7K resistance zone. In contrast, a break beneath the channel could send BTC back toward the $72K-$74.4K support zone, which represents the first major area buyers would need to defend.

Overall, Bitcoin could remain range-bound between roughly $74K and $81K in the near term as the market absorbs the magnitude of the recent rally.

Sentiment Analysis

The three-day Binance BTC/USDT liquidation heatmap reinforces the possibility of continued consolidation. Liquidity is distributed on both sides of the current price rather than being overwhelmingly concentrated in a single direction.

Notably, there is visible liquidity above the market around $78K and extending toward approximately $80K-$81K, while another substantial concentration sits below the price around the $74K-$76K region.

This two-sided positioning could encourage price to continue oscillating through the broader consolidation range as liquidity is cleared on either side. The heatmap therefore supports the technical picture of short-term consolidation rather than providing a strong directional signal by itself.

A sustained move beyond either side of these liquidity concentrations would likely be more informative. Until then, the combination of the 4-hour channel and the liquidation structure suggests BTC may continue consolidating between the major $72K-$74.4K support zone and the $80.7K-$82.7K resistance area before the next larger directional move develops.

The post Bitcoin Price Analysis: BTC Surges Toward $80K Again – Can It Break Through This Time? appeared first on CryptoPotato.

Ethereum Price Analysis: ETH Looks Ready to Rally – But Is a Pullback Coming First?

23 August 2026 at 22:06

Ethereum’s explosive breakout has shifted the broader structure decisively in favor of buyers, but the rally has now encountered a major resistance zone. With ETH pulling back after reaching roughly $2.55K, the market appears to be entering a corrective phase following the highly impulsive advance.

ETH Price Analysis: The Daily Chart

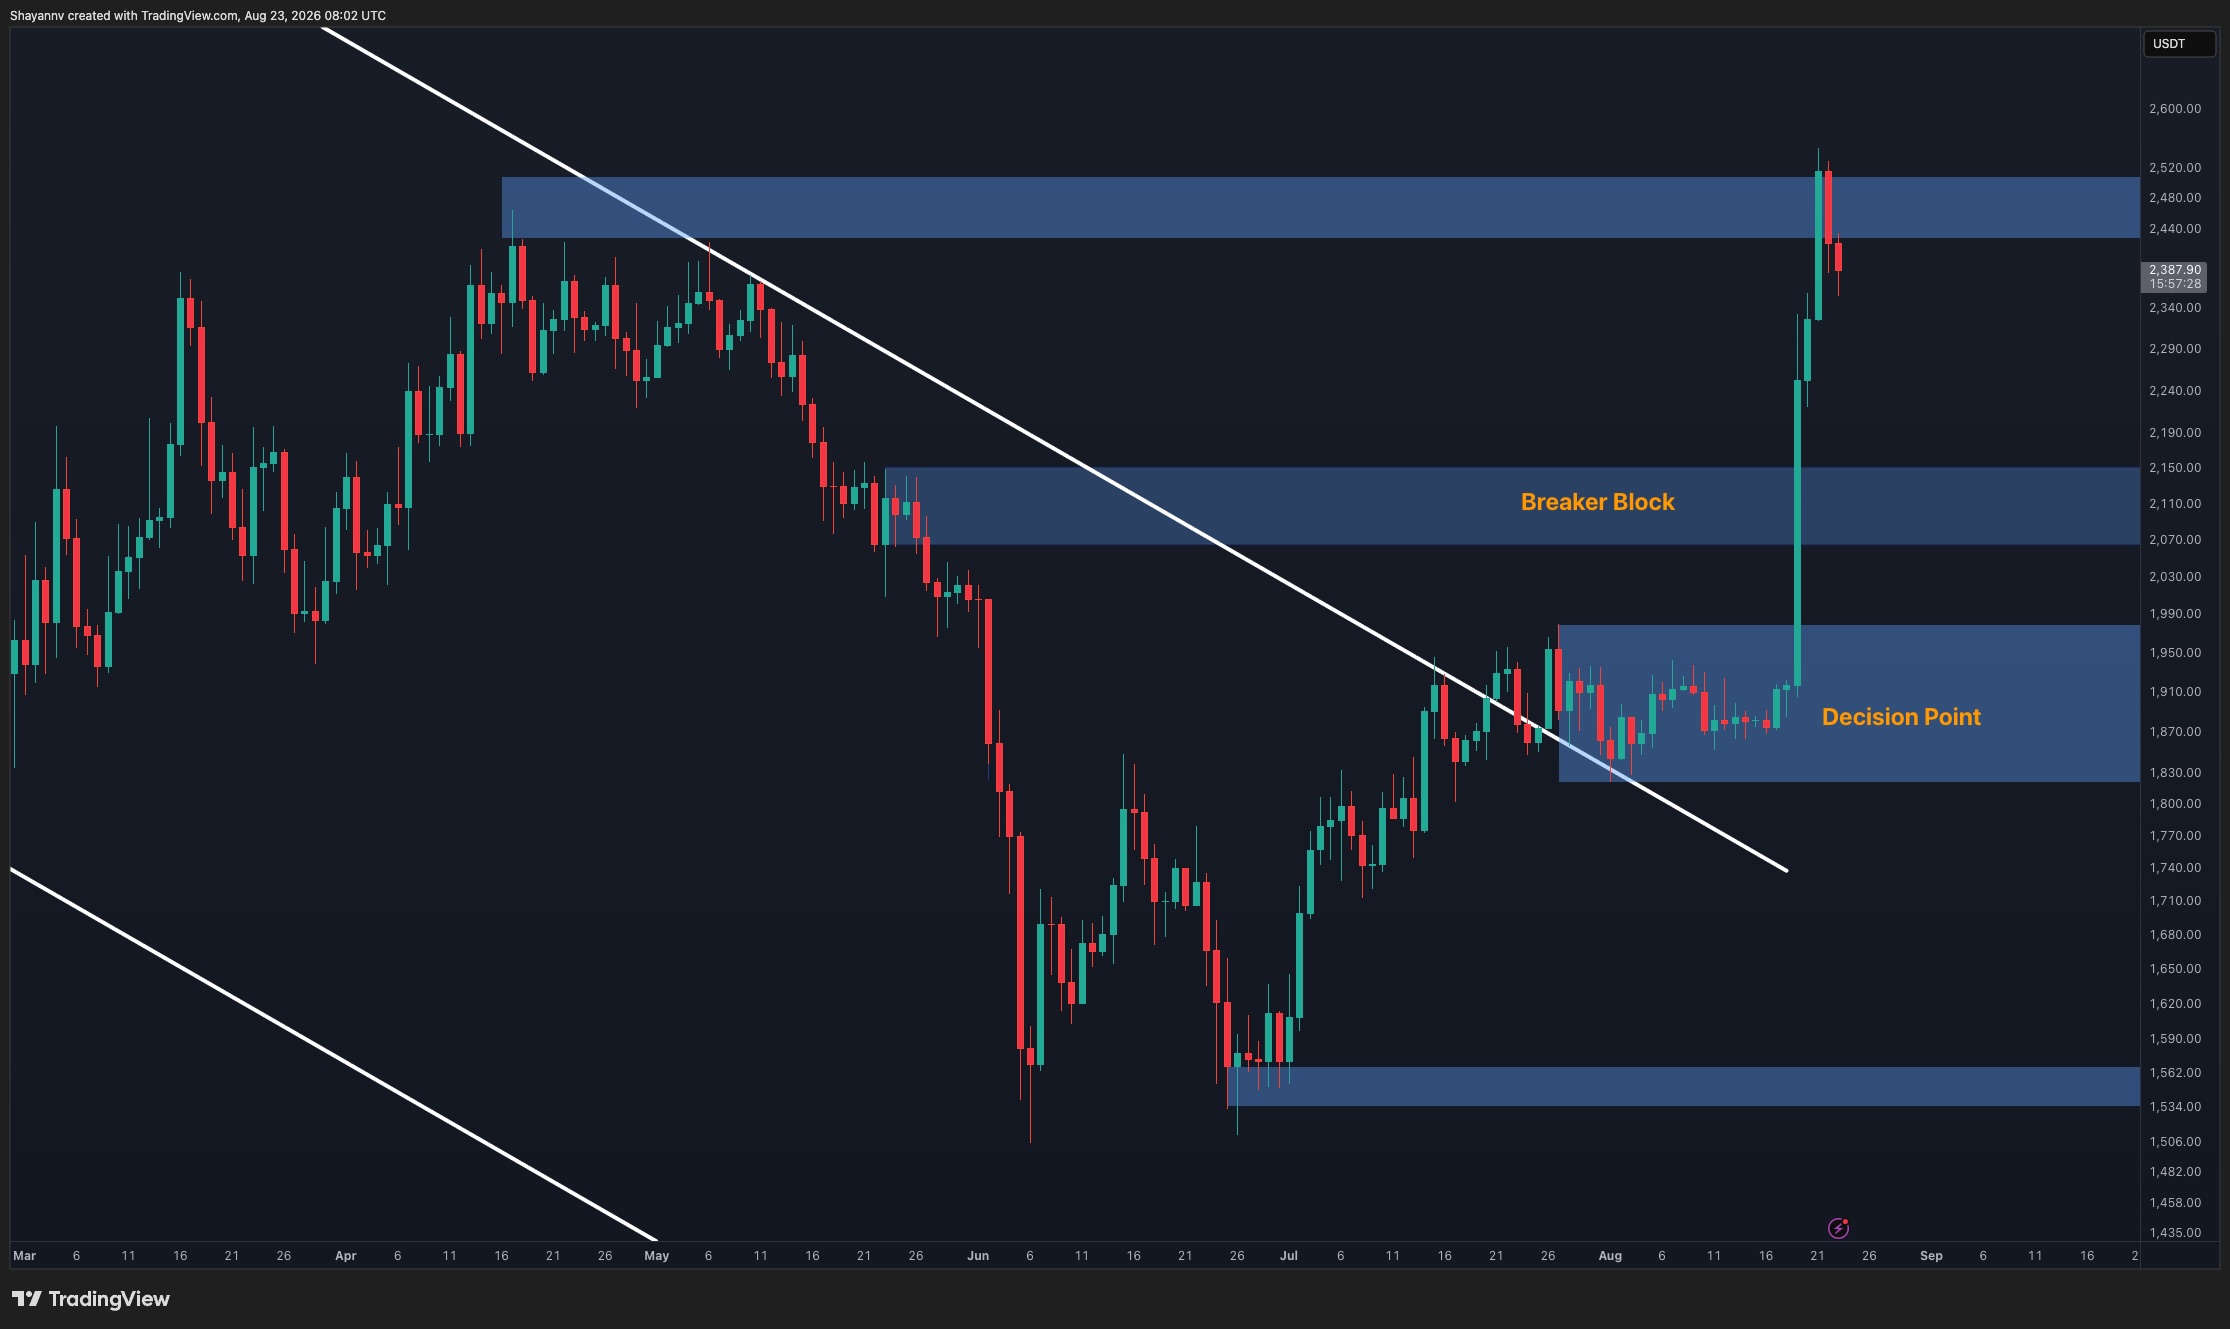
On the daily timeframe, Ethereum has completed a major structural breakout. The asset initially consolidated around the $1.83K-$1.97K decision-point zone before launching higher and decisively breaking the long-standing descending trendline that had capped the market for months.

The rally subsequently cleared the $2.07K-$2.15K breaker-block zone without much hesitation and extended into the major $2.44K-$2.51K resistance area. Ethereum briefly pushed above this zone toward $2.52K before sellers stepped in, with the price now retreating to around $2.39K.

This rejection is significant given the speed of the preceding advance. After such an almost vertical rally, a period of consolidation or a deeper correction would be technically reasonable. The immediate question is whether Ethereum can reclaim and establish acceptance above the $2.44K-$2.51K resistance zone. Doing so would likely restore bullish momentum and put the recent high back under pressure.

On the downside, the $2.07K-$2.15K breaker block represents the most important major support zone visible on the daily chart. As long as this area remains intact, the broader breakout structure appears bullish despite any near-term volatility.

ETH/USDT 4-Hour Chart

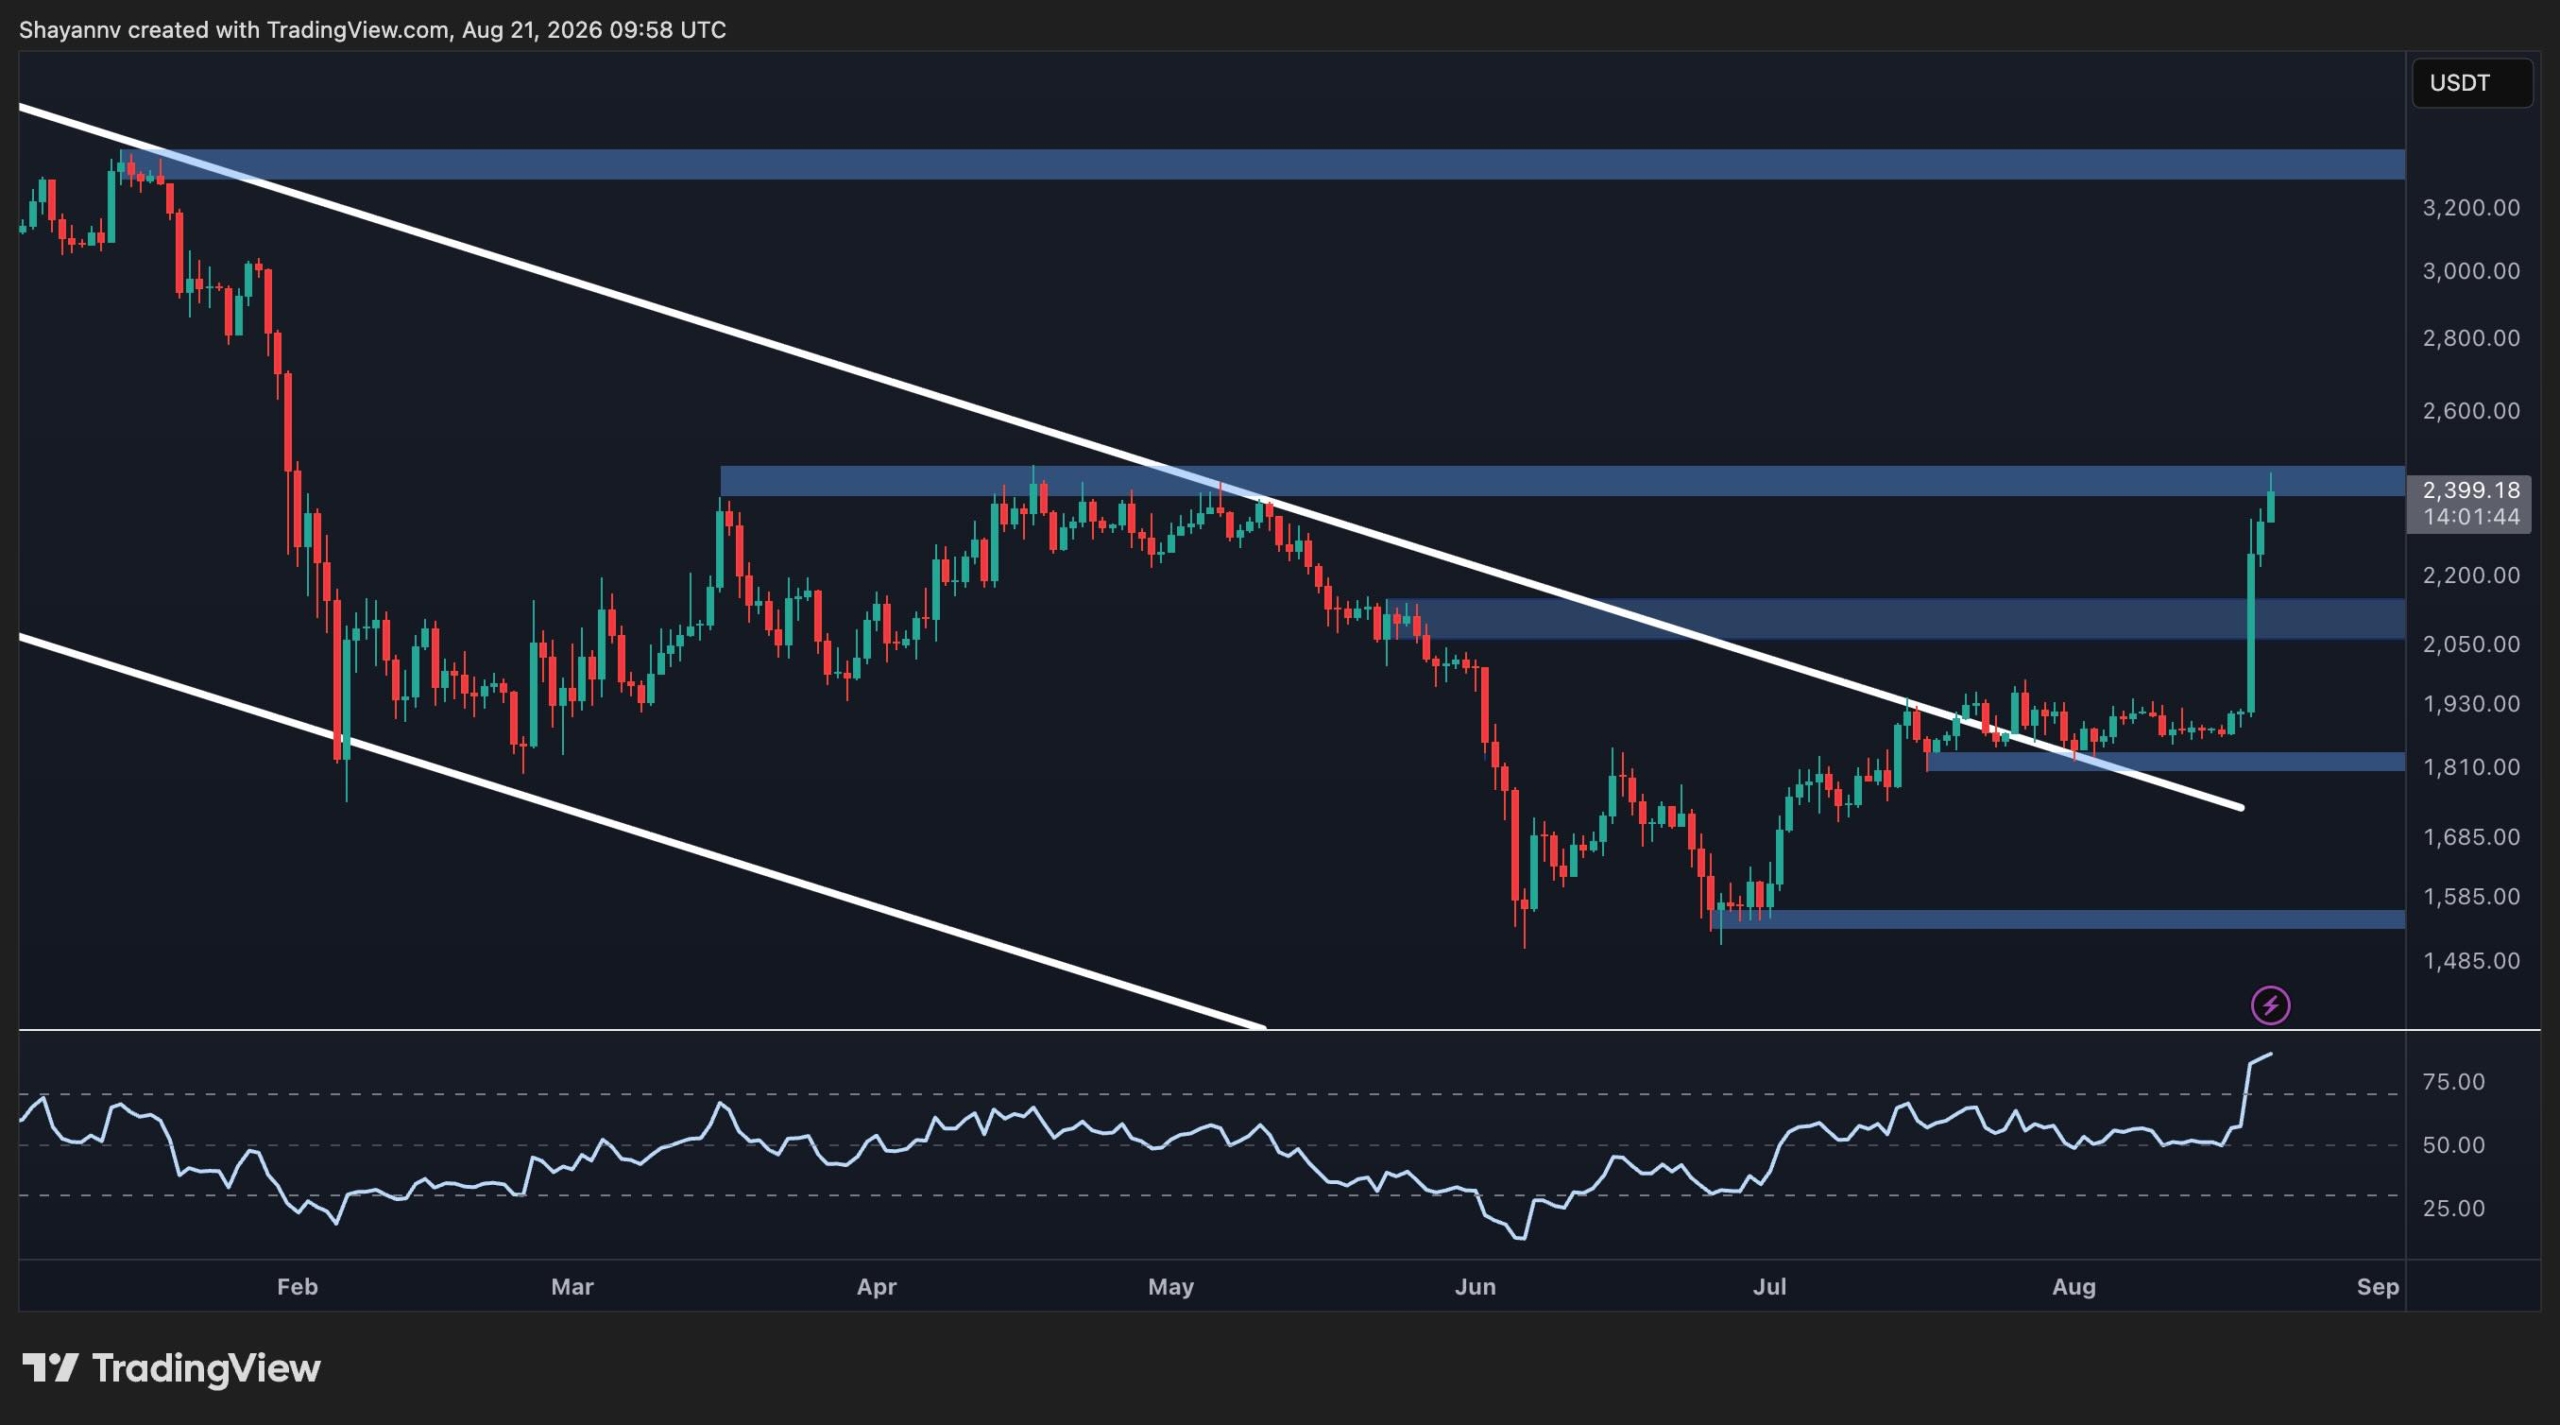
The 4-hour chart shows the extent of ETH’s short-term expansion more clearly. Ethereum surged from roughly $1.87K to a high near $2.55K in only a few sessions, before encountering resistance and beginning its current pullback.

The Fibonacci retracement levels provide useful references if the correction extends. The 0.5 retracement is positioned around $2.21K, while the 0.618 level at $2.13K sits inside the important $2.07K-$2.15K support zone. The 0.702 level is also located near $2.07K, creating a strong technical confluence across this region.

As a result, the $2.07K-$2.21K area could become the primary pullback zone if sellers maintain control in the short term. A reaction from this region would preserve the bullish breakout structure and could provide the foundation for another attempt at the $2.44K-$2.55K resistance area.

A decisive loss of the $2.07K region, however, would weaken the setup and expose the deeper 0.786 retracement around $2.01K. For now, the pullback appears more consistent with cooling momentum after an outsized rally than a confirmed reversal.

Sentiment Analysis

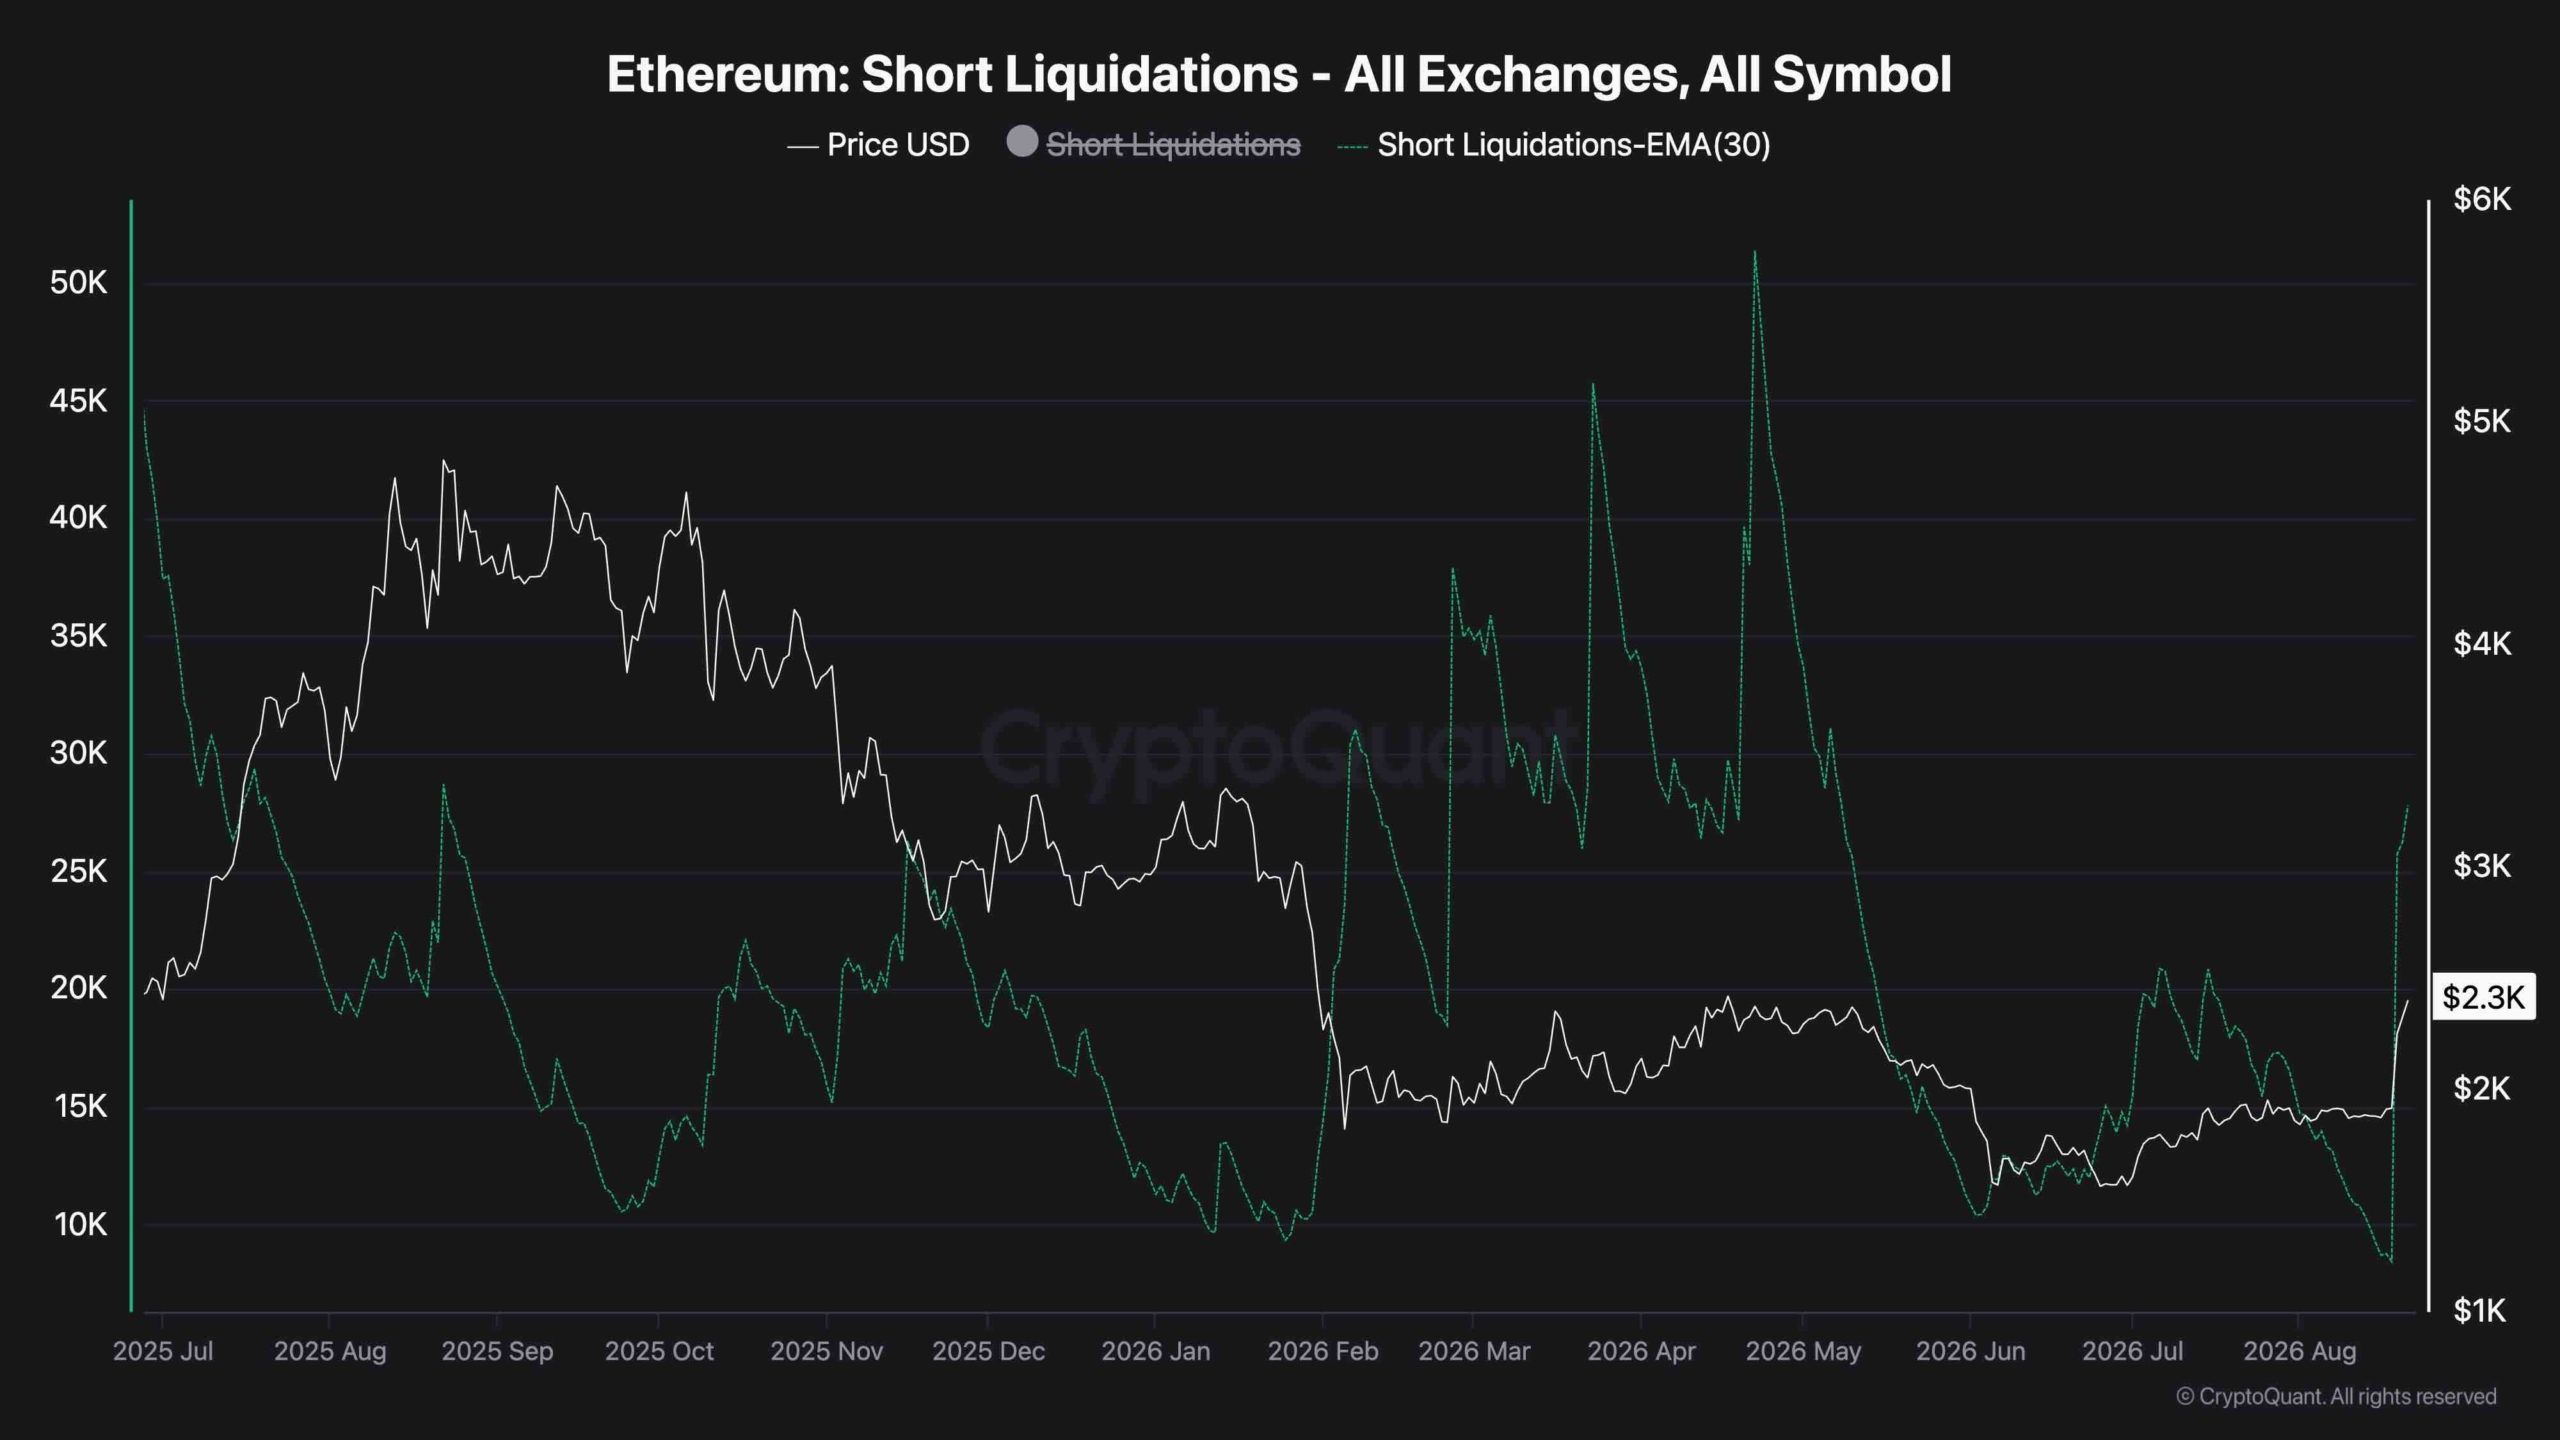
The one-week Ethereum liquidation heatmap adds further weight to the possibility of a deeper retracement. Following the rapid rally, a notable concentration of liquidation liquidity has developed below the current market, particularly in the area above $2.2K.

This cluster could act as a short-term liquidity magnet if Ethereum continues correcting. A move toward this region would also align closely with the 4-hour 0.5 Fibonacci retracement around $2.21K, creating a notable overlap between derivatives positioning and technical structure.

Therefore, a liquidity sweep toward the $2.2K region could be a natural part of the post-breakout correction rather than necessarily signaling the end of the bullish move. The subsequent reaction around that area would likely be more important for determining whether Ethereum can stabilize and eventually challenge the $2.44K-$2.55K resistance zone again.

The post Ethereum Price Analysis: ETH Looks Ready to Rally – But Is a Pullback Coming First? appeared first on CryptoPotato.

Ripple Price Analysis: Major Breakout Confirmed – How High Can XRP Go?

22 August 2026 at 20:10

XRP has delivered a sharp bullish breakout after spending months inside a persistent downtrend. The impulsive move has dramatically improved the short-term structure, although the price is already testing a significant resistance area after becoming highly extended.

XRP Price Analysis: The Daily Chart

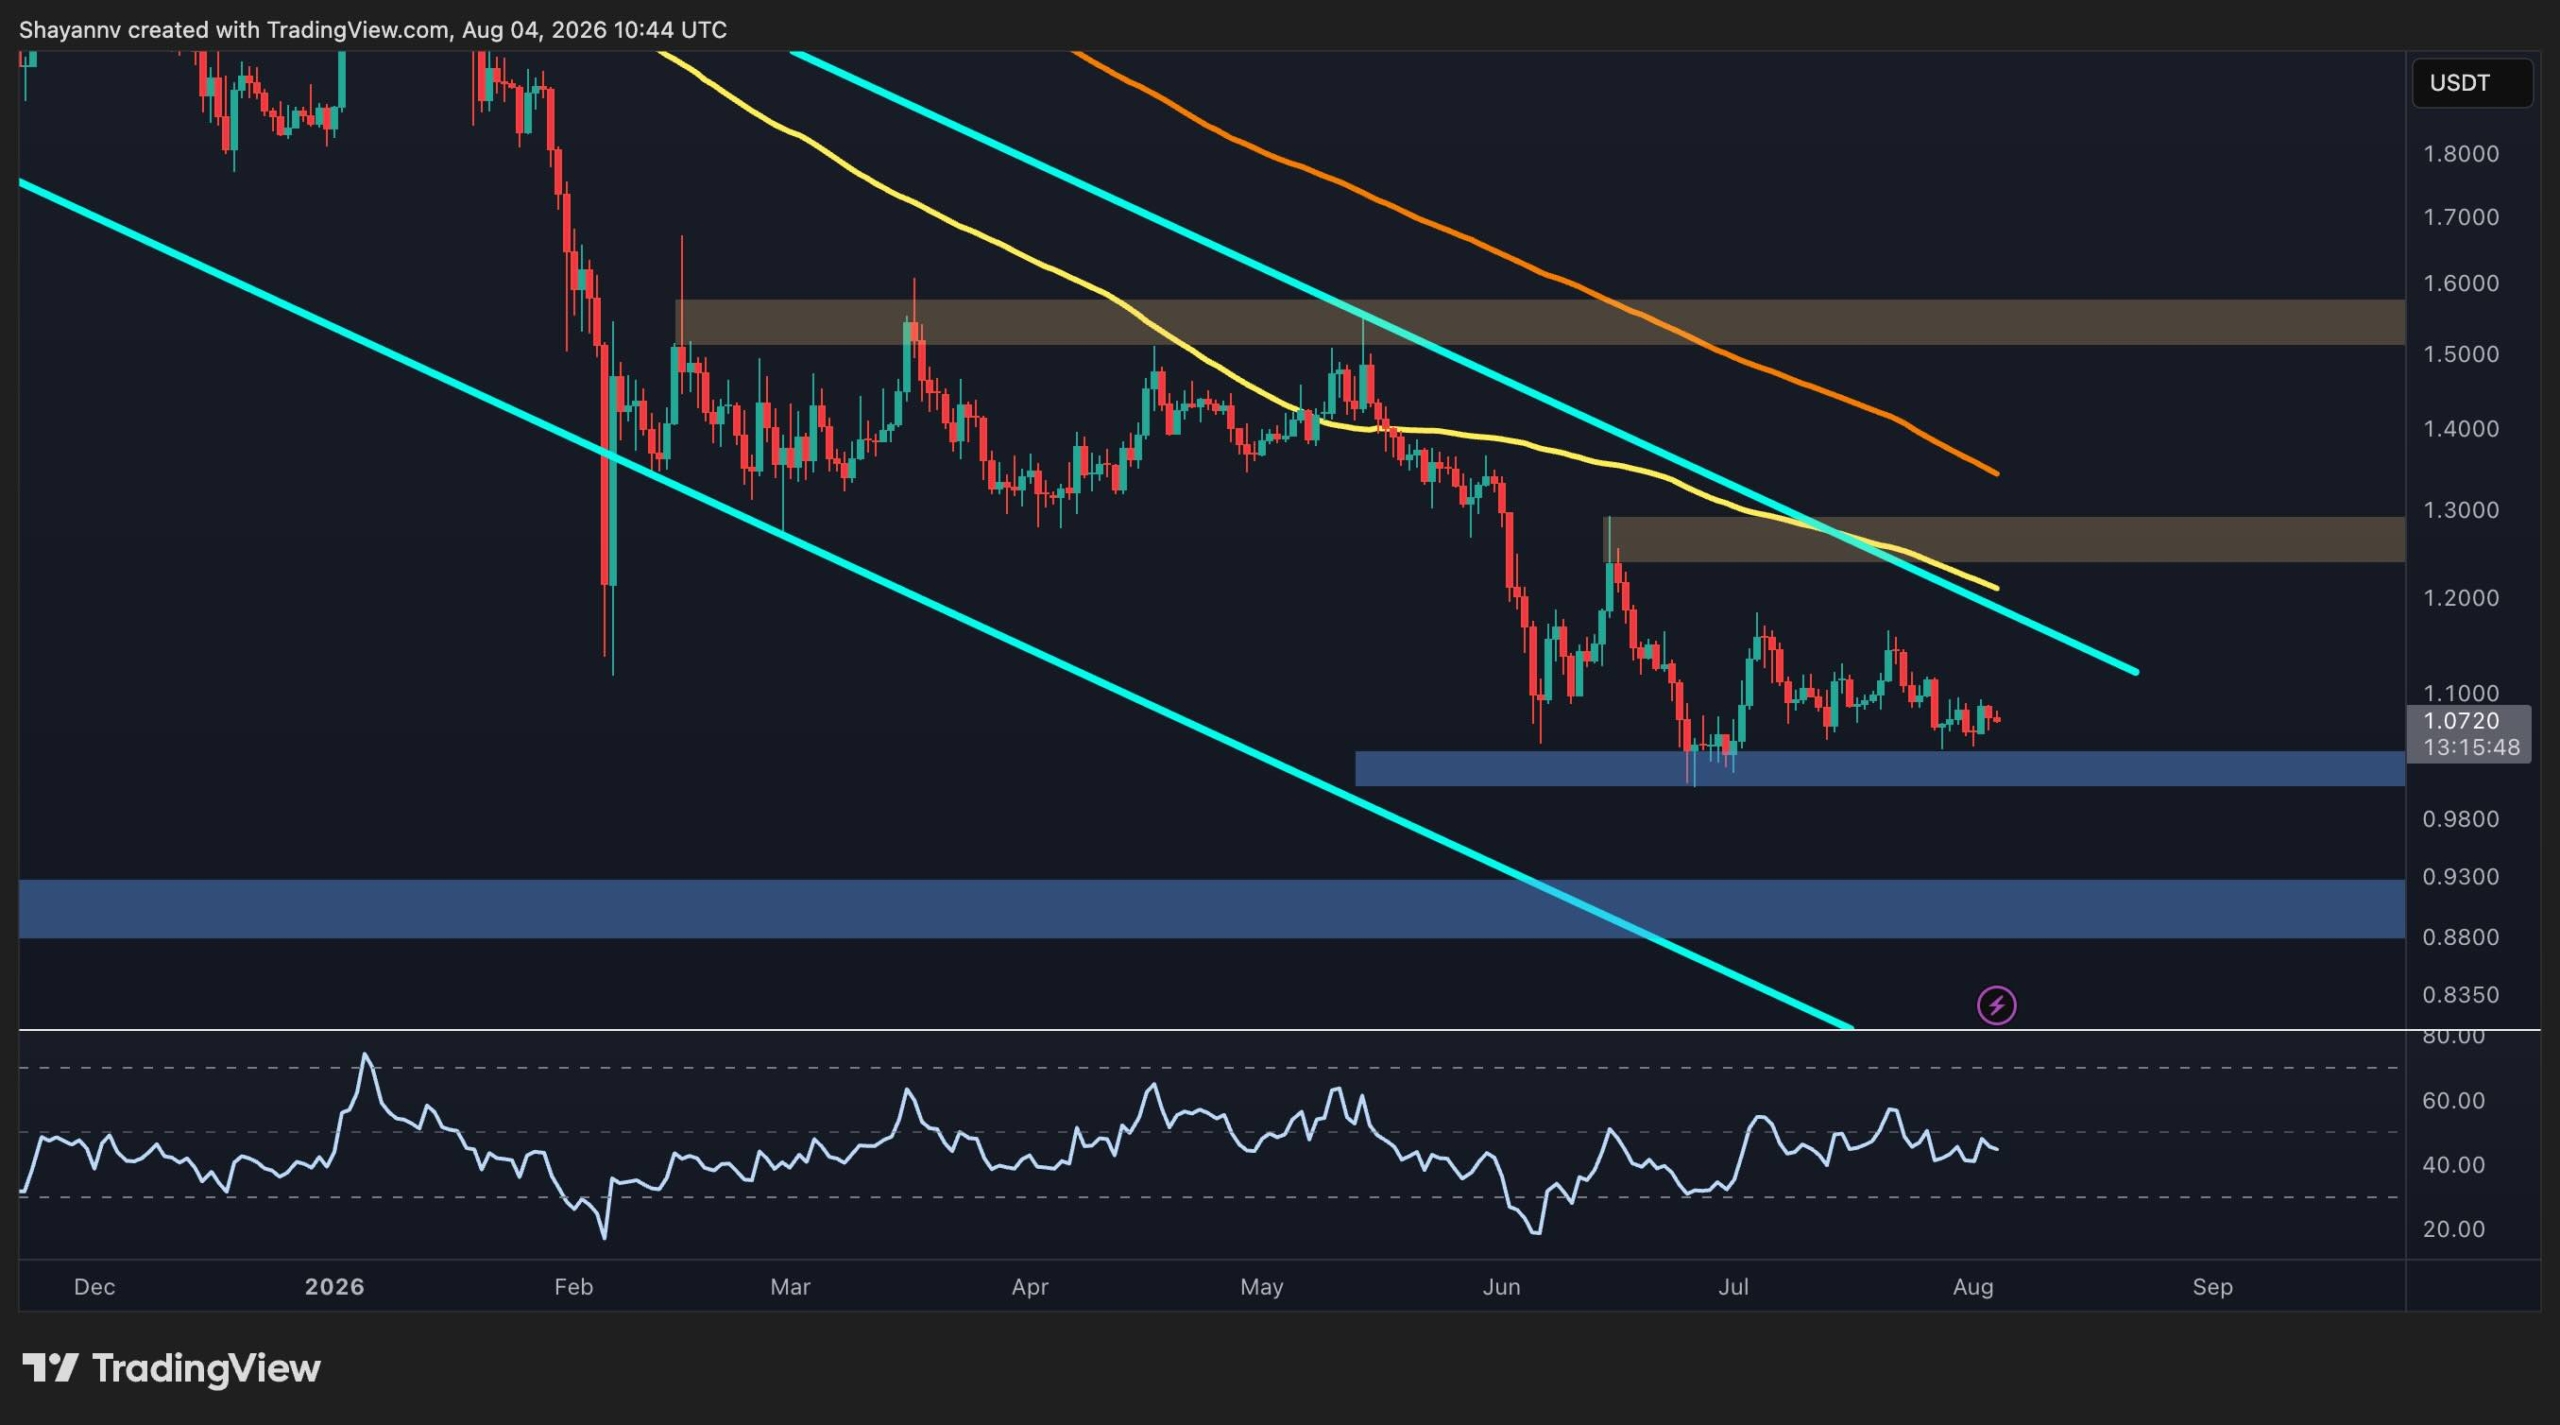
On the daily timeframe, the token has decisively escaped the descending channel that had governed price action for several months. The breakout originated from around the $0.98-$1 support region and quickly carried the asset through multiple resistance zones, including the descending channel boundary and the $1.10-$1.15 area.

The rally has since extended toward $1.55, bringing XRP directly into the important $1.50-$1.58 resistance zone. The long upper wick toward roughly $1.70 shows that sellers have already responded at higher prices, suggesting some short-term profit-taking after the near-vertical advance.

Nevertheless, the broader structural change is significant. Holding above the former $1.50 region would strengthen the breakout and could eventually put the major $1.82-$1.94 resistance zone into focus. Conversely, failure to establish support around current levels could trigger a corrective phase, with $1.22-$1.30 serving as an important former resistance area to monitor.

XRP/USDT 4-Hour Chart

The 4-hour timeframe emphasizes how aggressive the latest move has been. XRP broke out from around $1 and surged as high as $1.70 with almost no meaningful consolidation, leaving the market vulnerable to a retracement as the initial momentum cools.

The Fibonacci retracement levels highlight several potential support areas if a correction develops. The first major region is around the 0.5 level at $1.34, which overlaps with the upper portion of the marked $1.22-$1.34 support zone. Below it, the 0.618 retracement sits at $1.26, followed by the 0.702 level at $1.20. A deeper pullback could bring the 0.786 level near $1.14 into play, close to another former resistance area.

For now, the rejection from $1.70 suggests the market may need to digest the explosive rally. As long as XRP holds the $1.22-$1.34 zone during a correction, the breakout structure appears constructive, and another attempt toward $1.70 could follow. A sustained loss of this area, however, would increase the probability of a deeper retracement toward $1.14-$1.10 before buyers regain control.

The post Ripple Price Analysis: Major Breakout Confirmed – How High Can XRP Go? appeared first on CryptoPotato.

Bitcoin Price Analysis: BTC’s 25% Rally Faces Its First Serious Threat

22 August 2026 at 19:55

Bitcoin has staged an aggressive breakout after weeks of compressed price action, pushing through several important resistance levels in a short period. While the move has materially improved the technical picture, BTC is now approaching another major supply area, making the sustainability of the breakout the key question.

Bitcoin Price Analysis: The Daily Chart

On the daily timeframe, Bitcoin has decisively broken above the long-standing descending trendline and the $66K-$67K resistance zone. The breakout was followed by an exceptionally strong expansion, with price also clearing the intermediate $72K-$74K supply area and reaching roughly $79K before pulling back toward $77K.

This represents a notable shift in market structure. The descending trendline had capped BTC throughout the broader correction, so reclaiming it alongside multiple horizontal resistance zones suggests buyers have regained control, at least in the near term.

However, price is now approaching the major $80K-$83K resistance zone. This area previously marked an important swing high and could attract profit-taking following such a rapid advance. A breakout and daily acceptance above $83K would further strengthen the bullish structure and potentially open the way toward the much larger $94K-$98K supply zone.

Conversely, after such a vertical move, a correction would not necessarily invalidate the breakout. The former $72K-$74K resistance zone is now the first major area to monitor as potential support. Holding this region on a pullback would reinforce the idea that the recent move represents a genuine structural reversal rather than a temporary liquidity-driven spike.

BTC/USDT 4-Hour Chart

The 4-hour chart highlights the strength of the breakout more clearly. Bitcoin escaped the converging trendline structure around $64K-$65K and accelerated almost vertically, eventually reaching approximately $79.5K.

Given the speed of the advance, the market is now extended from its breakout point, increasing the probability of short-term consolidation or a corrective retracement. The $72K-$74K zone is the first significant support area, while the Fibonacci levels shown on the chart provide deeper retracement references at roughly $71.1K, $69.1K, $67.7K, and $66.3K.

The $66K-$67K region is particularly important because it combines the former horizontal resistance area with the broader breakout structure. A deeper correction into this region, followed by strong demand, could still preserve the bullish setup.

For now, the immediate obstacle remains the $79.5K high followed by the $81K-$83K supply zone. A period of consolidation beneath this resistance would be relatively constructive, whereas an immediate rejection followed by a loss of $72K could indicate that the market needs a considerably deeper reset before attempting another leg higher.

On-chain Analysis

The Realized Price UTXO Age Bands chart provides additional context for the breakout by showing the average acquisition prices of different groups of Bitcoin holders.

The most relevant development is that BTC’s surge toward $79K has pushed spot price above the realized-price levels of the shorter-term 1-3 month and 3-6 month cohorts, which sit around $64K and $74K, respectively. This means these groups have broadly moved back into unrealized profit, reducing some of the pressure associated with underwater recent buyers.

At the same time, several older cohorts remain positioned considerably above the current market price. The 18-month to 2-year realized price is around $87K, while the 6-12 month and 12-18 month bands are much higher, near $95K and $105K. These levels could become increasingly relevant if the recovery continues, as BTC would begin approaching the cost bases of holders who remain underwater.

Therefore, the on-chain structure has improved alongside the technical breakout, but the recovery is not yet complete. Holding above the roughly $74K cost basis of the 3-6 month cohort would be particularly constructive, while losing it could indicate that the latest surge has moved ahead of underlying holder support.

The post Bitcoin Price Analysis: BTC’s 25% Rally Faces Its First Serious Threat appeared first on CryptoPotato.

Ethereum Price Prediction: Has ETH Opened the Door to $3K After the Latest Breakout?

21 August 2026 at 16:16

Ethereum has staged a sharp breakout from its multi-week consolidation, with ETH now trading around $2.4K after reclaiming the descending trendline that had capped the broader recovery. The move is supported by a strong acceleration in momentum and a noticeable rise in short liquidations, although the sharp increase in RSI readings suggests the rally could become vulnerable to a near-term pullback.

Ethereum Price Analysis: The Daily Chart

On the daily chart, ETH has decisively broken above the descending trendline that had been in place for months. The breakout is particularly significant because the price had spent several months consolidating below that resistance while forming higher lows from the June bottom near $1.5K.

The latest surge has carried ETH directly into the $2.1k resistance level, with the price currently testing the $2.4K supply zone. This area represents the immediate test for the breakout. A sustained daily close above the zone would strengthen the bullish structure and could open the way toward $3K and potentially higher.

On the downside, the former breakout area around $2.1K is now the first major support zone. Holding above it would keep the recent breakout structure intact. Below that, the $1.8K region represents another important support area, while the $1.5K zone remains the deeper structural floor.

Momentum has also shifted sharply in favor of the buyers. The daily RSI has jumped above 75, running deep into the overbought area. This does not necessarily invalidate the breakout, particularly during a strong expansion move, but it does increase the probability of consolidation or a retest before another sustained leg higher.

ETH/USDT 4-Hour Chart

The 4-hour chart provides an even clearer picture of the breakout. ETH spent much of the last few months moving sideways before suddenly breaking above the short-term mildly ascending channel and the $2.1K resistance zone.

The breakout was followed by an almost vertical advance toward $2.4K, indicating strong short-term momentum. The $2.1K zone is therefore the key area to watch if the rally starts to retrace. A successful retest of this region as support would provide a healthier confirmation of the breakout.

As observed on the daily chart, the next major resistance sits around $2.4K, where ETH is currently trading. A decisive move above this zone could extend the advance toward higher levels in the upcoming weeks. At the same time, the 4-hour RSI has surged far above 80 and is moving sideways in this region.

That reading highlights just how stretched the immediate move has become. A pullback toward $2.1K would therefore not necessarily be bearish and would likely be necessary for the market to cool down, provided ETH maintains the breakout zone.

Sentiment Analysis

The liquidation chart shows a clear increase in Ethereum short liquidations alongside the latest price surge. Short liquidations have risen sharply toward roughly 28K on the latest spike, following a period in which the metric had remained comparatively subdued.

This suggests that the move above $2K has forced a growing number of bearish positions to close, adding forced buying pressure to the rally. In other words, the breakout appears to have developed a short-squeeze component.

However, the latest liquidation spike is still below several of the much larger liquidation events visible earlier in the chart, including episodes above 40K and 50K. That indicates the current squeeze has been significant but has not yet reached the most extreme levels seen during previous Ethereum rallies.

Overall, the charts favor a bullish interpretation as long as ETH holds the newly reclaimed $2K-$2.1K area. The immediate challenge is whether buyers can sustain momentum above the $2.4J resistance zone. With both the daily and 4-hour RSI heavily overbought and short liquidations accelerating, a temporary cooldown would be unsurprising, but the breakout structure remains constructive unless ETH loses its key support zones.

The post Ethereum Price Prediction: Has ETH Opened the Door to $3K After the Latest Breakout? appeared first on CryptoPotato.

Bitcoin Price Analysis: What’s Next for BTC After Massive 12% Daily Surge?

20 August 2026 at 15:57

Bitcoin has staged a sharp recovery from the lower end of its recent range, pushing back toward $70K after spending several weeks consolidating below a descending trendline. The latest move has improved the short-term structure considerably, although BTC is now approaching an important resistance cluster that could determine whether this is the start of a broader recovery or simply a range breakout that needs confirmation.

Bitcoin Price Analysis: The Daily Chart

The daily chart shows Bitcoin recovering from the $60K support area after a prolonged decline from the all-time highs. The price subsequently formed a broad consolidation structure, with the market repeatedly finding buyers around the $60K-$62K region while rallies were capped by a descending trendline.

The most important development is the latest breakout. BTC has moved decisively above the long-term descending trendline and the $66.5K resistance zone, with the asset currently around $72K. This represents a meaningful structural improvement because the trendline had been containing the recoveries for months.

However, the breakout is now facing its first major test. The $72K-$74K area represents the next significant resistance zone visible on the chart. A sustained move through this region would strengthen the bullish case and potentially expose the $80K-$82K resistance area next.

On the downside, the former $66.5K resistance zone is now the first important area to monitor. A daily close back below this region would weaken the breakout and raise the possibility of a return toward the critical $60K demand zone.

Overall, the daily structure has shifted from a clear sequence of lower highs into a potential bullish reversal. Confirmation above $66.5K would be important, while failure to hold that zone could turn the recent move into a false breakout and likely lead to another capitulation event.

BTC/USDT 4-Hour Chart

The 4-hour chart provides a clearer picture of the immediate breakout. BTC had been trading inside a contracting structure, characterized by a descending upper trendline and a gradually rising lower boundary. This created a compression pattern that persisted from July into mid-August.

The breakout finally occurred, and Bitcoin surged through both the descending trendline and the $66K-$67K resistance zone. The move was particularly aggressive, with BTC quickly advancing from the mid-$64K area toward $70K.

The $66K-$67K zone is therefore the key short-term pivot. As long as Bitcoin remains above it, the breakout structure remains intact, and the market could continue toward the next daily resistance around $72K-$74K.

At the same time, the speed of the move means a retest would not necessarily be bearish. A pullback toward $66K-$67K followed by a successful rebound could provide stronger confirmation that the former resistance has turned into support.

For now, momentum clearly favors the buyers on the 4-hour timeframe, but the next challenge is whether buyers can convert the breakout into sustained price acceptance above $70K.

On-Chain Analysis

The futures average order size chart provides an additional perspective on the recent price action. The indicator separates futures activity into normal orders, big whale orders, small whale orders, and retail orders, allowing the composition of trading activity to be viewed alongside Bitcoin’s price.

The recent price recovery from the $60K area toward $70K has featured a mixture of normal and whale-sized orders, with green and light-green clusters appearing repeatedly during the advance. This suggests that larger orders have remained active around the latest recovery rather than the move being driven exclusively by smaller retail transactions.

At the same time, the chart shows substantial red retail-order clusters during several previous major price swings, including periods around the $70K region and the subsequent decline. The latest advance toward $70K does not show the same degree of persistent retail-order dominance visible during some earlier rallies.

That backdrop is constructive, although the indicator alone does not establish whether the larger orders are predominantly long or short. The more important takeaway is that the current price recovery is occurring alongside renewed activity from larger futures participants.

Β 

The post Bitcoin Price Analysis: What’s Next for BTC After Massive 12% Daily Surge? appeared first on CryptoPotato.

Ripple Price Analysis: XRP Reclaims $1 as Sellers Show Early Signs of Exhaustion

19 August 2026 at 17:10

Ripple’s XRP remains locked in a broader bearish structure, although the latest short-term price action is beginning to show tentative signs of seller exhaustion. The $1 psychological level is now the immediate battleground, with the market approaching an important demand area below.

Ripple Price Analysis: The Daily Chart

XRP continues to trade within the large descending channel that has governed price action for several months. The sequence of lower highs remains intact, and the latest decline has pushed the asset back toward the $1 level after repeated failures to generate sustained bullish momentum.

The broader technical structure therefore remains bearish. The nearest significant resistance sits around $1.11-$1.15, an area that has recently rejected multiple recovery attempts. Above it, the descending channel boundary converges toward the $1.20 region, while the stronger $1.24-$1.29 supply zone represents another major obstacle. Until the asset can reclaim these areas, rallies are likely to remain corrective within the broader downtrend.

On the downside, the price is approaching the major $0.88-$0.97 demand zone. This is the most important support area visible on the daily chart and could attract buyers if the decline extends below $1. A decisive breakdown beneath this zone, however, would expose XRP to a continuation toward the lower boundary of the descending channel.

Overall, there is little evidence of a daily bullish structural reversal yet. The $0.88-$0.97 zone may provide the market with an opportunity to establish a stronger bottom, but buyers would subsequently need to reclaim the overhead resistance structure to confirm it.

XRP/USDT 4-Hour Chart

The 4-hour timeframe presents a more nuanced picture. XRP remains beneath a descending trendline and has lost the former $1.02-$1.03 support zone, which has now turned into an important resistance area. The subsequent decline has taken the price toward $1, where short-term momentum is beginning to compress.

However, a potential bullish RSI divergence is developing. While the asset has continued to print lower lows, the RSI has formed higher lows, suggesting that bearish momentum may be weakening. This does not confirm a reversal by itself, particularly while XRP remains beneath the descending trendline, but it increases the possibility of a short-term rebound.

The immediate bullish scenario would require the price to break above the descending trendline and reclaim the $1.02-$1.03 resistance zone. Such a move could trigger a recovery toward the next supply area around $1.06-$1.07.

Until that happens, the dominant price structure remains bearish. Failure to capitalize on the RSI divergence could result in another leg lower, with the $0.94-$0.97 region representing the next major support zone. Therefore, the divergence suggests weakening selling pressure, but price confirmation is still required before a meaningful reversal can be considered underway.

The post Ripple Price Analysis: XRP Reclaims $1 as Sellers Show Early Signs of Exhaustion appeared first on CryptoPotato.

Ethereum Price Prediction: Is $1.8K or $2K More Likely for ETH’s Near Future?

18 August 2026 at 21:33

Ethereum is consolidating around $1.9K after recovering sharply from the June and July lows. The broader structure has considerably improved, but ETH still remains below several important resistance levels, and at the moment, the market is at a key decision point.

Ethereum Price Analysis: The Daily Chart

The daily chart shows ETH trading around $1.9K, with the price currently caught between the 1.8K support zone and the $2.1K resistance area. The latter is particularly important because reaching it would mean that the market has broken past both the 100-day and 200-day moving averages and is ready to build a new uptrend.

ETH’s recovery from the $1.55K area has produced a sequence of higher lows and pushed the asset back above the white trendline, which is the upper boundary of the long-term descending channel that has held ETH captive for months. However, the broader trend cannot yet be called completely bullish, as the 200-day moving average remains well above the current price and continues to slope lower around $2K.

Meanwhile, the price has just broken the 100-day moving average, which is just below the $1.85K area, and is flattening, suggesting that momentum has stabilized and that the price is finding a footing to attack the $2K area. A sustained move above $2K would therefore be an important structural improvement, while reclaiming the broader $2.1K zone could open the door toward the 2.4K resistance region.

On the downside, the $1.8K area is the first major support to watch. A daily breakdown below this zone would weaken the recovery structure and could expose the next support zone around $1.55K.

ETH/USDT 4-Hour Chart

The 4-hour chart provides a more constructive short-term picture. ETH has been consolidating inside a broad range, with repeated reactions from the $1.8K area and several attempts to approach the $1.96K resistance zone.

The price is also moving within an ascending channel marked by the yellow trendlines. The upper boundary currently converges with the $2K resistance area, making this the immediate level buyers need to overcome.

Momentum has also cooled following the latest attempt to go higher. The RSI has moved back toward the middle of its range after spending time above 60, suggesting that short-term momentum is currently neutral rather than strongly bullish or bearish.

A clean breakout above $2K could confirm a continuation of the recovery and bring the $2.1K daily resistance zone into focus. Conversely, losing $1.8K would invalidate the immediate range structure and increase the probability of a deeper retracement toward $1.72K, and even below the ascending structure.

Sentiment Analysis

The Ethereum Taker Buy/Sell Ratio chart shows that the 30-period moving average of the ratio has recovered considerably from its lows but remains slightly below the neutral 1 level. A reading below 1 generally indicates that sell-side market orders are still outweighing buy-side market orders.

The improvement in the metric is nevertheless notable. It suggests that aggressive selling pressure has eased compared with earlier periods, broadly coinciding with ETH’s recovery toward $1.9K. However, the ratio has not yet moved decisively above 1, meaning that aggressive buyers have yet to establish clear dominance.

This leaves the on-chain/futures signal cautiously constructive rather than decisively bullish. A sustained move above 1 in the taker buy/sell ratio, alongside a breakout above the $2K resistance area, would provide stronger confirmation that demand is returning. Until then, ETH’s price action remains consistent with consolidation beneath major resistance rather than a confirmed breakout.

Β 

The post Ethereum Price Prediction: Is $1.8K or $2K More Likely for ETH’s Near Future? appeared first on CryptoPotato.

Bitcoin Price Analysis: BTC’s Rally Means Nothing Until It Reclaims This Key Level

18 August 2026 at 17:11

Bitcoin remains trapped in a broad corrective structure, with the price currently near $64.3K after failing to reclaim several important resistance levels. The daily chart shows a persistent bearish trendline and weakening momentum, while the 4-hour structure suggests that the asset is compressing inside a narrowing range. Meanwhile, NUPL has fallen sharply from cycle-high territory, indicating that aggregate unrealized profits have been significantly reduced.

Bitcoin Price Analysis: The Daily Chart

Bitcoin’s daily chart remains technically cautious. The price is trading below the descending white trendline and the 100-day and 200-day moving averages. This alignment keeps the broader trend tilted to the downside until BTC can reclaim these dynamic resistance levels.

The most immediate horizontal resistance sits around the $67K zone, where the descending trendline and a horizontal supply area converge. A daily breakout above this region would be an important improvement in market structure and could open the way toward the $72K-$74K resistance zone. Above that, the $82K area represents another major supply region.

On the downside, BTC is currently holding above the $60K demand zone. A loss of this area would weaken the consolidation structure and could expose the deeper $55K support region. Therefore, the $60K zone remains particularly important for the bullish case.

BTC/USDT 4-Hour Chart

The 4-hour chart provides a somewhat more constructive short-term picture. BTC has been forming a tightening symmetrical triangle structure between an ascending lower trendline and a descending upper trendline, effectively creating a compression pattern.

The price is currently near $64.3K, approaching the upper boundary of this structure. The first major hurdle is the $66K-$67K resistance zone, which also coincides with the longer-term descending channel. A decisive breakout above this region would favor a continuation toward the key $72K area.

Conversely, a breakdown of the triangle pattern from the upper trendline could send BTC back toward the $60K area rapidly. The 4-hour RSI has also surged toward the upper end of its recent range, showing a clear improvement in short-term momentum. However, the indicator is also approaching overbought territory, meaning a rejection near resistance could trigger another pullback before a breakout attempt.

Overall, a compression structure is usually resolved with an impulsive move, depending on the direction of the subsequent breakout. Therefore, the upcoming sessions can be crucial in determining BTC’s trend in the short-term.

On-Chain Analysis

The NUPL chart shows a significant deterioration in Bitcoin’s unrealized profit conditions. NUPL has fallen from above 0.5 during the earlier stages of the cycle to approximately 0.18 currently. The indicator is therefore sitting well below the 0.25 level highlighted on the chart and close to the lower end of the historical range shown.

This decline indicates that the aggregate unrealized gains held by Bitcoin investors have been substantially compressed. Importantly, the current NUPL reading is much closer to the capitulation/low-profit regions seen during previous major corrections than to the elevated levels associated with euphoric market conditions.

While NUPL data does not support a euphoric late-cycle interpretation at present, it also does not provide a standalone bullish signal. The technical charts still need to confirm a structural recovery, particularly through a breakout above $67K and the long-term descending trendline.

Β 

The post Bitcoin Price Analysis: BTC’s Rally Means Nothing Until It Reclaims This Key Level appeared first on CryptoPotato.

Bitcoin Price Analysis: Will BTC Finally Break Out of Consolidation Next Week?

16 August 2026 at 18:50

Bitcoin remains trapped in a low-momentum environment, with price action increasingly characterized by choppy consolidation rather than a decisive directional move. The lack of liquidity and volume continues to limit follow-through, while the current structure leaves room for another liquidity-driven move before a stronger trend develops.

Bitcoin Price Analysis: The Daily Chart

On the daily timeframe, BTC is still moving sideways after the sharp correction from the $66K area. The broader structure remains compressed, with the price currently around $63K and trading well below the major descending moving averages. The 100-day MA is still acting as an important overhead reference, while the declining white trendline reinforces the broader resistance structure.

The main scenario remains a lack of momentum. With market liquidity and volume appearing limited, the asset has been unable to establish a sustained breakout in either direction, resulting in a prolonged and choppy sideways phase. The first significant resistance is located around $66.2K-$67.2K, where the horizontal supply zone and descending trendline converge.

On the downside, the $58.5K-$59.8K region remains the most important major demand area visible on the chart. A deeper move into this zone would not necessarily invalidate the broader recovery structure, but a decisive breakdown below it would significantly weaken the bullish case.

For now, the absence of volume and momentum favors continued consolidation rather than an immediate breakout.

BTC/USDT 4-Hour Chart

The 4-hour structure provides a more defined setup. BTC has been compressing between a descending upper trendline and an ascending lower trendline, creating a tightening range. The asset is currently trading close to the lower boundary of this structure, around $63K, making the ascending trendline the key near-term support.

A break below this trendline would introduce a bearish scenario. If the breakdown is confirmed with follow-through, BTC could first revisit the $60.3K-$60.9K support zone, followed by the broader $58.1K-$59.6K area. This would also bring the lower liquidity clusters highlighted on the liquidation heatmap into focus.

On the upside, the descending trendline around $64.5K-$65K is the first obstacle. Above that, the $66.2K-$67.2K zone represents a much stronger resistance area. A breakout through this region would be required to materially improve the short-term structure.

Therefore, the immediate setup is largely defined by the two converging trendlines. A break below the ascending support would favor a deeper correction, while a breakout above the descending resistance would invalidate the near-term bearish structure.

Sentiment Analysis

The Binance liquidation heatmap highlights a significant concentration of liquidity around the current consolidation range, with particularly notable clusters extending through the $53K-$56K region. There is also substantial liquidity above the market around $66K-$67K and at higher levels.

This distribution is important because the market has spent an extended period moving sideways without generating a decisive directional impulse. In such an environment, liquidity clusters can become potential targets before the next sustained move develops.

The lower liquidity concentration is particularly notable. The heatmap suggests that a liquidity hunt below the $58K region remains possible if the current 4-hour support structure fails. Such a move could sweep leveraged positions and provide the liquidity needed for a subsequent recovery. However, this remains a potential scenario rather than a confirmed bottom signal.

Overall, the charts continue to point toward a market lacking momentum and volume. A downside liquidity sweep, potentially extending below $58K, could precede a stronger bullish cycle, but BTC would first need to reclaim the key resistance zones and demonstrate meaningful volume expansion to confirm that transition.

The post Bitcoin Price Analysis: Will BTC Finally Break Out of Consolidation Next Week? appeared first on CryptoPotato.

Ripple Price Prediction: Can XRP Defend $1 or Will $0.90 Come Into Play Next?

16 August 2026 at 17:50

XRP remains under pressure, with the broader structure still favoring the bears as the asset trades near the $1.00 area. The market has lost momentum after the previous decline, and the latest price action suggests that a sustained recovery has yet to develop.

Ripple Price Analysis: The Daily Chart

On the daily timeframe, XRP remains inside a clearly defined descending structure. The price is trading well below the major moving averages. This keeps the broader trend bearish despite the consolidation seen over the past several weeks.

The $1.02-$1.04 area is now an important resistance zone. XRP previously traded around this region before breaking lower, and the latest candles remain below it. A recovery above this zone would be an initial sign that buyers are attempting to regain control, although the descending trendline would remain a larger obstacle.

On the downside, the immediate structure is becoming increasingly important around the $1.00 psychological level. A sustained move below this area could expose the blue demand zone around $0.91-$0.97. This region represents the next major support visible on the chart and could become relevant if the current consolidation resolves to the downside.

For now, the lack of a meaningful bullish reversal suggests that the market is still in a corrective phase. A break above the descending trendline and the $1.02-$1.04 resistance zone would be needed to materially improve the daily structure. Otherwise, another test of the lower support area remains possible.

XRP/USDT 4-Hour Chart

The 4-hour chart provides a more immediate bearish picture. XRP has been forming lower highs beneath a descending trendline, while the recent rebound attempts have repeatedly failed to produce a meaningful structural breakout.

The asset is currently hovering around $1.00 and has already moved below the $1.02-$1.03 support area shown on the chart. This former support could now act as resistance if XRP attempts to recover. The descending trendline overhead further reinforces the bearish structure, making the $1.02-$1.07 region an important area for any potential reversal.

The current consolidation just below $1.00 suggests that sellers have not completely lost control, but momentum is also becoming compressed. If the $1.00 area fails decisively, the next major downside reference is the $0.91-$0.97 support zone visible on the daily chart.

Conversely, reclaiming $1.02-$1.03 and subsequently breaking the descending trendline would weaken the bearish setup. A stronger recovery above the $1.06-$1.08 area would provide a more convincing signal that the current downtrend is losing momentum. Until then, the path of least resistance remains tilted to the downside.

The post Ripple Price Prediction: Can XRP Defend $1 or Will $0.90 Come Into Play Next? appeared first on CryptoPotato.

Ethereum Price Analysis: Is $2K Still Possible After ETH Drops Below $1.9K?

15 August 2026 at 20:52

Ethereum remains trapped in a difficult consolidation phase, with weak liquidity and subdued trading activity preventing either side from establishing control. While ETH is holding near $1.88K, the latest short-term structural break introduces additional downside risk.

Ethereum Price Analysis: The Daily Chart

The daily chart continues to show a market suffering from a clear lack of momentum. ETH is trading around $1.88K, with the price action becoming increasingly choppy and compressed after the recovery from the $1.53K-$1.57K support zone.

A major factor behind this behavior appears to be the lack of liquidity and volume in the market. Neither buyers nor sellers have been able to generate enough sustained pressure to establish a directional move, resulting in sideways fluctuations around the 100-day moving average.

This moving average, currently near the $1.9K region, remains an important threshold. ETH has repeatedly traded around it but has failed to establish a convincing breakout and continuation above it. Meanwhile, the broader descending trendline is still nearby, adding another layer of technical resistance.

As a result, the market remains vulnerable despite the recovery from June’s lows. The immediate support zone is located around $1.80K-$1.84K. A decisive breakdown below this region could shift attention back toward the major $1.53K-$1.57K demand zone. Until volume and liquidity return, however, choppy sideways price action could remain dominant.

ETH/USDT 4-Hour Chart

The short-term picture has deteriorated compared with the previous structure. ETH had been respecting an ascending trendline from the early-July lows, but the latest price action has now broken below this trendline.

This breakdown is an early bearish signal, particularly because the market has subsequently remained beneath the former trendline rather than immediately reclaiming it. ETH is currently consolidating around $1.88K, while repeated attempts to generate upside momentum have remained limited.

The $1.80K-$1.84K blue demand zone is therefore the most important nearby support. If selling pressure increases and this area fails, the breakdown from the ascending structure could develop into a larger correction, potentially exposing the next major support around $1.71K-$1.75K.

Conversely, the bearish scenario would begin to weaken if ETH reclaims the broken trendline and pushes back toward the $1.95K-$1.98K resistance zone. A breakout above that region would be needed to restore a more convincing bullish continuation setup.

Sentiment Analysis

The Spot Average Order Size metric provides another indication that conviction may be fading. The chart categorizes spot activity according to the average size of executed orders, with the green observations representing larger whale orders and the gray observations reflecting more normal-sized activity.

During much of July and early August, green dots remained prevalent as ETH recovered from approximately $1.6K toward the $1.9K region, suggesting that larger orders were actively participating in the move. More recently, however, these green observations have disappeared and been replaced by gray dots around the current $1.9K price area.

This transition suggests a lack of clear directional conviction and an absence of the heavier orders that had previously supported the recovery. Notably, a similar shift is visible on the left side of the chart around early May. Green dots disappeared, and gray observations became dominant before ETH subsequently experienced a significant decline.

That historical similarity does not guarantee another selloff, but it adds weight to the cautious technical picture. With whale-sized spot orders currently absent, ETH may struggle to generate a sustainable breakout unless stronger participation returns. Combined with the 4-hour trendline breakdown and weak daily momentum, the latest on-chain behavior suggests downside risk should remain firmly on the radar.

The post Ethereum Price Analysis: Is $2K Still Possible After ETH Drops Below $1.9K? appeared first on CryptoPotato.

Bitcoin Price Analysis: Is $60K Back in Play After BTC’s Latest Rejection?

14 August 2026 at 18:15

Bitcoin is testing a critical support area after failing to break above the descending resistance structure that has capped the price for months. With BTC trading around $62.7K, the market is approaching a key decision point, while the elevated Exchange Whale Ratio adds a potentially bearish on-chain signal to the technical picture.

Bitcoin Price Analysis: The Daily Chart

The daily chart shows that Bitcoin remains within a broader corrective structure. After recovering from the June low near $58K, BTC established a series of higher lows and climbed toward the $66K resistance zone. However, the recovery has so far failed to produce a decisive breakout, and price has recently turned lower.

The most important resistance is currently around $66K-$67K, where the descending trendline, the horizontal supply zone, and the broader moving-average structure converge. A daily close above this area would represent a meaningful improvement in market structure and could open the way toward the $72K-$74K zone. Beyond that, the $80K-$82K region remains a major higher-timeframe resistance area.

On the downside, BTC is approaching the $60K support zone once again. This area will most likely attract buyers and is therefore important for maintaining the recent recovery structure. A decisive daily breakdown of this zone would increase the probability of a move below the $58K low and toward the next major support visible on the chart around $55K.

Momentum is also not particularly encouraging at the moment. The daily RSI is around the mid-40s and has turned lower, indicating that bullish momentum has weakened without yet reaching deeply oversold conditions. Meanwhile, BTC remains below the major moving averages, which continue to slope downward. As a result, the broader daily structure remains cautious to bearish until the $66K-$67K area is reclaimed.

BTC/USDT 4-Hour Chart

The 4-hour chart provides a more immediate picture of the current setup. BTC has been trading inside a contracting structure, with a descending upper trendline and a gradually rising lower boundary. The price is now pressing toward the lower end of this formation near $62K.

The immediate support zone is around $61.5K-$62K. The price is aggressively moving toward this area today, while the 4-hour RSI has also fallen to the low 30s, showing that short-term momentum has become weak and is approaching oversold territory. This leaves room for a relief bounce if buyers defend the support zone, although the RSI alone is not enough to confirm a reversal.

A rebound from the current area could initially target $65K high ,where the upper boundary of the triangle pattern is also located. This area is followed by the critical $66K-$67K resistance zone. Therefore, the market would first need to break the pattern to the upside before any short-term rally could materialize.

Conversely, a clean 4-hour breakdown below $61.5K-$62K area would invalidate the immediate bullish structure and likely expose the $58K-$60K demand zone. Therefore, the current region is particularly important, as a successful defense could preserve the consolidation or even lead to a rally, while a breakdown would signal another leg lower, which could be disastrous for Bitcoin holders and the crypto market as a whole.

On-Chain Analysis

The Exchange Whale Ratio measures the share of exchange inflows represented by the largest whale transactions. In the chart, the 30-day moving average of this metric has climbed sharply and is currently just below 0.32, close to the highest levels visible over the displayed period.

The elevated reading is notable because it comes while Bitcoin is trading near $62K and struggling to regain its major technical resistance levels. A high whale ratio means that whales account for a relatively large portion of coins entering exchanges, which can indicate increased potential selling pressure if those coins are subsequently sold.

The divergence between the elevated whale activity and weak BTC price action therefore represents a cautionary signal. It does not guarantee an immediate sell-off, but it suggests that the current support test should be treated carefully. If the Exchange Whale Ratio remains elevated while BTC loses the $62K zone, the on-chain and technical signals would increasingly point toward further downside, as it would indicate that the decline is driven by whale supply.

Β 

The post Bitcoin Price Analysis: Is $60K Back in Play After BTC’s Latest Rejection? appeared first on CryptoPotato.

Ripple Price Analysis: XRP Structure Remains Weak as $1 Support Comes Under Pressure Again

13 August 2026 at 17:18

XRP remains firmly in a corrective structure, with the token trading near $1.00 after months of lower highs and lower lows. While the current support zone could trigger a relief move, the broader trend remains bearish until the asset can reclaim several key resistance levels.

Ripple Price Analysis: The USDT Pair

On the XRP/USDT daily chart, the price continues to trade inside a descending channel and below the 100-day and 200-day moving averages shown on the chart. This keeps the broader market structure tilted to the downside.

XRP is currently testing the $1.00 support zone, which has acted as a local floor during the recent consolidation. Holding this area could give buyers an opportunity to build a base and initiate a recovery toward the first major resistance at $1.25-$1.30. This zone is particularly important as it aligns with the critical 200-day moving average, which is currently declining around the same area.

A breakout above the descending channel and the $1.30 supply zone would improve the technical picture and could open the door toward the $1.50-$1.60 resistance area. However, as long as XRP remains below the $1.25-$1.30 area, the prevailing downtrend remains intact.

If the $1.00 support fails, the next major downside area appears around $0.90. A sustained move below that zone would signal another significant structural breakdown that could push the price even deeper and toward the lower boundary of the large channel.

The BTC Pair

The XRP/BTC pair paints a similarly weak picture. The pair has broken below the 1,700 sats support level and continues to trade within a broader descending structure.

XRP/BTC is now approaching the 1,500 sats support zone. Holding this area could allow for a recovery back toward 1,700 sats, which has now become the first key resistance. Until that level is reclaimed, XRP appears likely to remain relatively weak against Bitcoin.

Overall, XRP is in a critical technical area on both charts. The 1,500 sat demand zone is the crucial level for buyers to defend on the BTC pair. A sustained defense of this area could also fuel a rebound against USDT, but the broader bearish structure remains in place unless XRP begins reclaiming the overhead resistance levels.

Β 

The post Ripple Price Analysis: XRP Structure Remains Weak as $1 Support Comes Under Pressure Again appeared first on CryptoPotato.

Ethereum Price Prediction: What Are ETH’s Chances of Breaking Above $2K Soon?

13 August 2026 at 16:55

Ethereum continues to lack decisive momentum, with the price remaining trapped in consolidation despite its recovery from the June lows. The market is now hovering around the 100-day moving average, while the lower timeframes show ETH compressed between clearly defined support and resistance zones.

Ethereum Price Analysis: The Daily Chart

On the daily timeframe, ETH is trading around $1.9K, with the latest candles showing little directional conviction. The most notable development is the horizontal consolidation that has formed around the 100-day moving average, which is currently passing through approximately the same region.

The market has repeatedly fluctuated around this moving average without establishing a sustained move on either side. This lack of momentum suggests neither buyers nor sellers have gained decisive control, leaving ETH in a neutral consolidation phase in the short term.

Nevertheless, the broader structure remains vulnerable. On the upside, the $2.06K-$2.15K zone is the first major resistance area, with the longer-term moving average also converging toward this region. A decisive breakout above it would provide considerably stronger evidence of a bullish structural shift.

Meanwhile, the nearest support sits around $1.81K-$1.84K. Losing this area would weaken the recent recovery and could eventually expose the much more significant $1.53K-$1.57K demand zone. Until either side of the current consolidation is broken with momentum, however, range-bound price action remains the more likely scenario.

ETH/USDT 4-Hour Chart

The 4-hour timeframe provides a clearer view of the current range. ETH is oscillating between the $1.80K-$1.84K demand zone and the $1.95K-$1.98K resistance area, with price currently near the middle of this structure at roughly $1.89K.

Importantly, the ascending trendline underneath the recent price action remains intact and is currently acting as dynamic support. The latest selloff briefly tested the trendline around the $1.86K-$1.87K region before buyers stepped in, preserving the sequence of higher lows that has developed since late June.

However, buyers have repeatedly struggled to generate enough momentum to break through the upper boundary. The $1.95K-$1.98K resistance zone has already rejected the market, making it the key obstacle to another bullish leg. A successful breakout could allow ETH to extend toward the upper boundary of the broader ascending channel around $2K and above.

Conversely, a breakdown below the ascending trendline would place renewed pressure on the $1.80K-$1.84K support zone. Losing both would represent a meaningful deterioration in the short-term structure and could open the door to a deeper correction toward the lower support areas.

Sentiment Analysis

The two-week liquidation heatmap captures the liquidity structure that has developed during ETH’s recent consolidation phase. With spot price moving sideways, leveraged positions have accumulated on both sides of the range, creating potential targets for short-term liquidity sweeps.

The most prominent nearby concentration appears above the market around $1.94K-$1.95K, almost directly overlapping with the technical resistance identified on the 4-hour chart. This makes the region particularly important, as a push through the recent highs could trigger short liquidations and potentially accelerate an upside move.

At the same time, slight liquidation liquidity is visible below the market, particularly through roughly the $1.80K-$1.85K region. This aligns closely with the 4-hour demand zone and means a downside sweep cannot be ruled out if the ascending trendline fails.

Overall, the heatmap reinforces the technical picture of a market trapped inside a range with liquidity accumulating at both extremes. Until ETH establishes a decisive breakout, sharp moves toward either side may primarily serve to clear leveraged positions before the market selects a more sustainable direction.

The post Ethereum Price Prediction: What Are ETH’s Chances of Breaking Above $2K Soon? appeared first on CryptoPotato.

Bitcoin Price Analysis: What Does BTC’s Bearish Market Structure Signal Next?

12 August 2026 at 19:19

Bitcoin remains trapped in a broad consolidation phase, with the price struggling to break above the descending resistance that has governed the market for several months. At around $63.5K, BTC is showing some short-term recovery, but the broader structure remains cautious until the key resistance zones are decisively broken.

Bitcoin Price Analysis: The Daily Chart

The daily chart shows Bitcoin trading below a descending trendline that connects the major highs since the beginning of the year. The trendline currently sits around the $66K area, making this the first major hurdle for the buyers. A daily breakout above this resistance would represent an important structural improvement and could open the door toward the $74K resistance zone.

The broader trend remains bearish-to-neutral; however, BTC is still trading below the major moving averages displayed on the chart. The longer-term moving averages are sloping downward, reinforcing the significance of the descending trendline.

On the downside, the $60K area represents an important support zone, while the broader $54K region is the next major demand area visible on the chart. Holding above these levels keeps the current consolidation structure intact, whereas a sustained breakdown could signal another leg lower.

BTC/USDT 4-Hour Chart

The 4-hour chart provides a more constructive picture in the short term. Bitcoin has been forming a tightening structure, with an ascending support trendline converging toward a descending resistance trendline. The price is currently around $64K, leaving the market relatively close to the upper boundary.

The key resistance is concentrated around $66K-$67K. A clean breakout above this zone, particularly if accompanied by a sustained move beyond the descending trendline, could trigger a continuation toward the $66K-$67K area and potentially higher.

Conversely, the rising support line and the $62K zone are the most important levels to watch on the downside. A break below this area would weaken the short-term bullish structure and could expose BTC to the $60K support zone again.

The 4-hour RSI has also rebounded from near-oversold conditions and is now recovering toward the middle of its range. This points to improving momentum, although it is not yet strong enough to confirm a sustained upside breakout. For now, the market appears to be waiting for a decisive break from the tightening range.

Sentiment Analysis

The funding-rate chart provides an interesting contrast to Bitcoin’s price action. Funding rates were deeply negative during the sharp sell-off earlier in the year, with several significant spikes below zero as BTC traded around the $70K-$80K region. This indicated that bearish positioning had become particularly aggressive.

Since then, funding has gradually normalized and has turned predominantly positive. The latest reading is around 0.006%, while Bitcoin is trading near $64K. This suggests that leveraged long positioning has returned, but the funding rate is not yet at an extreme level comparable to the highly crowded periods over the past few years.

That is broadly constructive, although it also introduces some short-term downside risk. If BTC fails to break the $65K-$67K resistance area while funding remains positive, long positions could become vulnerable to a liquidation-driven pullback. Conversely, a breakout accompanied by only moderately positive funding would provide a healthier setup, as it would suggest that the move is not being driven by excessive leverage.

Screenshot

Β 

The post Bitcoin Price Analysis: What Does BTC’s Bearish Market Structure Signal Next? appeared first on CryptoPotato.

Ethereum Price Analysis: Is ETH’s $2K Dream Dead After the Latest Rejection?

11 August 2026 at 19:00

Ethereum is consolidating around the $1.8K area after recovering from its June lows, but the broader structure remains under pressure. The daily chart shows ETH trading below important moving averages, while the 4-hour chart suggests that the recent recovery has entered a range. Meanwhile, the exchange supply ratio has continued to decline, pointing to a shrinking amount of ETH held on exchanges.

Ethereum Price Analysis: The Daily Chart

ETH is currently trading around $1.88K, with the daily structure still characterized by a series of lower highs from the earlier 2026 peak. The price remains below the descending white trendline, which has acted as dynamic resistance, as well as below the higher moving averages shown on the chart. The 100-day moving average is currently around $1.9K, making the region an important near-term resistance zone.

The latest price action appears to be forming a consolidation just below this resistance. A sustained daily breakout above the moving average and the $2.1K resistance zone would provide the first meaningful indication that the overall corrective structure is shifting. Above that area, the next major resistance sits around $2.4K, which is a key area for ETH’s recovery.

On the downside, the most immediate support is around the $1.8K short-term lows. This area is particularly important because ETH has repeatedly found buyers around it during the recent consolidation. A daily breakdown below this zone could expose the next support around $1.6K, which previously triggered the latest recovery, and would lead to a drop back into the broken descending channel, making the recent rally just another fake breakout.

ETH/USDT 4-Hour Chart

The 4-hour chart provides a somewhat more constructive picture. ETH has been moving inside a broad ascending channel since the June low, with the lower boundary gradually rising. The recovery pushed price toward the $1.96K resistance zone, but ETH failed to break through and has since pulled back toward the $1.8K support area.

The latest decline has brought the 4-hour RSI down toward the mid-to-lower range, indicating that short-term momentum has weakened following the rejection. However, the indicator is not yet showing an extreme oversold reading, leaving room for another test of the nearby support.

Holding $1.8K would keep the short-term bullish structure intact and could allow ETH to retest the $1.96K level. A successful breakout above that zone would open the way toward the upper channel boundary and the $2K resistance area.

Conversely, a decisive 4-hour close below $1.83K would weaken the current recovery structure. In that scenario, ETH could retrace toward the next support around $1.71K-$1.75K, while the broader demand zone around $1.62K would become relevant if selling pressure accelerates.

Overall, the 4-hour structure remains constructive as long as the $1.83K area holds, but ETH needs to reclaim the $1.96K-$2.05K region to establish a stronger bullish continuation.

On-Chain Analysis

The exchange supply ratio chart shows a notable divergence between ETH’s price and the amount of supply held on exchanges. The ratio has declined steadily from roughly 0.18 in mid-2025 to around 0.127 currently, while ETH is trading near $1.8K.

A declining exchange supply ratio generally means that a smaller share of ETH’s circulating supply is sitting on exchanges. This can reduce the amount of ETH immediately available for spot selling and can therefore provide a constructive longer-term backdrop, particularly if demand returns.

The chart also shows that the exchange supply ratio continued falling even as ETH recovered from the $1.5K area toward $1.8K. This suggests that the recent recovery has not been accompanied by a significant increase in exchange-held supply.

However, the metric should not be interpreted as a standalone bullish signal. Coins can leave exchanges for many reasons, including long-term custody and staking, and the declining ratio does not by itself confirm stronger demand. From a price perspective, ETH still needs to overcome the $2K resistance region to turn the improving on-chain backdrop into a clearer technical recovery.

Β 

The post Ethereum Price Analysis: Is ETH’s $2K Dream Dead After the Latest Rejection? appeared first on CryptoPotato.

Ripple Price Analysis: What Are XRP’s Next Targets if $1.00 Support Cracks?

10 August 2026 at 18:03

Ripple’s XRP remains under sustained selling pressure, with the latest price action pushing the asset back into a critical support area around $1.01-$1.04. Although this zone has attracted buyers before, the broader structure continues to favor sellers, making the current reaction particularly important for the next directional move.

Ripple Price Analysis: The Daily Chart

On the daily timeframe, XRP is trading near $1.03 after gradually declining back into the $1.01-$1.04 support zone. This marks another test of an area that already produced notable reactions in late June, yet the latest approach is occurring with relatively weak bullish momentum.

More importantly, the broader trend remains decisively bearish. The price continues to trade inside the large descending channel and well below all moving averages shown on the chart.

The recent sequence of lower highs also remains intact. The previous rebound was rejected around $1.14-$1.15, well before XRP could challenge the more important $1.24-$1.29 resistance zone. Therefore, buyers are increasingly dependent on the $1.01-$1.04 support area holding.

A convincing breakdown below $1.01 would weaken the structure further and could expose the lower $0.88-$0.93 demand zone, which also sits closer to the descending channel’s lower boundary. Conversely, defending current support could produce another relief rebound, but the asset would still need to reclaim higher resistance levels before the broader bearish outlook materially changes.

XRP/USDT 4-Hour Chart

The 4-hour chart highlights the immediate pressure more clearly. Since the late-July rejection, XRP has continued printing lower highs beneath the descending trendline, while successive rebounds have become increasingly shallow.

Most recently, the price broke into the $1.01-$1.04 support zone and briefly dipped toward roughly $1.02 before attempting to stabilize. However, the response has so far been modest, with XRP consolidating near $1.03 rather than producing an impulsive recovery. This suggests buyers are defending the area, but have not yet demonstrated enough strength to shift short-term momentum.

The first meaningful improvement would require price to reclaim the descending trendline, currently approaching the $1.07 area. Beyond that, the $1.13-$1.15 resistance zone represents the more important hurdle, as the previous rally was rejected at this region.

Until these levels are reclaimed, the possibility of another liquidity sweep below the recent lows remains elevated. A decisive loss of the $1.01-$1.04 support zone would confirm renewed bearish continuation and shift attention toward sub-$1 levels. Alternatively, a strong rejection from the current support followed by a breakout above the descending trendline could initiate a more substantial recovery toward $1.13-$1.15.

The post Ripple Price Analysis: What Are XRP’s Next Targets if $1.00 Support Cracks? appeared first on CryptoPotato.

Bitcoin Price Analysis: Here’s What the Charts Suggest for BTC Next Week

9 August 2026 at 20:31

Bitcoin remains trapped in a broader consolidation structure, with the latest recovery failing to generate convincing bullish momentum. The price is again approaching overhead supply, but buyers have yet to produce the type of breakout needed to signal a meaningful structural shift.

Bitcoin Price Analysis: The Daily Chart

On the daily timeframe, BTC is trading around $65K after recovering from the late-June lows. However, the rebound continues to lack strong bullish momentum, with recent candles becoming relatively compressed as the price approaches the $65.8K-$66.8K resistance zone.

This area has already capped previous recovery attempts and is now reinforced by the descending white trendline approaching from above. More importantly, Bitcoin remains well below the declining moving averages, leaving the broader market structure tilted to the bearish side despite the recent stabilization.

Therefore, the current advance still appears more like consolidation beneath resistance than the beginning of a confirmed bullish reversal. A decisive daily breakout above the $65.8K-$66.8K zone and the descending trendline would improve the outlook, while another rejection could shift attention back toward the major $57.8K-$60K demand region.

The hesitant price action also appears consistent with a market awaiting greater macro and geopolitical clarity. Developments surrounding US-Iran tensions and the Strait of Hormuz, along with upcoming US inflation data this month, could provide catalysts for volatility. Until a decisive move occurs, Bitcoin may remain vulnerable to sharp liquidity-driven fluctuations within its broader range.
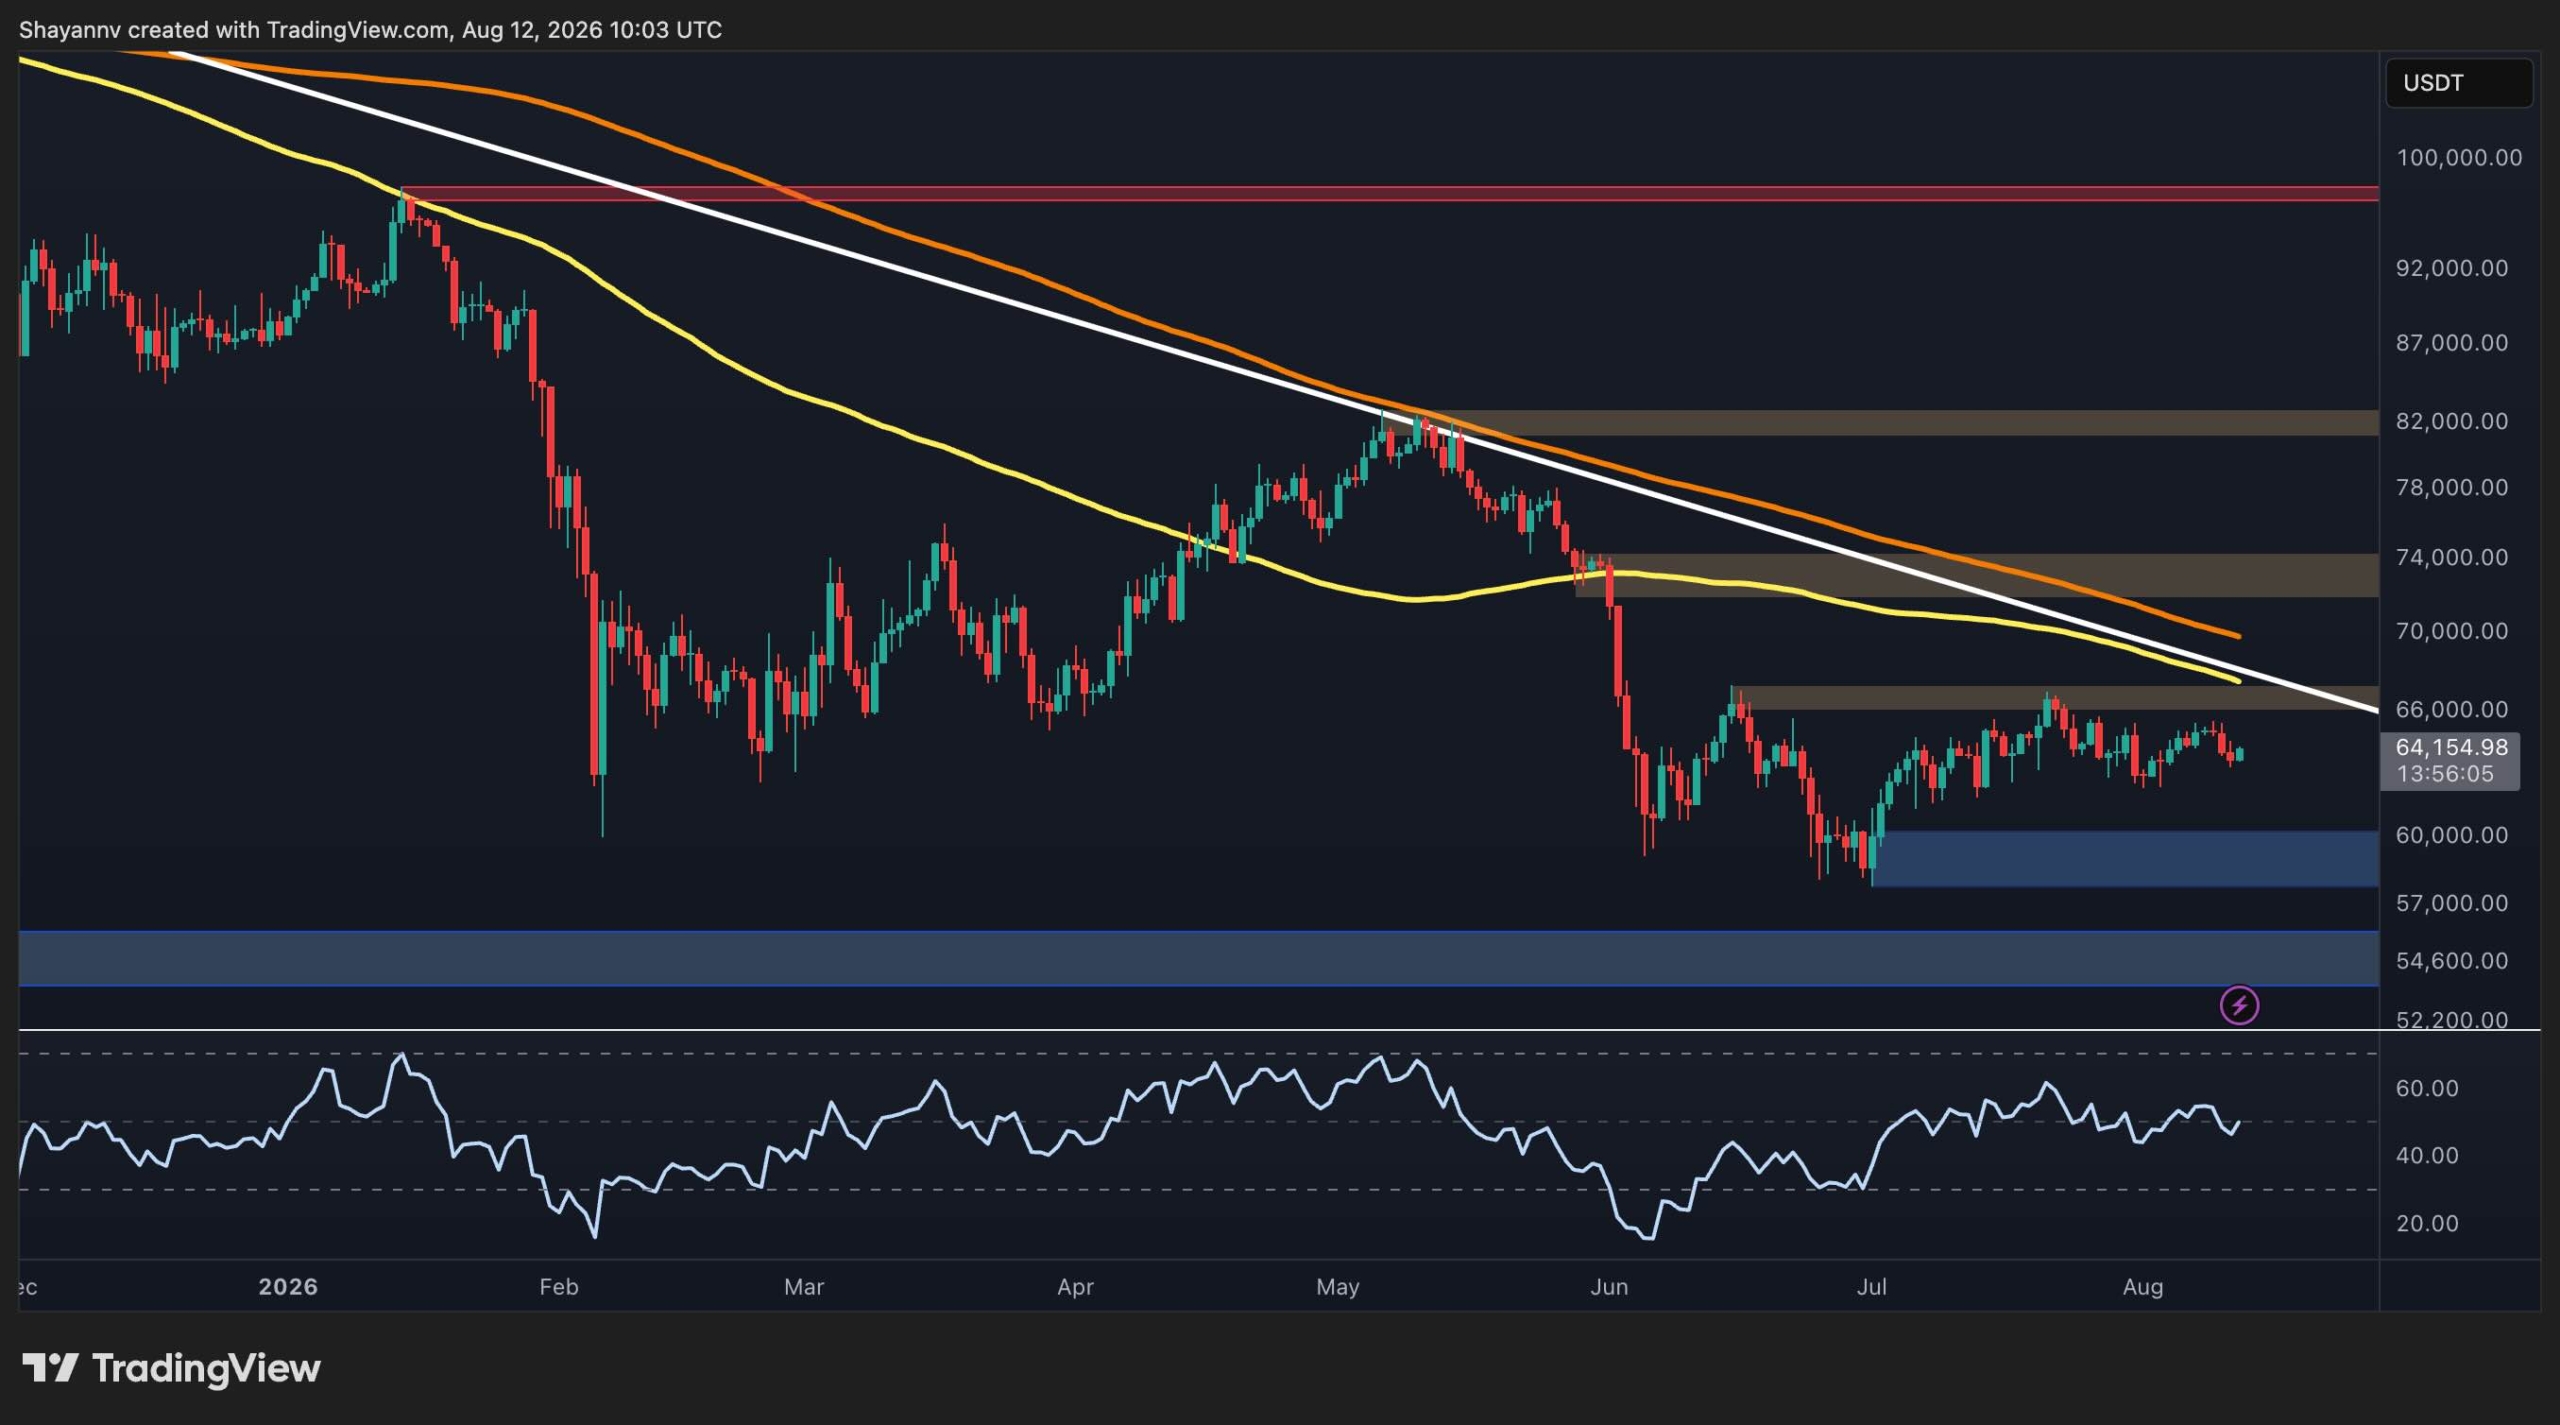
BTC/USDT 4-Hour Chart

The 4-hour chart makes the immediate challenge for buyers even clearer. BTC has recovered significantly from the $61.8K-$62.3K support zone, but the rally has repeatedly struggled to reclaim the orange resistance box around $64.8K-$65.4K.

Recent candles are consolidating around the lower boundary of this supply zone rather than breaking decisively through it. This inability to reclaim resistance despite the recovery from $62K suggests that bullish momentum is fading near a critical threshold.

As long as BTC remains below the $64.8K-$65.4K region, another rejection remains a significant possibility. Such a move could initially unwind the latest recovery and eventually expose the $61.8K-$62.3K support box once again.

Conversely, a clean breakout and sustained acceptance above $65.4K would weaken this bearish scenario and could allow buyers to challenge the larger $65.8K-$66.8K resistance area.

Onchain Analysis

The Realized Price UTXO Age Bands provide additional context for Bitcoin’s current market structure. The chart shows the realized prices of the 1-3 month and 3-6 month holder cohorts, which currently sit above spot price at approximately $67K and $72K, respectively.

With BTC trading near $65K, both groups are therefore holding coins at an aggregate unrealized loss. This creates an important overhead cost-basis structure. In particular, the 1-3 month cohort’s realized price around $67K is relatively close to the market and could act as resistance if BTC continues recovering, as recently underwater holders may use a return toward their cost basis to reduce exposure.

The 3-6 month cohort’s realized price around $72K represents another higher threshold. Reclaiming these realized-price bands would indicate that the market is absorbing potential supply from recent buyers and would strengthen the recovery narrative. Until then, their position above spot price complements the technical picture, where Bitcoin continues to face substantial resistance overhead.

The post Bitcoin Price Analysis: Here’s What the Charts Suggest for BTC Next Week appeared first on CryptoPotato.

Ethereum Price Analysis: Is ETH Primed for a Move to $2K Next Week?

9 August 2026 at 18:07

Ethereum is attempting to stabilize around $1.9K after its recent recovery, but the broader technical picture remains constrained by major overhead resistance. While short-term structure has improved, ETH still needs a decisive breakout to confirm that buyers are regaining control.

Ethereum Price Analysis: The Daily Chart

On the daily timeframe, ETH is trading around $1.92K and has recently pushed above the descending white trendline. This is a constructive development compared with the previous structure, as the trendline had acted as dynamic resistance throughout the broader decline.

However, the breakout has yet to translate into strong upside momentum. The asset is now confronting the declining 100-day moving average around $1.94K, while the larger $2.05K-$2.15K resistance zone sits directly above it. The 200-day moving average is also descending toward this region, creating a significant concentration of overhead resistance.

Therefore, the trendline breakout is an encouraging first step, but it does not yet confirm a broader bullish reversal. A sustained move above the $1.94K moving average would strengthen the case for an advance toward the $2.05K-$2.15K zone. Until that happens, rejection from current levels could send ETH back toward the $1.81K-$1.85K support region.

If that support fails, the larger $1.56K-$1.62K demand zone would become the next major downside target.

ETH/USDT 4-Hour Chart

The 4-hour timeframe presents a somewhat stronger short-term picture. ETH has rebounded from the $1.80K-$1.84K support zone and is now consolidating near $1.92K after establishing a sequence of higher lows from the early-August bottom.

Nevertheless, buyers are approaching a crucial test. The $1.95K-$1.98K resistance box marks the immediate supply zone and previously triggered a sharp rejection in late July. Price is currently consolidating just beneath this area, suggesting that the market is preparing for another attempt.

A breakout above the $1.95K-$1.98K region would likely open the door toward $2K and the upper boundary of the broader ascending structure. Conversely, another rejection would leave ETH vulnerable to a retracement toward the $1.80K-$1.84K support box.

The short-term bias has consequently improved, but confirmation still depends on buyers successfully clearing the resistance immediately overhead.

Sentiment Analysis

Ethereum’s funding-rate chart provides an interesting backdrop to the latest recovery. Funding rates measure the periodic payments between long and short perpetual-futures traders, with positive readings generally indicating that leveraged positioning is tilted toward longs.

The 14-period funding-rate EMA remains positive at roughly 0.006, but it has fallen substantially from its June peak near 0.01. At the same time, ETH has begun recovering toward $1.9K from its recent lows.

This divergence suggests that price is recovering without a comparable increase in leveraged-long enthusiasm. That can be constructive because the advance appears less dependent on increasingly crowded bullish positioning, reducing the immediate risk associated with excessive positive funding.

Still, funding remains above zero, meaning longs continue to pay shorts, and bullish positioning has not disappeared. If ETH breaks the $1.95K-$1.98K resistance zone while funding remains relatively contained, the move could have a healthier derivatives backdrop. A renewed surge in funding without a corresponding price breakout, however, would signal increasing leverage and raise the risk of another long-side flush.

The post Ethereum Price Analysis: Is ETH Primed for a Move to $2K Next Week? appeared first on CryptoPotato.

Ethereum Price Analysis: Can ETH Overcome Overhead Moving Averages?

7 August 2026 at 18:28

Ethereum has continued to stabilize following its sharp correction from the yearly highs, with buyers attempting to regain control after breaking out of the long-term descending channel. While the recovery has improved the near-term outlook, ETH still faces a cluster of major resistance levels overhead that must be reclaimed before a broader trend reversal can be confirmed.

Ethereum Price Analysis: The Daily Chart

On the daily timeframe, ETH is consolidating just above the broader descending channel’s higher boundary that has guided price action lower for several months. Although buyers have managed to push it back toward $1.9K, the asset is still trading beneath both the 100-day and 200-day moving averages, which are currently converging around the $1.95K and $2.05K levels, respectively. This continues to indicate that the broader market structure remains bearish despite the recent rebound.

The latest rally has also brought the price directly into an important horizontal resistance confluence around $1.9K to $2K. This is the first major obstacle for the buyers. A successful breakout above this region could pave the way toward the next resistance zone around $2.4K. On the downside, the key demand zone at $1.5K remains critical for ETH to build on.

The RSI has also recovered toward the neutral 50 level after previously reaching oversold conditions, suggesting bearish momentum has eased. Nevertheless, momentum has yet to shift decisively in favor of the buyers, making the reaction around the current resistance particularly important.

ETH/USDT 4-Hour Chart

On the 4-hour timeframe, Ethereum recently completed a breakout from a short-term descending channel, a pattern that typically signals weakening selling pressure and the potential for a bullish continuation. The breakout has already carried the price back above the immediate support zone around $1.85K, which is now acting as the first line of defense for buyers.

ETH is currently consolidating below the $2.1K resistance area. The recent recovery has kept the price within the upper half of the broader ascending channel that has developed since early June, suggesting buyers continue to defend higher lows.

If the breakout from the short-term descending channel remains valid, Ethereum could attempt another move toward the upper boundary of the larger ascending channel near the psychological $2K region. A clean break above that level would likely strengthen bullish momentum and expose the higher resistance around $2.1K.

Conversely, losing the $1.85K support would weaken the short-term bullish structure and could trigger another decline toward the $1.75K demand zone. A breakdown below that area would invalidate the recent push and shift momentum back in favor of the sellers.

On-Chain Analysis

The active addresses chart shows that Ethereum network activity remains subdued despite the recent price recovery. Daily active addresses have stabilized around the 400K range after declining significantly from the surge seen earlier in the year, with the 30-day exponential moving average continuing to trend lower.

This divergence between activity and price suggests that the latest price rebound has not yet been accompanied by a meaningful improvement in underlying network participation. Historically, sustained bullish phases tend to coincide with expanding user activity, whereas muted address growth often reflects cautious market participation.

While the stabilization in active addresses may indicate that network activity is beginning to find a floor, a stronger increase in on-chain participation would provide additional confirmation that the current recovery is supported by improving fundamentals rather than purely technical buying. Until then, Ethereum’s recovery appears constructive but still lacks broad on-chain confirmation.

Β 

The post Ethereum Price Analysis: Can ETH Overcome Overhead Moving Averages? appeared first on CryptoPotato.

Ripple Price Analysis: How Low Can XRP Go if It Loses $1 Support This Weekend?

7 August 2026 at 17:52

XRP remains under sustained selling pressure against both USDT and BTC, with the higher time frame structure continuing to favor the bears. The latest breakdown below the key horizontal support reinforces the prevailing downtrend and leaves the market vulnerable to another leg lower unless buyers quickly reclaim the lost levels.

Ripple Price Analysis: The USDT Pair

On the XRP/USDT chart, the price continues to trade inside a well-defined descending channel while remaining below the 100-day and 200-day moving averages. The 100-day MA has acted as a close dynamic resistance throughout the decline, while the 200-day MA continues to trend lower well above the current price, highlighting the weakness in the broader trend.

A potential breakdown of the $1-$1.05 support zone marks an important bearish development. This area has repeatedly attracted buyers over the past several weeks, but a breakdown would suggest demand is fading. If XRP breaks below this level, sellers will be in even more control.

The next major support sits around the $0.90 region, which should be defended at all costs. On the upside, the first resistance is the $1.25 zone, which is located between the key moving averages and just above the descending channel’s upper boundary. The broader resistance remains around $1.50, where previous distribution occurred.

Meanwhile, momentum also favors the sellers. The RSI has dropped toward the lower portion of its range without yet showing a convincing bullish divergence, suggesting downside momentum remains dominant despite approaching oversold territory.

The BTC Pair

The XRP/BTC pair paints an even weaker picture. The price has broken below the critical horizontal support around 1,700 sats, confirming a continuation of the prevailing downtrend after several weeks of sideways consolidation. The failed attempts to reclaim this level indicate that previous support has now turned into resistance.

The pair also remains below all major moving averages, with the 100-day average trading beneath the longer-term one, reinforcing the bearish market structure. Meanwhile, the asset continues to respect the descending channel that has guided the decline for several months.

The next area of interest is the lower support zone around 1,500 sats, which also coincides with the lower boundary of the descending channel. This region could attract buying interest, but a failure to hold it would be disastrous and further aggravate the bear market.

On the other hand, to improve the technical outlook, XRP would first need to reclaim the 1,700 sats level before challenging the 1,850 sats resistance zone. A stronger trend reversal would only become more likely if buyers also break above the descending channel resistance and push beyond the cluster of moving averages, which currently remain well overhead.

Overall, both XRP/USDT and XRP/BTC continue to display bearish market structures. While the price is approaching notable support areas that could trigger a short-term relief bounce, the broader trend remains negative until XRP begins reclaiming key horizontal levels and breaks above its long-term descending resistance.

The post Ripple Price Analysis: How Low Can XRP Go if It Loses $1 Support This Weekend? appeared first on CryptoPotato.

Bitcoin Price Analysis: BTC Battles Key $65K Barrier as Short Liquidation Cluster Builds

6 August 2026 at 18:39

Bitcoin has extended its recovery from recent lows and is now testing an important resistance region. While short-term momentum has improved, the asset is approaching an area that could determine whether the current rebound evolves into a larger breakout or another rejection within the broader consolidation.

Bitcoin Price Analysis: The Daily Chart

On the daily timeframe, Bitcoin continues to trade within its well-defined consolidation range. The recent rebound has carried the price back toward the major resistance zone at $66.2K to $66.8K, while the broader support remains at $57.8K to $60.2K.

Although buyers have regained short-term momentum, BTC is still trading beneath the declining 100-day and 200-day moving averages, which continue to reinforce the broader bearish structure. The descending long-term trendline also remains intact, adding further confluence around the overhead resistance.

For now, the market continues to favor range-bound conditions. A confirmed breakout above the $66.2K to $66.8K resistance would be the first signal that buyers are regaining control and could pave the way toward the next resistance around $72K to $74K. Until then, the current move appears to be another recovery leg inside the broader consolidation.

BTC/USDT 4-Hour Chart

The 4-hour chart shows that buyers have staged a strong recovery from the $61.8K to $62.3K demand zone, pushing Bitcoin back into the immediate resistance area around $64.8K to $65.4K.

This resistance has already rejected the price several times over the past two weeks, making it the key short-term barrier. A successful breakout above the $64.8K to $65.4K region would likely open the door for another rally toward the daily resistance around $66.2K to $66.8K.

However, failure to overcome this supply zone could trigger another rejection back toward the buyers’ defense at $61.8K-$62.3K, keeping BTC trapped within its broader consolidation range.

Sentiment Analysis

The latest two-week liquidation heatmap highlights a significant concentration of short liquidation liquidity above the current price, particularly around the $66K region. As Bitcoin continues pressing higher, this cluster becomes an attractive magnet for price, increasing the probability of an upward liquidity sweep.

If buyers manage to push through the nearby resistance, the liquidation of overleveraged short positions could trigger a short squeeze, accelerating bullish momentum toward higher resistance levels.

While a liquidation cluster also exists below the current market, it primarily reflects aggressive long positioning. For now, the more considerable and more attractive liquidity target remains overhead, favoring an upside sweep if buyers can maintain control.

The post Bitcoin Price Analysis: BTC Battles Key $65K Barrier as Short Liquidation Cluster Builds appeared first on CryptoPotato.

Ethereum Price Analysis: ETH Clears $1.9K, but a Bigger Test Awaits

5 August 2026 at 21:51

Ethereum is attempting to stabilize after recovering from its June lows, but the broader trend has yet to shift decisively in favor of the bulls. While the daily chart still reflects a bearish market structure beneath key moving averages, the 4-hour timeframe shows improving short-term momentum as price presses against key resistance levels.

Meanwhile, on-chain data continues to provide a constructive backdrop, with exchange balances falling to fresh cycle lows.

Ethereum Price Analysis: The Daily Chart

ETH is trading around $1.92K after rebounding from the $1.6K demand zone, where buyers stepped in aggressively following the sharp June selloff. The recovery has carried price back above a major confluence resistance formed by the long-term descending trendline and the 100-day moving average near $1.9K.

Despite the bounce, Ethereum remains below both the 100-day and 200-day moving averages, with the 200-day MA still trending lower near the $2.1K region. As long as the asset remains beneath these dynamic resistance levels, the broader market structure continues to favor sellers.

The first key resistance lies at $2.1K, where the mentioned 200-day moving average intersects with a major supply zone. A successful breakout above this cluster could expose the next resistance zone around $2.4K, which previously acted as a major distribution area.

On the downside, the immediate support is located around $1.85K, followed by the stronger demand zone at $1.6K. Losing the $1.85K area and dropping back inside the descending channel would invalidate the recent recovery attempt and likely reopen the path toward the $1.6K demand zone and potentially lower.

ETH/USDT 4-Hour Chart

The lower timeframe presents a more constructive picture. ETH has spent the past several sessions consolidating above the $1.85K support zone while gradually compressing beneath a descending trendline that has capped the price since the late-July high.

This structure resembles a short-term falling wedge or descending channel breakout attempt, with buyers repeatedly defending higher lows despite continued selling pressure from trendline resistance.

A decisive breakout above the descending trendline could trigger a move toward the psychological $2K level and the larger ascending channel’s upper boundary. Clearing those levels would strengthen the case for a continuation toward the daily resistance cluster near $2.2K and even $2.4K.

However, failure to break the trendline could lead to a breakdown of the $1.85K support, and if that zone gives way, ETH may revisit the broader demand area around $1.75K before buyers attempt another recovery.

On-Chain Analysis

The Exchange Supply Ratio continues to trend lower, reaching approximately 0.127, the lowest reading shown on the chart. This persistent decline indicates that a smaller proportion of Ethereum’s circulating supply is being held on centralized exchanges.

Historically, falling exchange balances suggest investors are moving coins into self-custody or long-term storage rather than preparing them for immediate sale. While this metric does not guarantee higher prices in the short term, it generally reflects declining spot sell-side pressure and improves the medium-term supply dynamics.

The combination of shrinking exchange reserves and ETH holding above a key support zone creates a constructive backdrop. Nevertheless, price confirmation remains essential. A sustained move above the descending trendline and the $2.2K resistance cluster would be needed to align the improving on-chain picture with a confirmed bullish technical reversal.

The post Ethereum Price Analysis: ETH Clears $1.9K, but a Bigger Test Awaits appeared first on CryptoPotato.

Bitcoin Price Analysis: Will BTC Break Above $66K or Fall Below $62K Next?

4 August 2026 at 17:18

Bitcoin continues to trade within a well-defined consolidation range after failing to establish a meaningful recovery from its late June lows. While short-term price action has stabilized above key support, the broader structure remains neutral to bearish, with overhead resistance still capping every rally. At the same time, the Coinbase Premium Index remains in negative territory, suggesting that US spot demand has yet to return in a convincing manner.

Bitcoin Price Analysis: The Daily Chart

On the daily timeframe, BTC continues to trade around $63.5K after spending several weeks ranging beneath the $67K resistance zone. This area has repeatedly rejected bullish advances and now represents the first major hurdle for buyers.

The broader trend remains bearish as the price continues to trade below both the 100-day and 200-day moving averages, which are sloping downward around the $68K and $70K regions, respectively. These moving averages reinforce the bearish higher-timeframe structure and create a strong confluence resistance zone above the market.

On the downside, the first important demand area remains at $60K, where buyers previously stepped in to defend the market following the sharp June decline. Below that, the final major support sits around $54K, which would likely become the next downside target if the current range eventually breaks lower.

Meanwhile, momentum remains relatively muted. The RSI is hovering around the midpoint near 50, reflecting a balanced market with neither buyers nor sellers maintaining clear control. Unless BTC reclaims the $67K resistance area, the broader structure continues to favor range-bound trading rather than the beginning of a sustained recovery.

BTC/USDT 4-Hour Chart

The lower timeframe highlights a market that is consolidating above the $62K short-term support after several failed attempts to break lower.

The asset has recently bounced from this demand zone and is now trading inside a small fair value gap formed around $63K. This imbalance is acting as the immediate short-term support, and buyers will need to rebound from this area before attempting another move toward the range highs.

As long as BTC holds above the $62K support, another push toward $66K remains possible. However, repeated failures around the upper boundary would continue to strengthen the existing range and increase the probability of another rotation back toward support.

To the downside, a decisive breakdown below $62K would invalidate the current short-term recovery and expose the broader $60K demand zone once again.

Sentiment Analysis

The Coinbase Premium Index continues to paint a cautious picture despite Bitcoin’s recent stabilization. The metric remains below the zero line, currently around -0.08, indicating that BTC is still trading at a discount on Coinbase relative to offshore exchanges.

Historically, sustained positive Coinbase Premium readings have coincided with stronger buying activity from US institutional and spot investors. In contrast, persistent negative values often reflect weaker spot demand or relatively stronger selling pressure from US participants.

Although the index has recovered from the deeply negative readings recorded during previous selloffs, it has yet to establish a sustained move back into positive territory. This suggests that the recent price stabilization has not been accompanied by meaningful accumulation from Coinbase participants.

As a result, Bitcoin’s recovery appears to be driven more by short-term positioning than by strong spot demand from US investors. A sustained move of the Coinbase Premium Index above zero would strengthen the bullish case as it would show large US investors and institutional traders returning, while continued negative readings would leave the market vulnerable to renewed downside pressure if key support levels begin to fail.

The post Bitcoin Price Analysis: Will BTC Break Above $66K or Fall Below $62K Next? appeared first on CryptoPotato.

Ripple Price Analysis: XRP Struggles Against USDT but BTC Pair Paints a Much Bleaker Picture

4 August 2026 at 17:09

XRP is still trading within a long-term bearish structure across both its BTC and USDT pairs. Although sellers have slowed their momentum in recent weeks, the price has yet to reclaim any meaningful resistance. This has left the broader trend tilted to the downside. Meanwhile, the current consolidation appears to be taking place at a critical support area that could determine the next major move.

Ripple Price Analysis: The USDT Pair

Against USDT, XRP remains confined within a descending channel while trading below both the 100-day and 200-day moving averages, keeping the broader trend bearish. The 100-day MA around $1.20 serves as the first dynamic resistance, while the 200-day MA near $1.35 strengthens the overhead resistance.

The price is holding just above the key $1 support zone, which has repeatedly attracted buyers over the past several weeks. However, the failure to reclaim the channel’s upper boundary or establish higher highs suggests bullish momentum remains limited. A breakdown below $1, on the other hand, could open the door for a decline toward the next major support around $0.90, or even lower.

On the upside, the first resistance lies between $1.25 and $1.30, where horizontal resistance aligns closely with the descending moving averages. A valid breakout above this area would be the first indication of improving momentum, while a broader trend reversal would likely require a break above the $1.50 to $1.55 supply zone.

The BTC Pair

The XRP/BTC pair also remains in a clear downtrend, with the price trading inside a descending channel and again, below both the 100-day and 200-day moving averages. The recent loss of the 1,700 sats support level has shifted market structure further in favor of the sellers, with that area now acting as immediate resistance.

Since breaking below 1,700 sats, XRP has been consolidating without any meaningful bullish momentum, suggesting sellers remain in control. As long as this level caps price action, the pair could extend its decline toward the next major support around 1.500 sats, which coincides with the lower boundary of the large channel.

A recovery above 1,700 sats, however, would be the first sign of improving sentiment, exposing the next resistance levels at 1,900 sats and 2,000 sats. However, until XRP reclaims these levels and breaks above the key moving averages and the descending channel, any rebound is likely to remain corrective rather than signaling a broader trend reversal.

Β 

The post Ripple Price Analysis: XRP Struggles Against USDT but BTC Pair Paints a Much Bleaker Picture appeared first on CryptoPotato.

Ethereum Price Analysis: ETH’s Double Rejection at $2K Spells More Trouble Ahead

2 August 2026 at 17:30

After several failed attempts to extend its recovery, Ethereum is beginning to show signs of exhaustion beneath the major100-day MA. The latest rejection from this zone has weakened short-term momentum and increases the probability of a broader pullback if key support levels fail to hold.

Ethereum Price Analysis: The Daily Chart

On the daily timeframe, ETH’s outlook is gradually shifting toward a bearish bias after multiple failed attempts to reclaim the 100-day moving average. The repeated rejection from this dynamic resistance around $1.95K, combined with the emergence of bearish daily candles, suggests buyers are losing momentum.

Meanwhile, Ethereum continues to struggle with the descending channel, with the upper boundary represented by the white trendline serving as the most critical support.

If sellers manage to push the price back inside this channel, it would confirm a bearish continuation and likely trigger a deeper decline toward the $1.56K to $1.64K demand zone. On the upside, bulls must first reclaim the $1.88K to $1.91K resistance area before attempting another move toward the 100-day MA near $1.95K.

ETH/USDT 4-Hour Chart

The 4-hour chart has turned more bearish after Ethereum broke below its ascending trendline, signaling that buyers have lost short-term control. This breakdown shifts the focus toward lower support levels unless bulls can quickly reclaim the broken structure.

The first support now lies within the $1.85K to $1.87K demand zone, where price is currently attempting to stabilize. Losing this area would likely accelerate the decline toward the next major demand zone between $1.75K and $1.79K.

On the other hand, the $1.88K to $1.91K supply zone has become the primary threshold for buyers. A successful reclaim of this region would invalidate the immediate bearish scenario and could allow Ethereum to challenge the descending resistance and the 100-day moving average once again.

Sentiment Analysis

The Coinbase Premium Index remains in negative territory, indicating that Ethereum continues to trade at a discount on Coinbase relative to other major exchanges. This persistent negative premium suggests buying pressure from U.S.-based institutional participants remains relatively weak despite the recent recovery.

Historically, sustained positive readings have accompanied stronger bullish phases, whereas prolonged negative values often reflect cautious institutional sentiment. Until the premium returns to positive territory and remains there consistently, the current rebound may struggle to develop into a sustained uptrend, leaving Ethereum vulnerable to additional downside pressure if technical support levels begin to fail.

The post Ethereum Price Analysis: ETH’s Double Rejection at $2K Spells More Trouble Ahead appeared first on CryptoPotato.

XRP Price Analysis: Is a Drop Below $1 Inevitable as Sellers Stay in Control?

2 August 2026 at 17:16

Ripple’s XRP remains under steady selling pressure as the latest rebound attempts continue to lose momentum. The recent price action suggests sellers are maintaining control, while buyers are once again being forced to defend a critical support area.

Ripple Price Analysis: The Daily Chart

The daily chart shows little improvement compared to the previous analysis. The asset continues to trade beneath the descending resistance trendline while remaining well below the major moving averages, preserving the broader bearish market structure.

The latest candles indicate that sellers remain in control after another failed recovery attempt, pushing the price back toward the key demand zone around $1.01 to $1.04. This support has repeatedly prevented a deeper decline over the past several weeks, making it the most important level to monitor.

As long as XRP remains below the descending trendline and the main resistance between $1.24 and $1.29, the broader outlook favors continued weakness. A decisive breakdown below the $1.01 to $1.04 support zone would likely accelerate the decline toward the next major support around $0.89.

XRP/USDT 4-Hour Chart

On the 4-hour timeframe, rather than recovering from support, XRP has continued to print lower highs and lower lows while remaining capped by the descending resistance trendline.

The recent rejection near $1.09 was followed by another decline toward the $1.01 to $1.04 demand zone, showing that buyers have yet to regain control. This area remains the last significant short-term defense for the bulls.

If this support fails, the bearish momentum is likely to intensify and extend the decline toward lower levels. Conversely, buyers would first need to reclaim the descending trendline before any meaningful recovery toward the $1.24 to $1.29 resistance zone could be considered. Until then, rallies are likely to face selling pressure and remain corrective in nature.

The post XRP Price Analysis: Is a Drop Below $1 Inevitable as Sellers Stay in Control? appeared first on CryptoPotato.

Bitcoin Price Analysis: Will the Next Liquidity Sweep Push BTC Below $60K?

2 August 2026 at 17:05

Bitcoin continues to trade without a decisive directional bias as both buyers and sellers defend key technical levels. Until one side forces a confirmed breakout, the current environment is likely to remain dominated by range-bound price action and short-term liquidity grabs.

Bitcoin Price Analysis: The Daily Chart

The daily chart suggests Bitcoin is still locked in a prolonged consolidation phase between the major support around $57.8K to $60.2K and the primary resistance at $66.2K to $66.8K. Despite several attempts by both buyers and sellers, neither side has managed to establish a sustained trend beyond these boundaries.

This type of market structure typically favors liquidity sweeps and stop hunts around local highs and lows before a genuine directional move develops. As long as the asset remains trapped between these two zones, traders should expect continued choppy price action rather than a sustained trend.

A confirmed breakout above the $66.2K to $66.8K resistance could trigger another leg toward the higher resistance around $72K to $74K. Conversely, losing the $57.8K to $60.2K demand zone would invalidate the current consolidation and expose Bitcoin to a deeper correction.

BTC/USDT 4-Hour Chart

On the 4-hour timeframe, Bitcoin is trading inside an even tighter range within the broader daily consolidation. Buyers continue defending the support region at $61.8K to $62.2K, while sellers repeatedly cap rallies below the resistance around $64.9K to $65.6K.

Holding above the buyers’ defense could allow another recovery attempt toward the upper boundary of this range. However, the recent sequence of lower highs indicates that sellers still hold a slight advantage, making a breakdown below the $61.8K to $62.2K support zone the more likely scenario if buying momentum continues to weaken. Such a move could accelerate selling pressure toward the lower boundary of the broader daily range.

Sentiment Analysis

The two-week liquidation heatmap shows a notable concentration of liquidity just beneath Bitcoin’s recent lows. This suggests futures market participants have been actively defending that area, with buyers stepping in to absorb selling pressure whenever the price approaches the lower liquidity cluster.

At the same time, a substantial pool of liquidity remains above the market around the $66K to $67K region, indicating that both sides still have attractive liquidation targets. As long as Bitcoin remains inside its broader consolidation, the price is likely to continue oscillating between these liquidity zones before a decisive breakout determines the next major trend.

The post Bitcoin Price Analysis: Will the Next Liquidity Sweep Push BTC Below $60K? appeared first on CryptoPotato.

Bitcoin Price Analysis: Is BTC Heading Below $60K After the Latest Rejection?

31 July 2026 at 16:52

Bitcoin is still under pressure across the higher time frame despite stabilizing above recent swing lows. While the short-term structure has shifted into consolidation, the broader trend continues to favor sellers unless BTC can reclaim several key resistance levels.

Meanwhile, futures market data shows aggressive market buying beginning to return, potentially laying the groundwork for a relief rally if the price confirms the move.

Bitcoin Price Analysis: The Daily Chart

The daily chart shows BTC trading around $63.3K after its sharp late May breakdown from the $74K region. The selloff pushed the asset well below both the 100-day moving average, currently around $69K, and the 200-day moving average near $71K, leaving the broader market structure bearish.

Since the decline, BTC has entered a sideways consolidation between roughly $60K and $67K. Buyers have repeatedly defended the lower boundary of this range, while the $67K resistance zone continues to cap every recovery attempt.

Beyond the major resistance at $67K, the confluence of the 200-day moving average and the $72K to $74K supply zone is the next potential target, if an upside move materializes. A successful reclaim of those levels would improve the medium-term outlook and could expose the next resistance around $82.5K.

On the downside, immediate support remains around $60K. Losing this level would likely shift attention toward the broader support area around $54K if selling pressure accelerates, which will make the bear market both longer and deeper.

BTC/USDT 4-Hour Chart

The 4-hour timeframe shows Bitcoin consolidating after breaking below a rising channel that had supported the recovery throughout July. The channel breakdown suggests that bullish momentum has weakened and that the recent advance has transitioned into a corrective phase.

The price is currently testing the short-term support around $63K to $63.5K after rejecting the $65K resistance area. As long as this support holds, BTC could continue ranging inside this zone or potentially have another go at the $65K resistance in the coming weeks. On the other hand, a decisive breakdown below $63K would likely increase the probability of another move toward the previous demand zone around $60K.

On the upside, reclaiming the resistance area around $65K to $65.5K would be the first indication that buyers are regaining control, with the broader resistance near $67K remaining the key hurdle for a stronger recovery.

Sentiment Analysis

The Taker Buy Sell Ratio offers insight into whether market participants are executing more aggressive buy orders or sell orders. Values above 1 generally indicate buyers are taking the initiative, while readings below 1 suggest sellers remain dominant.

Although Bitcoin’s price has remained trapped near $64K, the 100-period EMA of the Taker Buy Sell Ratio has climbed above the neutral 1.0 level and continues to hold above the threshold. This divergence indicates that aggressive buying activity has strengthened even as price has failed to respond meaningfully.

Historically, sustained periods where taker buying leads while price consolidates can precede stronger directional moves if spot demand eventually absorbs overhead supply. While this does not guarantee an immediate breakout, it suggests underlying demand is improving beneath the surface.

For now, this bullish futures signal still requires confirmation from price. A break above the $67K resistance zone would align improving order flow with bullish price action, while a loss of the $60K support area would invalidate the near-term constructive outlook despite the positive shift in taker behavior, and potentially lead to another long liquidation cascade.

Β 

The post Bitcoin Price Analysis: Is BTC Heading Below $60K After the Latest Rejection? appeared first on CryptoPotato.

Ethereum Price Analysis: ETH Holds Key Support but Bullish Momentum Fades

30 July 2026 at 18:19

Ethereum continues to trade within a critical technical area after recovering sharply from its June lows. While the broader rebound remains intact, the latest price action suggests momentum is fading as buyers and sellers battle for control beneath major resistance.

Ethereum Price Analysis: The Daily Chart

On the daily timeframe, Ethereum remains below both the 100-day and 200-day moving averages, keeping the broader trend cautious despite the recovery from the June bottom. The recent rally stalled just below the 100-day MA near the $1.95K region, where sellers quickly stepped in and pushed the price back toward the $1.88K to $1.91K supply zone.

This area is now acting as immediate resistance. A successful breakout above it would improve the medium-term outlook and expose the confluence of the 100-day and 200-day moving averages inside the $2.02K to $2.15K resistance zone. Until then, ETH remains vulnerable to another rejection.

On the downside, the $1.75K to $1.79K demand zone remains the first important support. Losing this area would likely trigger a deeper correction toward the major demand region around $1.56K to $1.64K.

ETH/USDT 4-Hour Chart

The 4-hour chart shows Ethereum trading inside a compression pattern, with price action confined between the rising white trendline and the descending yellow trendline. This narrowing range reflects increasing indecision as neither buyers nor sellers have been able to establish a decisive directional move.

Ethereum is currently consolidating around the $1.88K to $1.91K resistance zone while continuing to respect the ascending support trendline. A breakout above both the resistance zone and the descending trendline would likely strengthen bullish momentum and pave the way for another attempt at the recent highs.

However, a breakdown below the white ascending trendline would invalidate the current sequence of higher lows and could accelerate a correction toward the $1.75K to $1.79K demand zone, where buyers would be expected to defend the broader recovery structure.

Sentiment Analysis

The two-week Binance liquidation heatmap highlights a notable concentration of liquidity above the current price around the $2K level, making it the primary upside liquidity target if buyers regain momentum.

At the same time, a significant liquidation cluster has formed around the $1.82K region beneath the market. Since price is currently trading between these two liquidity pools, Ethereum may continue to experience choppy and range-bound price action before making a decisive move toward one of these high-liquidity areas. A sweep of either cluster could trigger increased volatility as leveraged positions are liquidated.

The post Ethereum Price Analysis: ETH Holds Key Support but Bullish Momentum Fades appeared first on CryptoPotato.

❌